
















Copyright: ©Author(s) 2026.
World J Gastrointest Oncol. Oct 15, 2026; 18(10): 119879
Published online Oct 15, 2026. doi: 10.4251/wjgo.119879
Published online Oct 15, 2026. doi: 10.4251/wjgo.119879
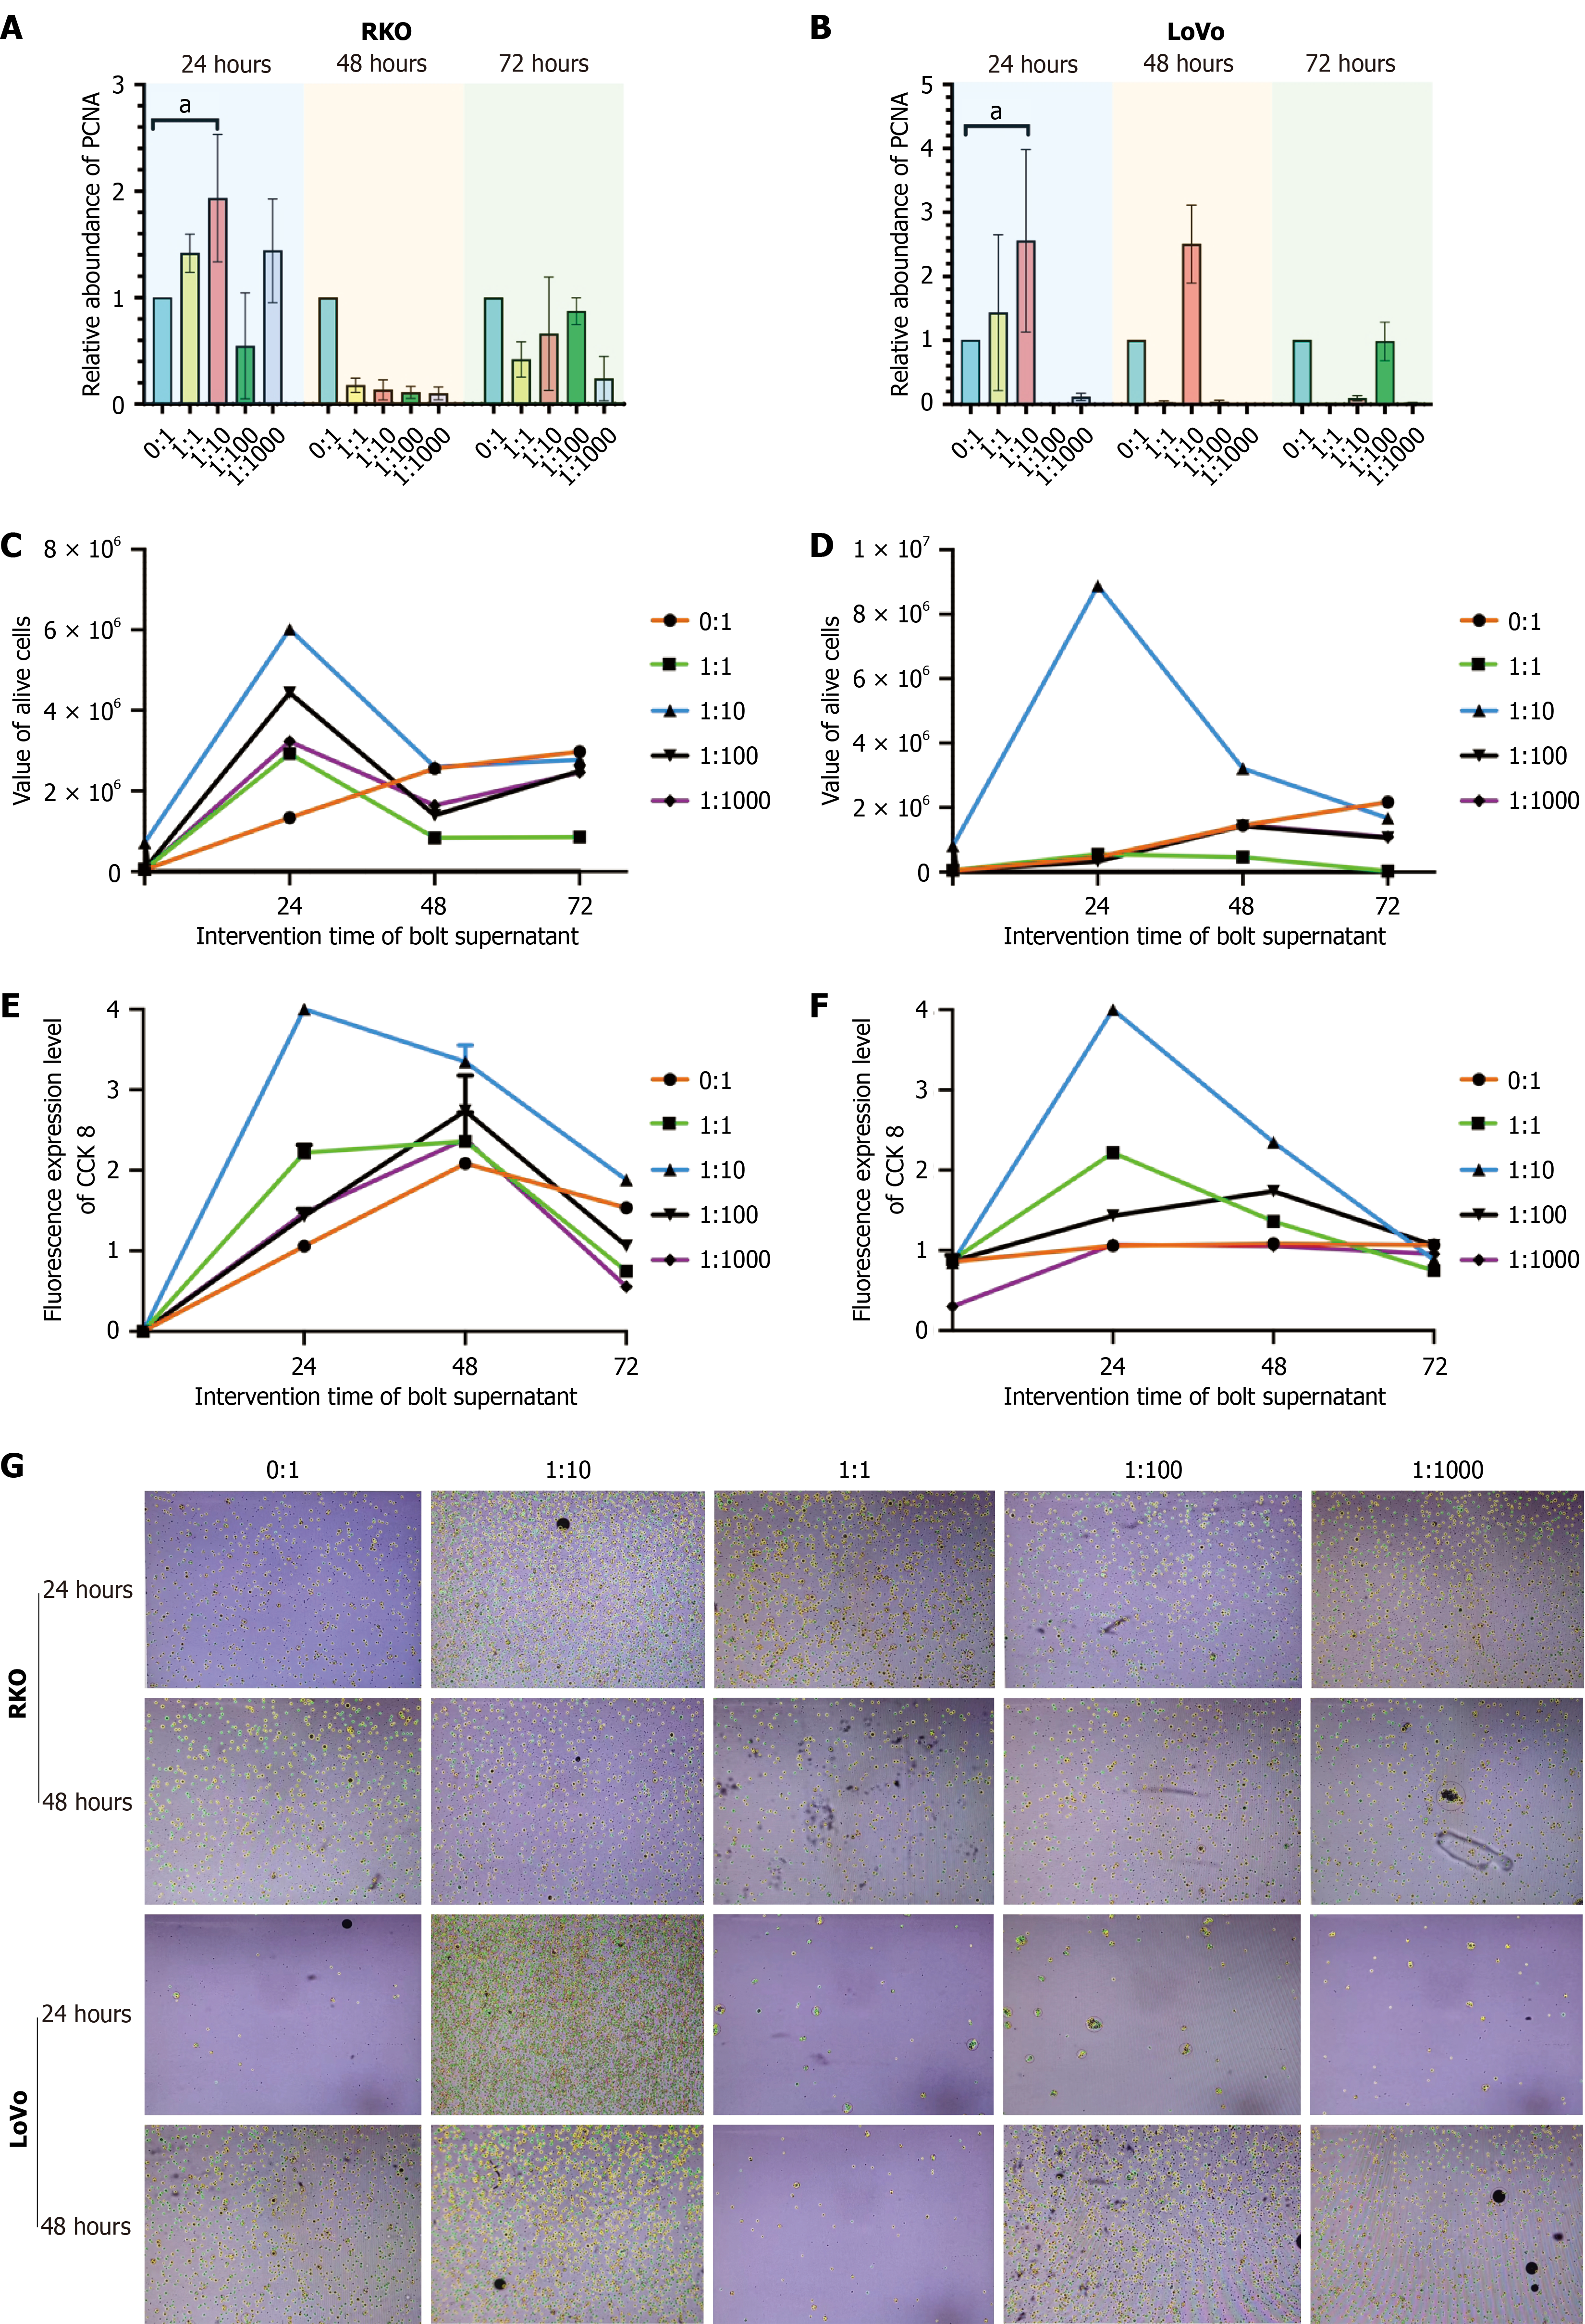
Figure 4 Effects of Bolteae supernatant on proliferating cell nuclear antigen expression and proliferation of colorectal cancer cells.
A and B: Quantitative polymerase chain reaction analysis of the expression level of proliferating cell nuclear antigen (PCNA) in colorectal cancer cells. There was a significant difference between the intervention group and the non-intervention group, aP < 0.05, n = 6. The vertical axis represents the relative abundance of PCNA in RKO (Figure 4A) and LoVo cells (Figure 4B), while the horizontal axis represents different times and intervention concentrations; C and D: Direct cell counting results. RKO colorectal cancer cells (Figure 4C) and LoVo colorectal cancer cells (Figure 4D) were counted at various time points following treatment with different concentrations of Bolteae supernatant; E and F: Cell proliferation measured using the Cell Counting Kit-8 assay. After transfection, absorbance was measured using a fluorescence spectrophotometer. Significant differences (P < 0.05) were observed compared to untreated and other intervention conditions. Spectroscopic measurements of RKO colon cancer cells (Figure 4E) and LoVo colon cancer cells (Figure 4F) at different time points after intervention with various concentrations of Bolteae supernatant are shown. Cells treated with a 1:10 ratio of the supernatant demonstrated the most significant proliferation within 24 hours; G: Representative images taken by an image-based cell counting instrument. Viable cells are distinguished by their larger and more uniform volume, while debris appears smaller and irregularly shaped. Viable cells remain unstained (bright), whereas non-viable cells are stained (dark/blue). The software quantifies the identified viable and non-viable cells and, combined with the known sample volume, automatically calculates the concentration of live cells (Figure 4C and D), accompanied by the display of the captured image. Data were analyzed using analysis of variance.
- Citation: Lai Y, Xu JH, Chen YJ, Luo H, Lin Y, Yu YF, Chen QK. Enterocloster bolteae drives hyperglycemia-associated colorectal cancer cell proliferation via Rac/Rho-MSH6-Elongin C signaling pathway. World J Gastrointest Oncol 2026; 18(10): 119879
- URL: https://www.wjgnet.com/1948-5204/full/v18/i10/119879.htm
- DOI: https://dx.doi.org/10.4251/wjgo.119879