Copyright
©The Author(s) 2025.
World J Gastrointest Oncol. Aug 15, 2025; 17(8): 109489
Published online Aug 15, 2025. doi: 10.4251/wjgo.v17.i8.109489
Published online Aug 15, 2025. doi: 10.4251/wjgo.v17.i8.109489
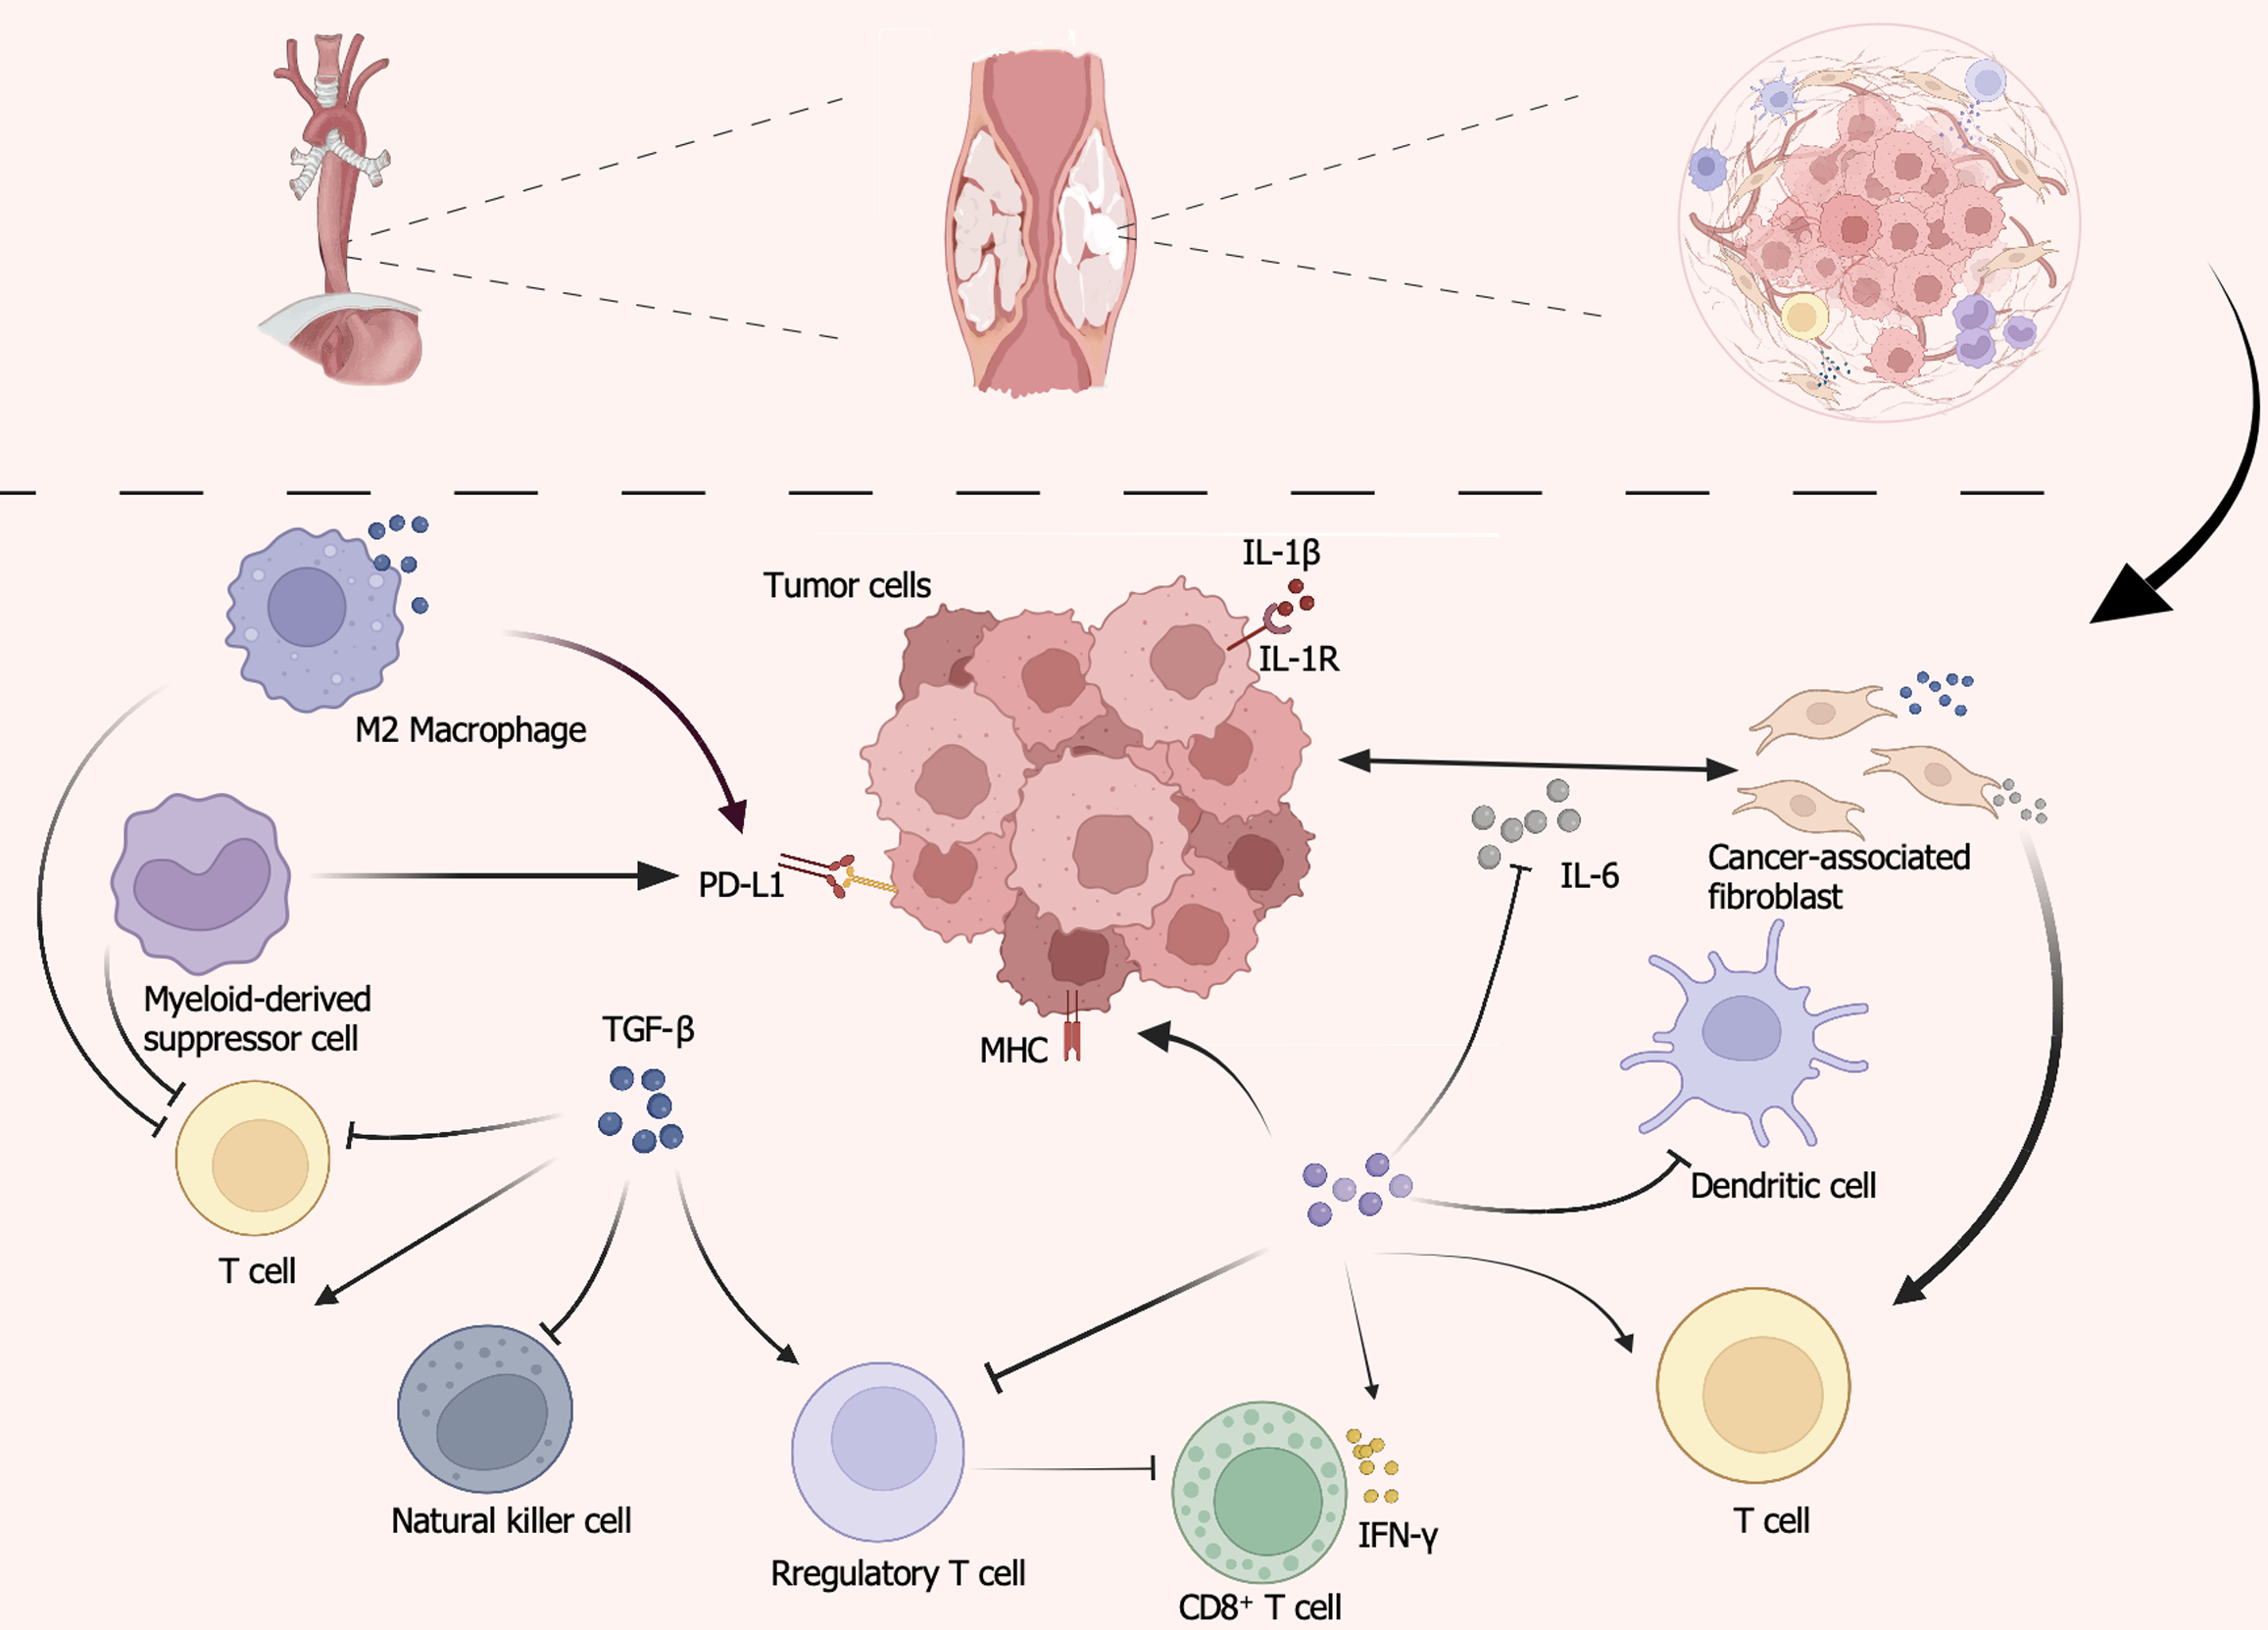
Figure 1 Immunosuppressive micro-environment in esophageal squamous cell carcinoma.
The diagram highlights the dominant suppressor populations and cytokines that shape the esophageal squamous cell carcinoma tumor micro-environment. Treg, myeloid-derived suppressor cell, tumor-associated macrophage, dendritic cell and cancer-associated fibroblast are shown interacting with effector T cells and natural killer cells. Colored dots denote key soluble mediators [blue = transforming-growth-factor-beta, purple = interleukin (IL)-10, orange = interferon-gamma, grey = IL-6]. Solid and dashed arrows indicate predominant inhibitory or stimulatory signals affecting cytotoxicity and antigen presentation. The schematic inset at the top illustrates how dense stroma and aberrant vasculature further impede immune-cell trafficking. IL: Interleukin; MHC: Major histocompatibility complex; PD-L1: Programmed death-ligand 1; TGF-β: Transforming-growth-factor-beta; IFN-γ: Interferon-gamma.
- Citation: Wang Z, Zhang RY, Xu YF, Yue BT, Zhang JY, Wang F. Unmasking immune checkpoint resistance in esophageal squamous cell carcinoma: Insights into the tumor microenvironment and biomarker landscape. World J Gastrointest Oncol 2025; 17(8): 109489
- URL: https://www.wjgnet.com/1948-5204/full/v17/i8/109489.htm
- DOI: https://dx.doi.org/10.4251/wjgo.v17.i8.109489


