Copyright
©The Author(s) 2025.
World J Gastrointest Oncol. Jul 15, 2025; 17(7): 104860
Published online Jul 15, 2025. doi: 10.4251/wjgo.v17.i7.104860
Published online Jul 15, 2025. doi: 10.4251/wjgo.v17.i7.104860
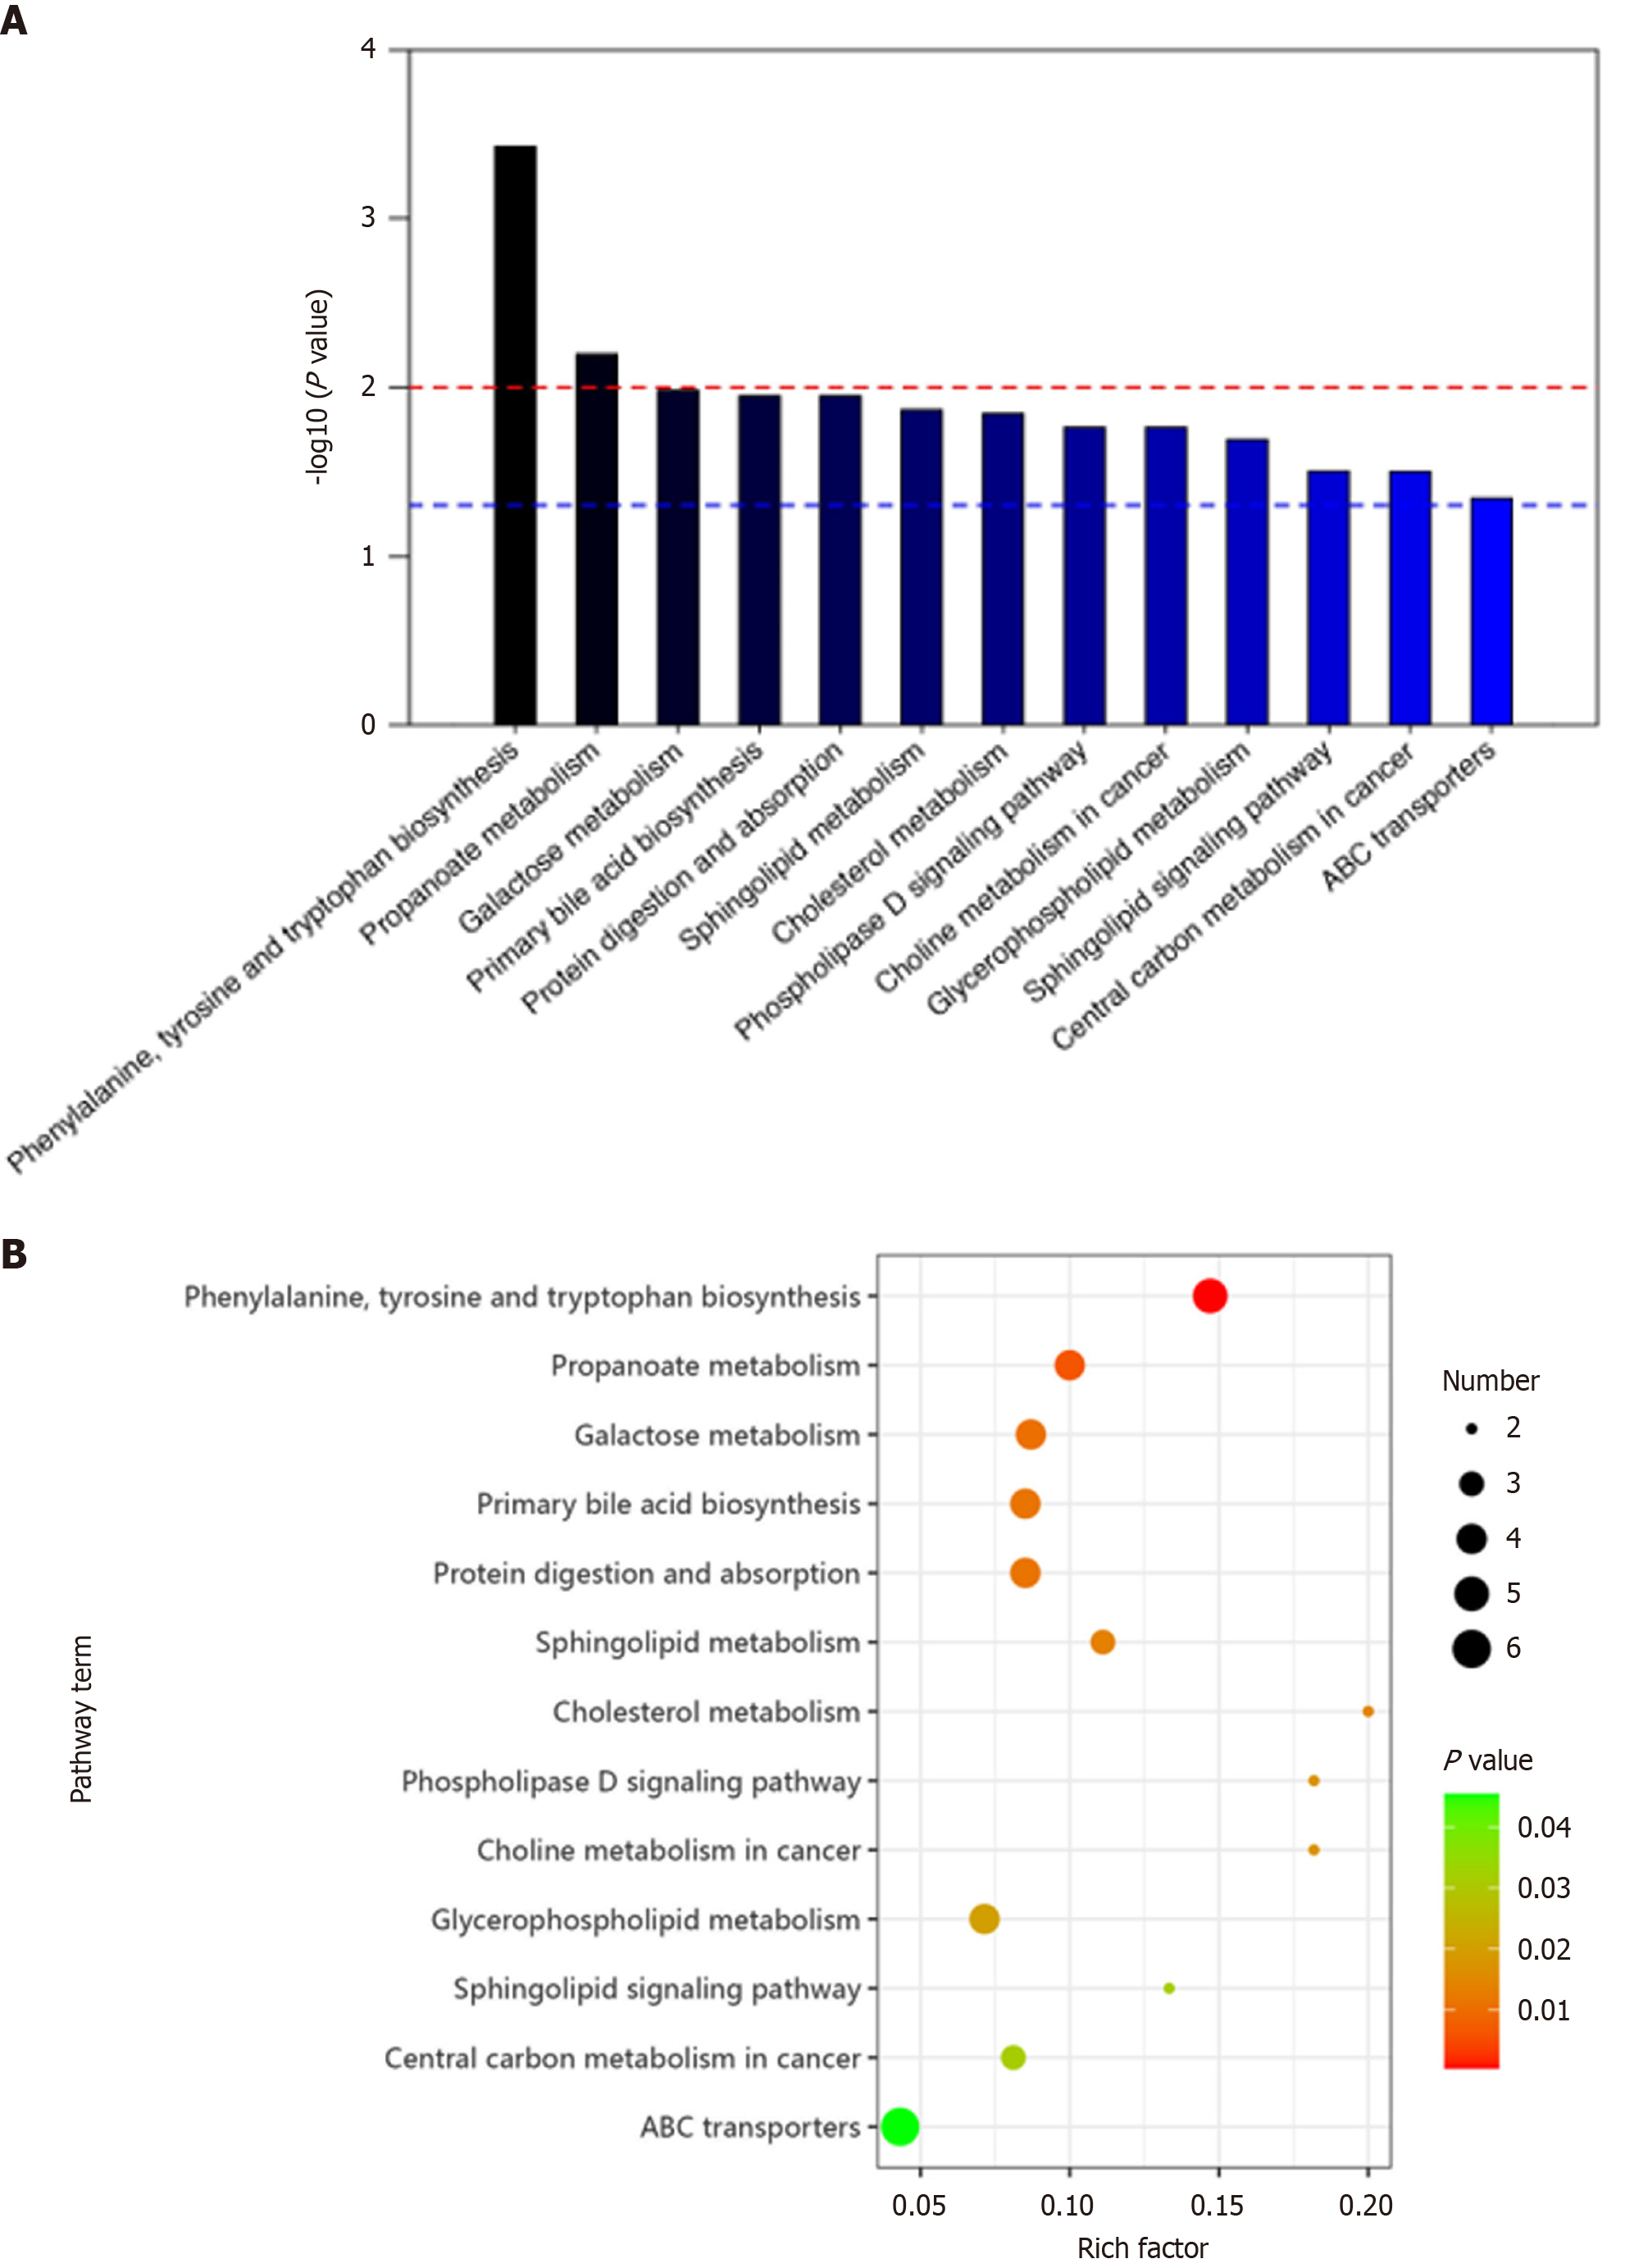
Figure 7 Metabolic pathway enrichment analysis in gastric cancer vs normal controls based on gas chromatography-mass spectrometry and liquid chromatography-mass spectrometry.
A: Pathway enrichment map highlighting key metabolic pathways; B: Bubble plot.
- Citation: Guo TH, Zhu WJ, Hui YF, Zhao SQ, Zhou TT, Wang XM, Zhang QC, Wang W, Li L, Shen WX, Wu XY, Cheng HB. Associations between blood metabolite levels and gastrointestinal cancer risk: A preliminary untargeted metabolomics study. World J Gastrointest Oncol 2025; 17(7): 104860
- URL: https://www.wjgnet.com/1948-5204/full/v17/i7/104860.htm
- DOI: https://dx.doi.org/10.4251/wjgo.v17.i7.104860


