Copyright
©The Author(s) 2025.
World J Gastrointest Oncol. Jun 15, 2025; 17(6): 105570
Published online Jun 15, 2025. doi: 10.4251/wjgo.v17.i6.105570
Published online Jun 15, 2025. doi: 10.4251/wjgo.v17.i6.105570
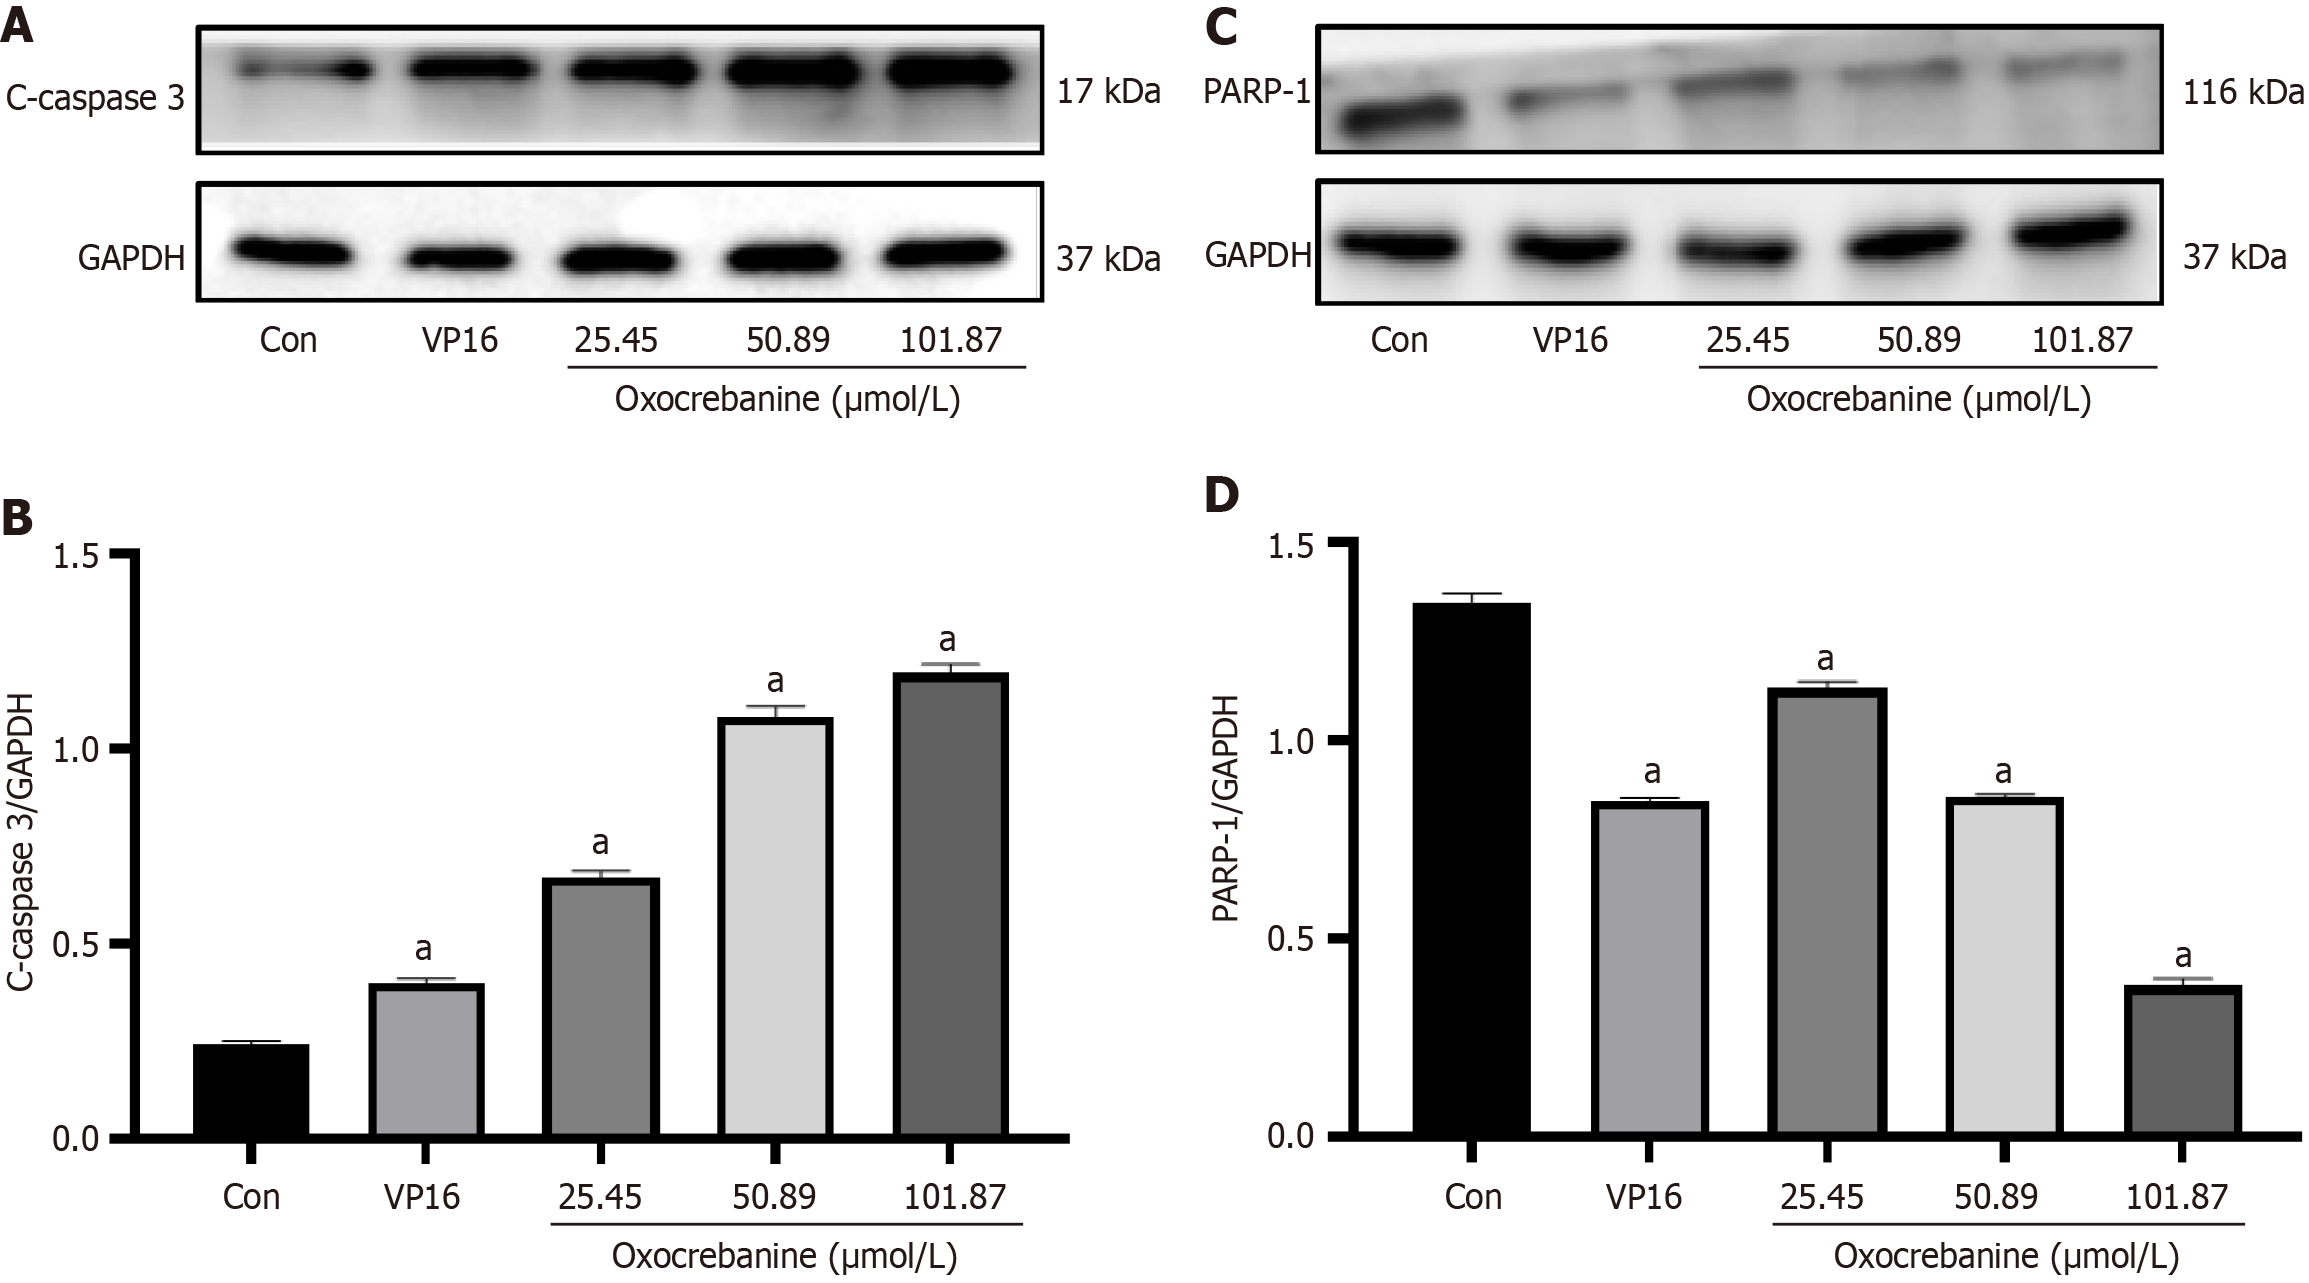
Figure 3 Protein expression levels of cleaved caspase3 and PARP in Hep3B2.
1-7 cells. A: Western blot analysis of cleaved caspase3 (c-caspase3) protein level in Hep3B2.1-7 cells after treatment with oxocrebanine. VP16 (32.54 μmol/L) was used as a control; B: Western blot analysis data indicated that the expression of c-caspase3 was upregulated with oxocrebanine treatments; C: Level of PARP1 in Hep3B2.1-7 cells after treatment with oxocrebanine. VP16 (32.54 μmol/L) was used as a control; D: Western blot analysis data showed that the expression of PARP1 was downregulated by oxocrebanine treatments. Data are shown as the mean ± SD. aP < 0.01 vs control (n = 3).
- Citation: Wang ZW, Pan CY, Wei CL, Liao H, Zhang XP, Zhang CY, Yu L. Oxocrebanine inhibits the proliferation of hepatocellular carcinoma cells by promoting apoptosis and autophagy. World J Gastrointest Oncol 2025; 17(6): 105570
- URL: https://www.wjgnet.com/1948-5204/full/v17/i6/105570.htm
- DOI: https://dx.doi.org/10.4251/wjgo.v17.i6.105570


