Copyright
©The Author(s) 2025.
World J Gastrointest Oncol. May 15, 2025; 17(5): 103809
Published online May 15, 2025. doi: 10.4251/wjgo.v17.i5.103809
Published online May 15, 2025. doi: 10.4251/wjgo.v17.i5.103809
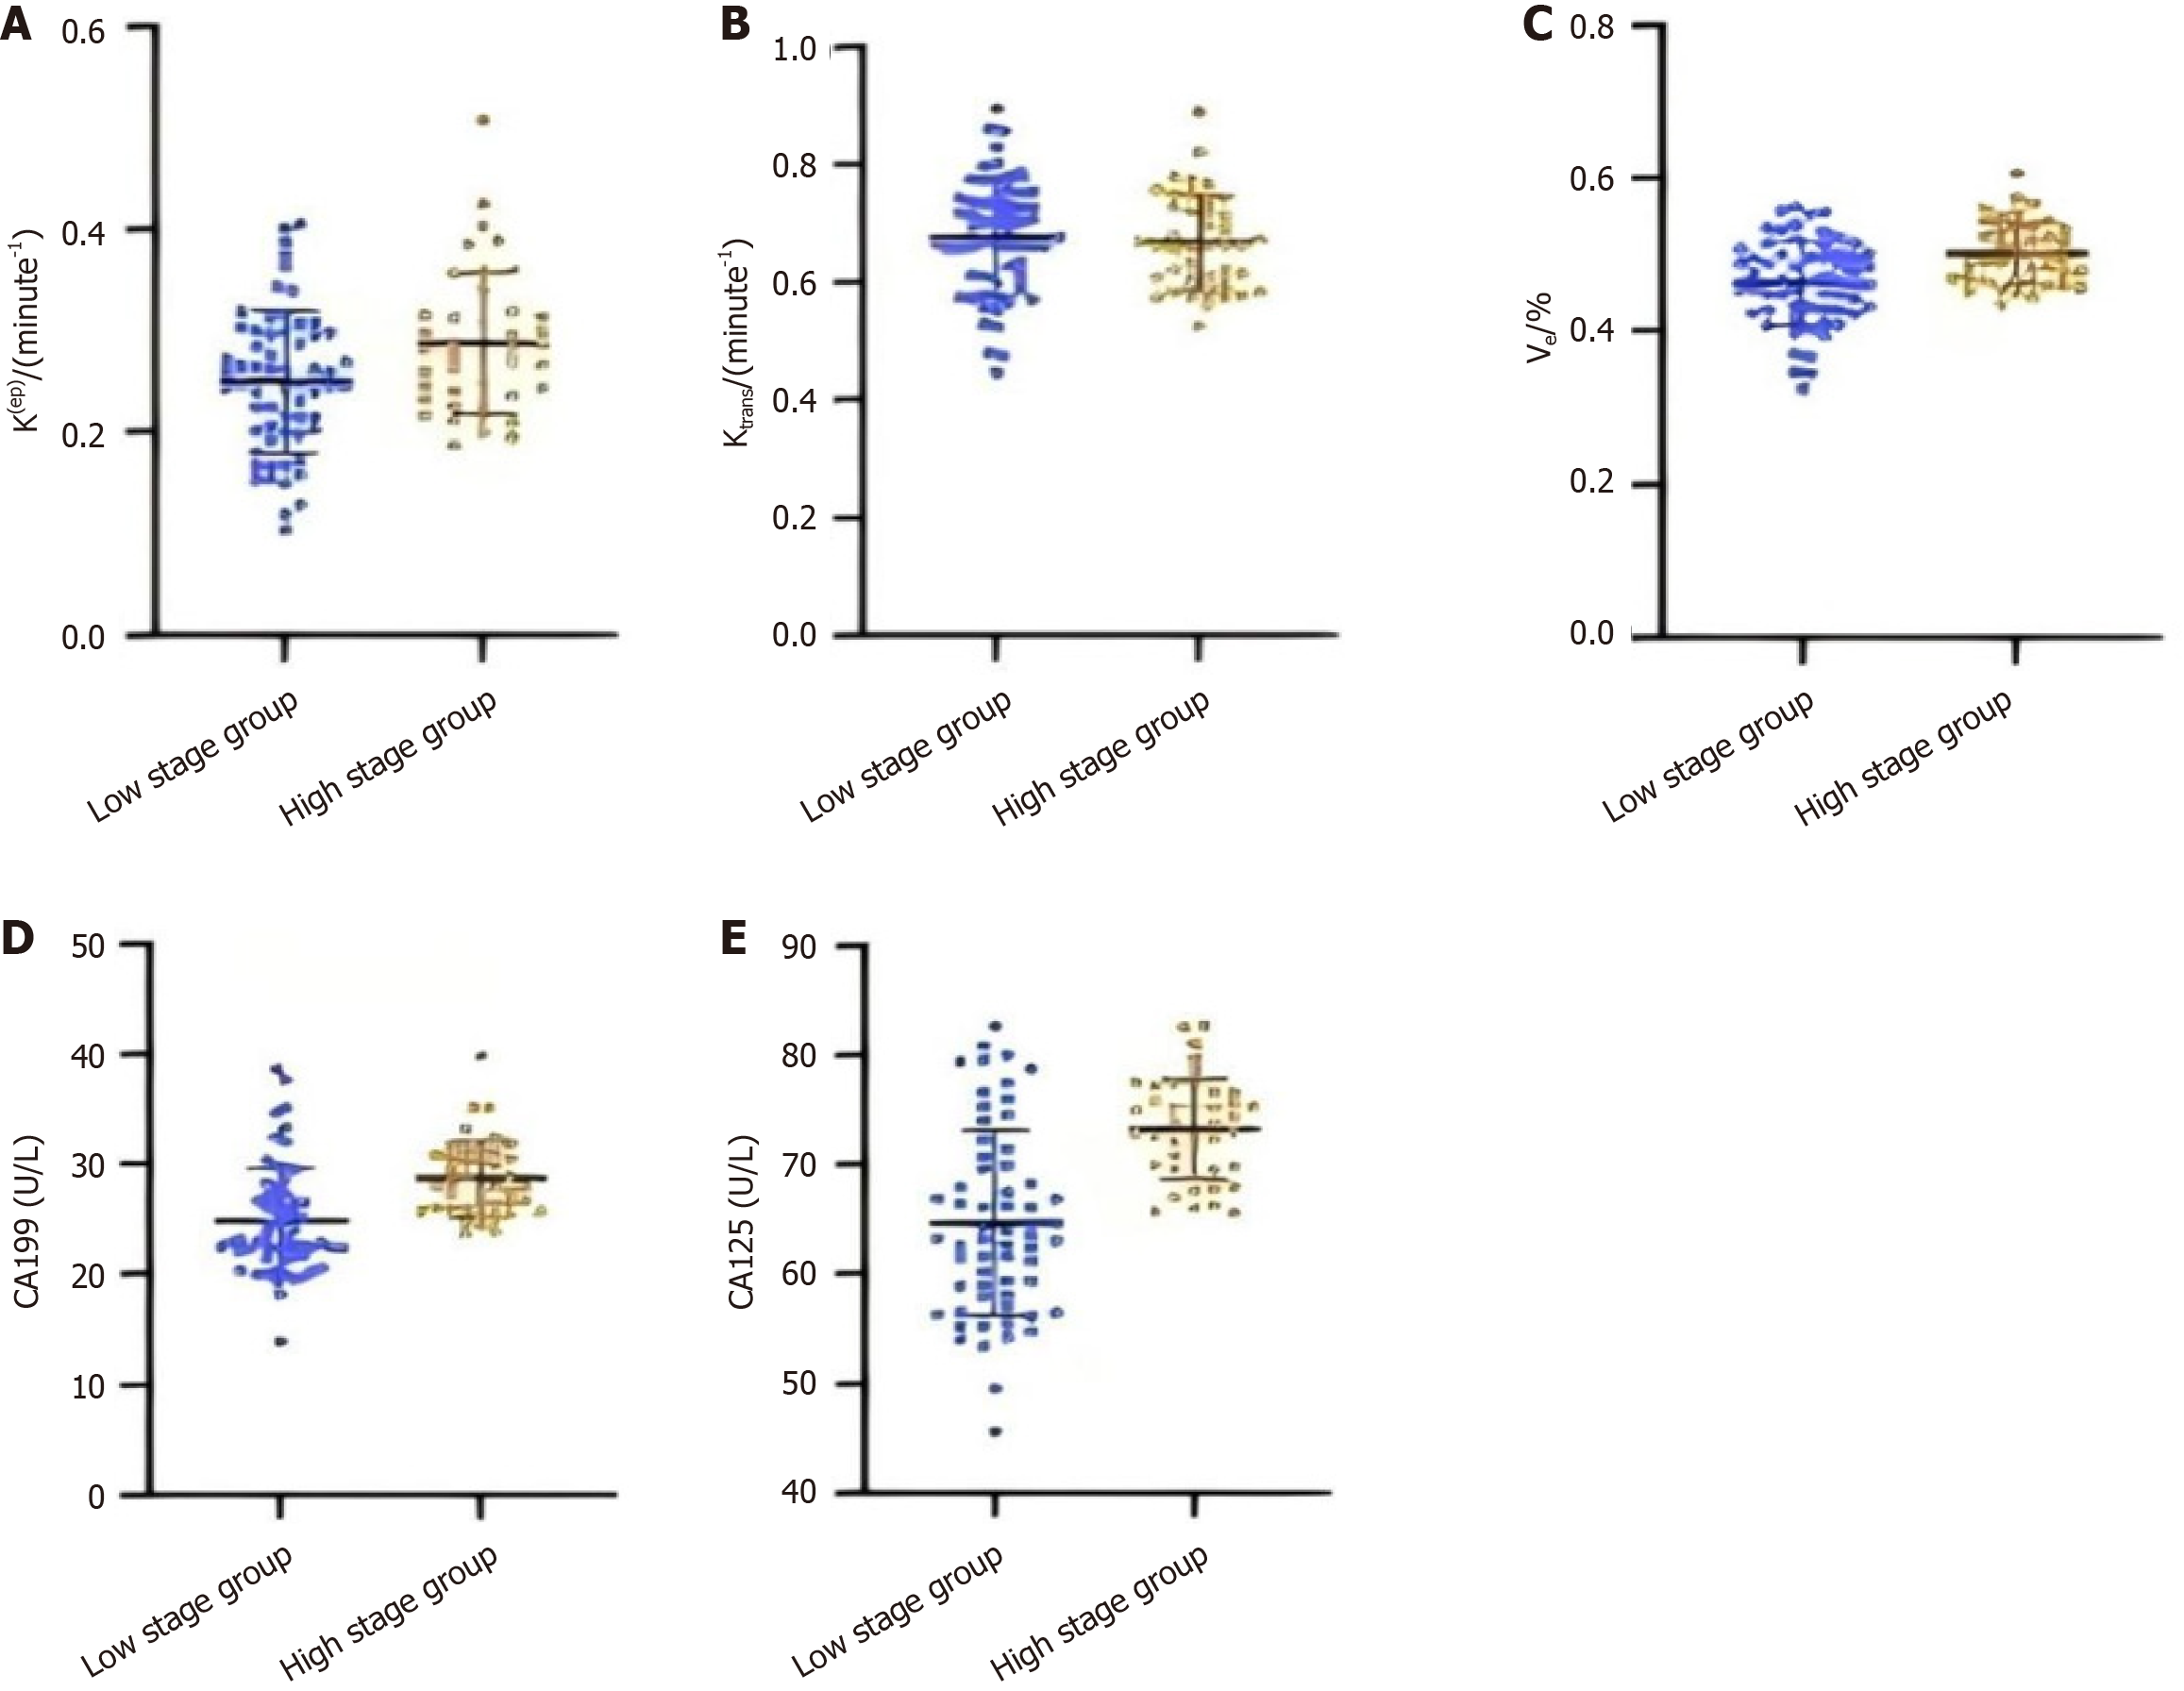
Figure 3 Comparison of dynamic contrast-enhanced-magnetic resonance imaging parameters and serum tumor markers in rectal cancer patients among different T stages.
A: Rate constant values of low and high T-stage groups; B: Volume transfer constant values of low and high T-stage groups; C: Volume fraction of extravascular extracellular space values of low and high T-stage groups; D: Serum carbohydrate antigen 19-9 levels of low and high T-stage groups; E: Serum carbohydrate antigen 125 levels of low and high T-stage groups in this study. Ktrans: Volume transfer constant; Kep: Rate constant; Ve: Volume fraction of extravascular extracellular space; CA: Carbohydrate antigen.
- Citation: Wang Q, Zhang XY, Yang JF, Tao YL. Comparison of dynamic contrast-enhanced-magnetic resonance imaging parameters and serum markers in preoperative rectal cancer evaluation: Combined diagnostic value. World J Gastrointest Oncol 2025; 17(5): 103809
- URL: https://www.wjgnet.com/1948-5204/full/v17/i5/103809.htm
- DOI: https://dx.doi.org/10.4251/wjgo.v17.i5.103809


