
















©The Author(s) 2025.
World J Gastrointest Oncol. Nov 15, 2025; 17(11): 111670
Published online Nov 15, 2025. doi: 10.4251/wjgo.v17.i11.111670
Published online Nov 15, 2025. doi: 10.4251/wjgo.v17.i11.111670
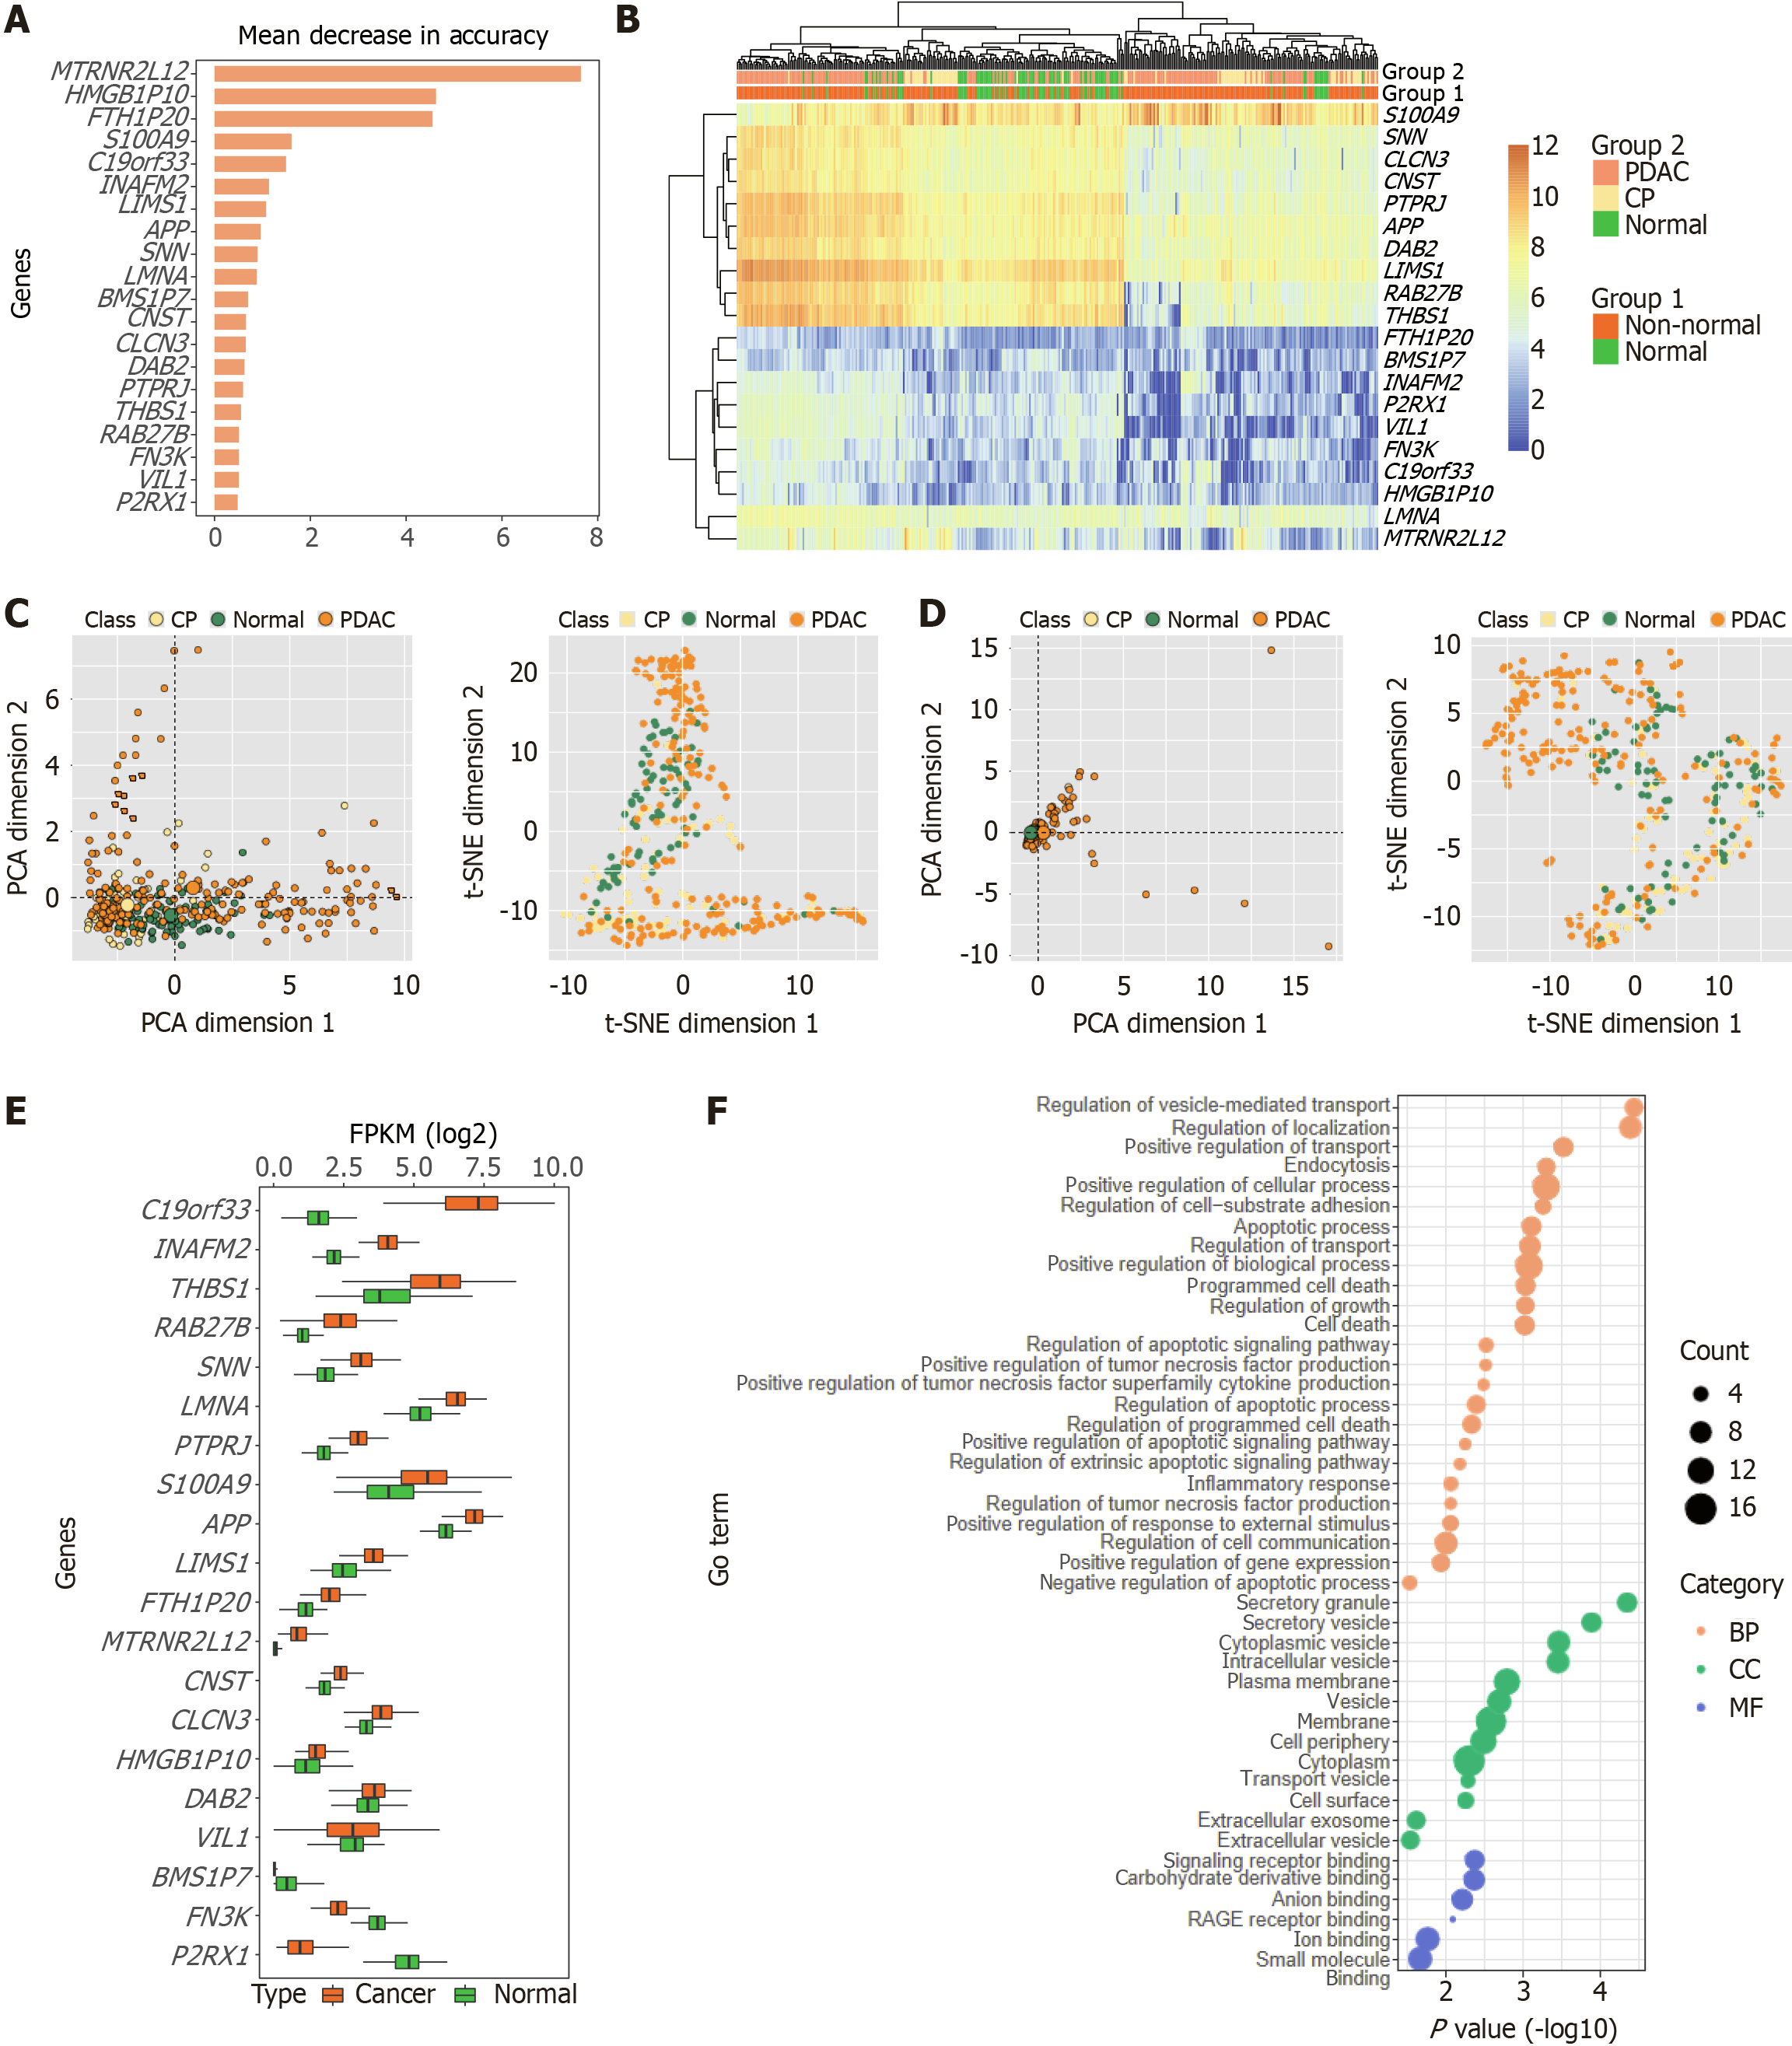
Figure 4 Analysis of potential biomarkers and visualization.
A: Feature (gene set) selection with mean decrease in accuracy; B: Heatmap analysis of the selected biomarkers (20 genes); C: Principal component analysis and t-distributed stochastic neighbor embedding analysis based on the extracellular vesicle long RNA expression of the selected biomarkers (20 genes); D: Principal component analysis and t-distributed stochastic neighbor embedding analysis based on the extracellular vesicle long RNA expression of the eight genes screened by Yu et al[25]; E: Gene expression analysis of potential biomarkers was performed using RNA-seq data from the The Cancer Genome Atlas and Genotype-Tissue Expression databases, which included 178 pancreatic ductal adenocarcinoma tissue samples and 171 normal pancreatic tissue samples; F: Gene Ontology analysis of 20 genes (potential biomarkers). PDAC: Pancreatic ductal adenocarcinoma; CP: Chronic pancreatitis; PCA: Principal component analysis; t-SNE: T-distributed stochastic neighbor embedding; FPKM: Fragments per kilobase of exon per million mapped fragments; GO: Gene Ontology; RAGE: Receptor for advanced glycation end products; BP: Biological process; CC: Cellular component; MF: Molecular function.
- Citation: Liu SC, Zhang H. Early cancer diagnosis via interpretable two-layer machine learning of plasma extracellular vesicle long RNA. World J Gastrointest Oncol 2025; 17(11): 111670
- URL: https://www.wjgnet.com/1948-5204/full/v17/i11/111670.htm
- DOI: https://dx.doi.org/10.4251/wjgo.v17.i11.111670