Copyright
©The Author(s) 2023.
World J Gastrointest Oncol. Jun 15, 2023; 15(6): 1019-1035
Published online Jun 15, 2023. doi: 10.4251/wjgo.v15.i6.1019
Published online Jun 15, 2023. doi: 10.4251/wjgo.v15.i6.1019
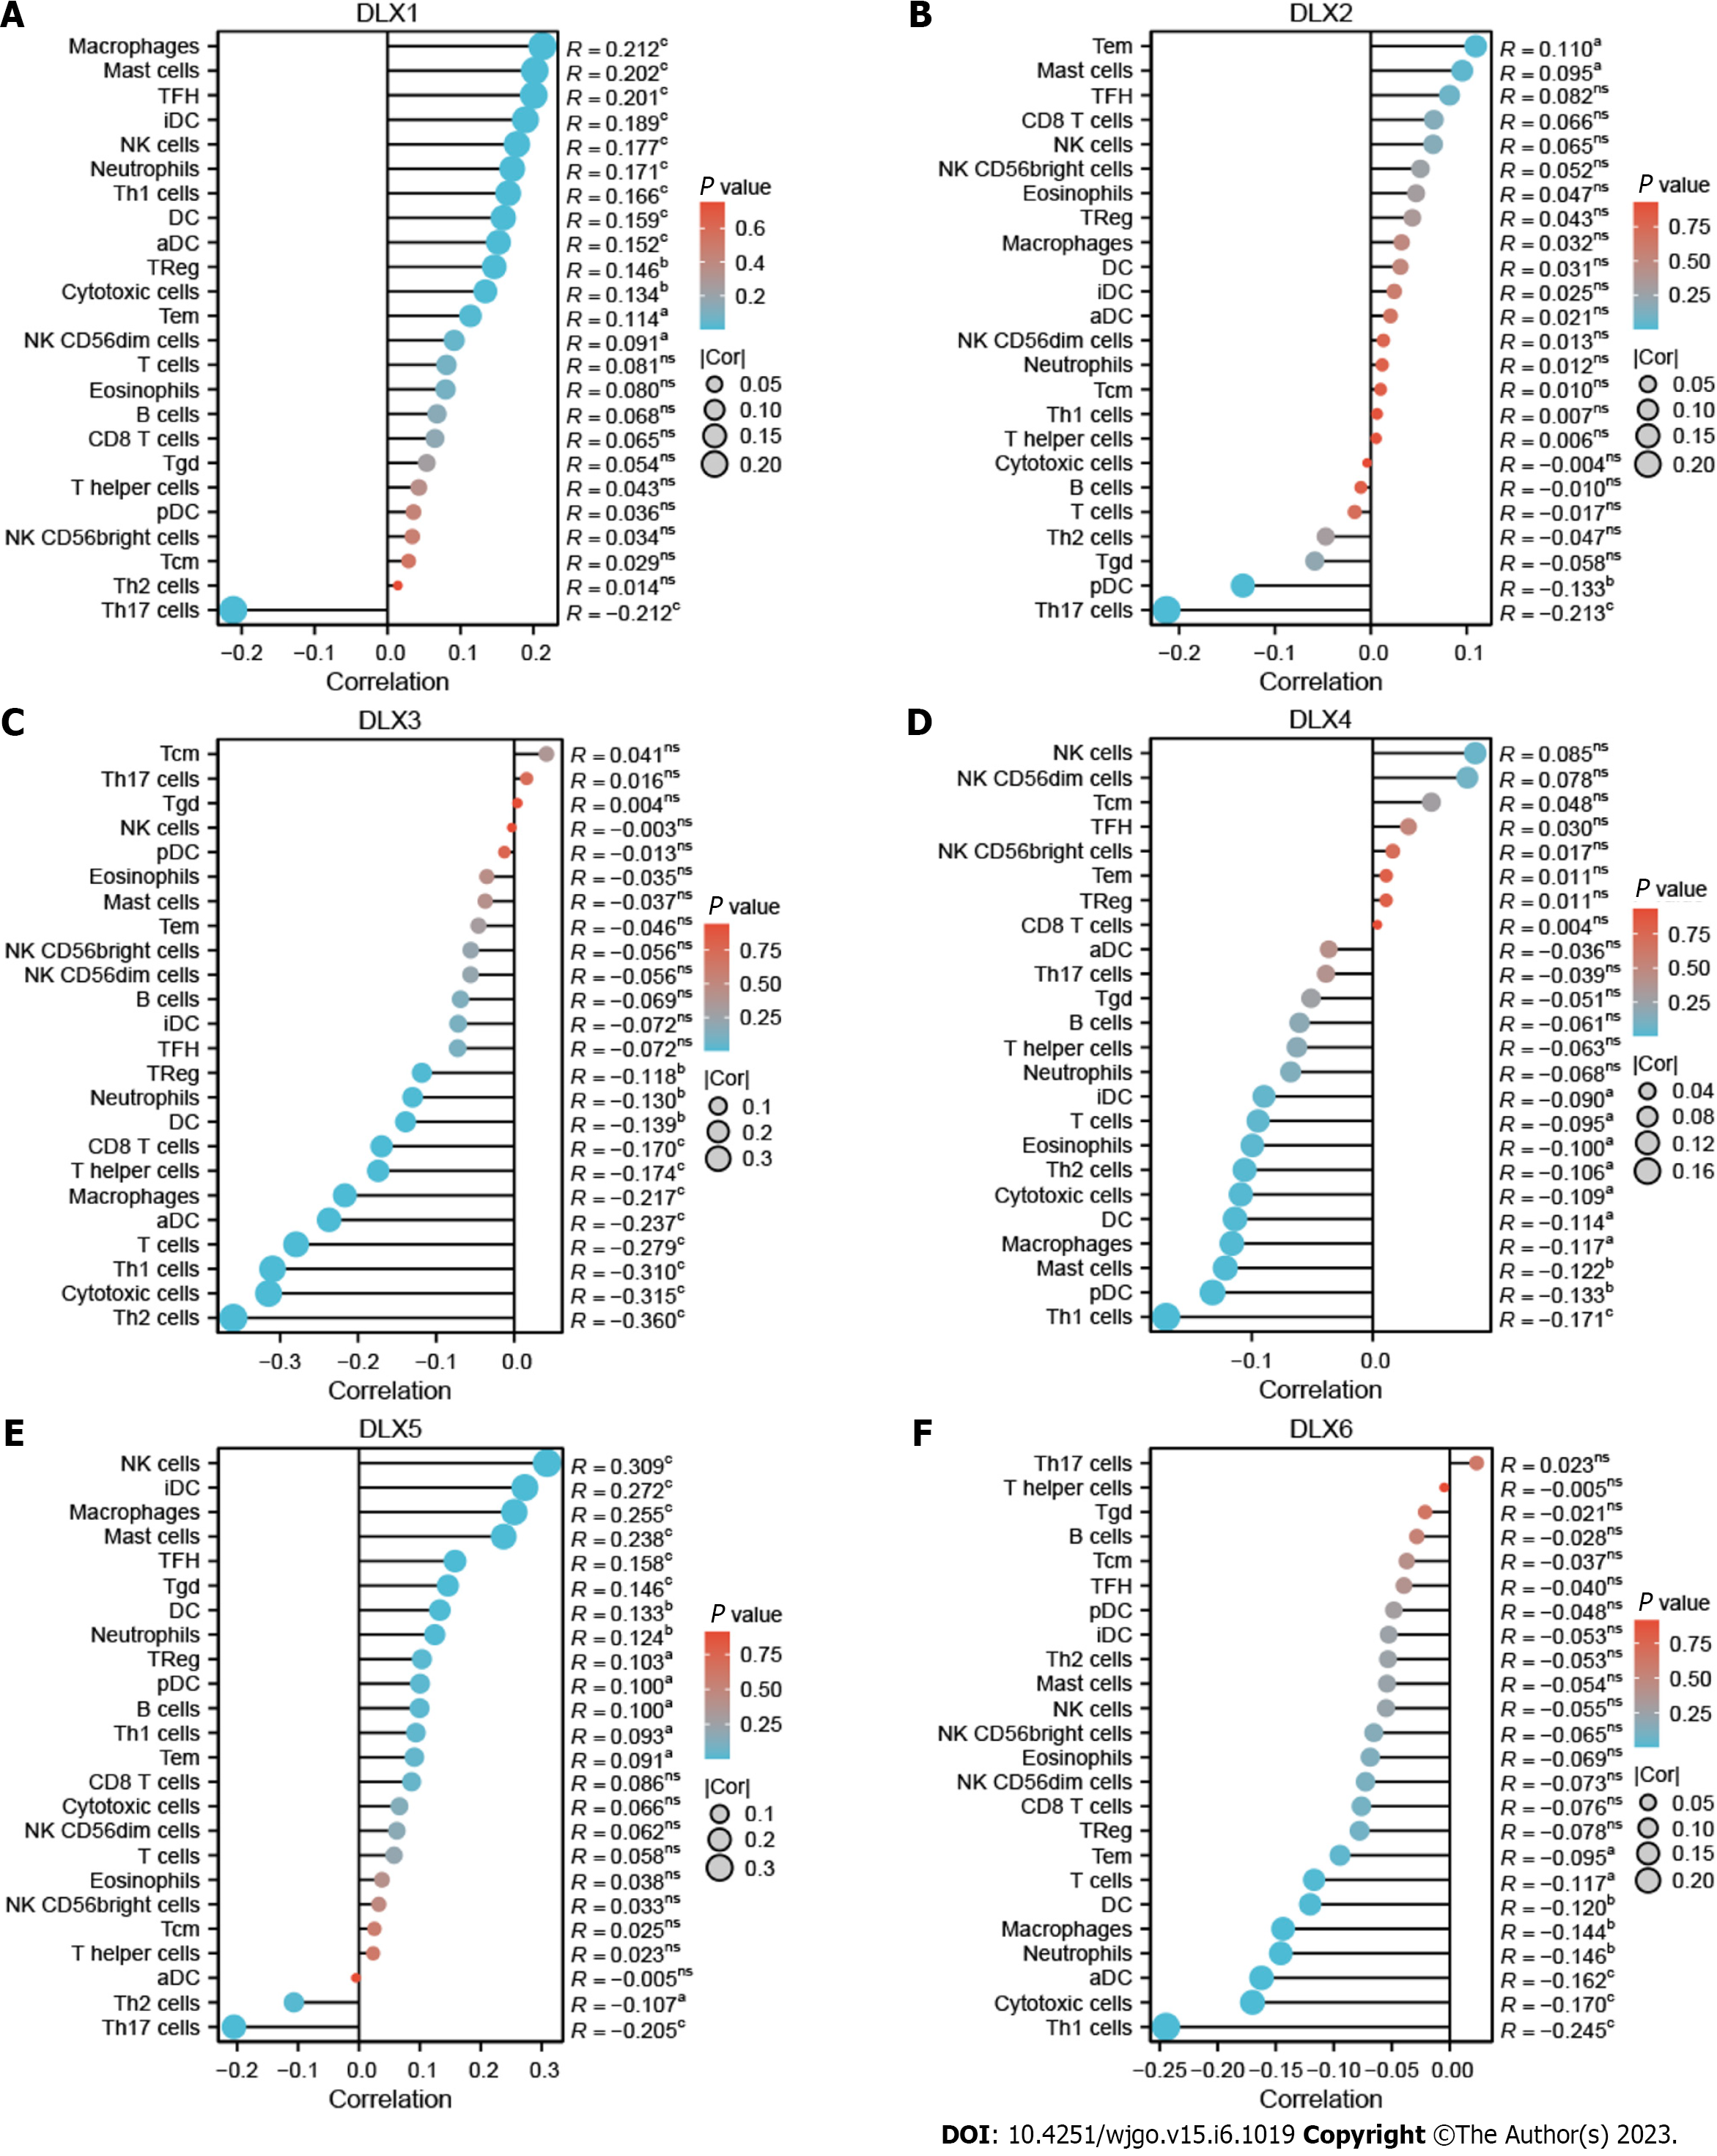
Figure 10 Correlation between the expression of each distal-less homeobox gene and the 24 tumor-infiltrating immune cells of colon adenocarcinoma (lollipop plot).
In the color bar, the darker the color, the smaller the P-value, indicating a higher statistical significance. The bubble size represents the correlation value, the larger the bubble, the larger the correlation value. A: Correlation between distal-less homeobox (DLX1) expression and immune infiltration; B: Correlation between DLX2 expression and immune infiltration; C: Correlation between DLX3 expression and immune infiltration; D: Correlation between DLX4 expression and immune infiltration; E: Correlation between DLX5 expression and immune infiltration; F: Correlation between DLX6 expression and immune infiltration. aP < 0.05; bP < 0.01; cP < 0.001. aDC: Activated dendritic cell; DC: Dendritic cell; DLX: Distal-less homeobox; iDC: Immature dendritic cell; NK: Natural killer; Tcm: T central memory; Tem: T effector memory; TFH: T follicular helper; Tgd: T gamma delta; Th: T helper.
- Citation: Chen YC, Li DB, Wang DL, Peng H. Comprehensive analysis of distal-less homeobox family gene expression in colon cancer. World J Gastrointest Oncol 2023; 15(6): 1019-1035
- URL: https://www.wjgnet.com/1948-5204/full/v15/i6/1019.htm
- DOI: https://dx.doi.org/10.4251/wjgo.v15.i6.1019


