Copyright
©The Author(s) 2023.
World J Gastrointest Oncol. Jan 15, 2023; 15(1): 90-101
Published online Jan 15, 2023. doi: 10.4251/wjgo.v15.i1.90
Published online Jan 15, 2023. doi: 10.4251/wjgo.v15.i1.90
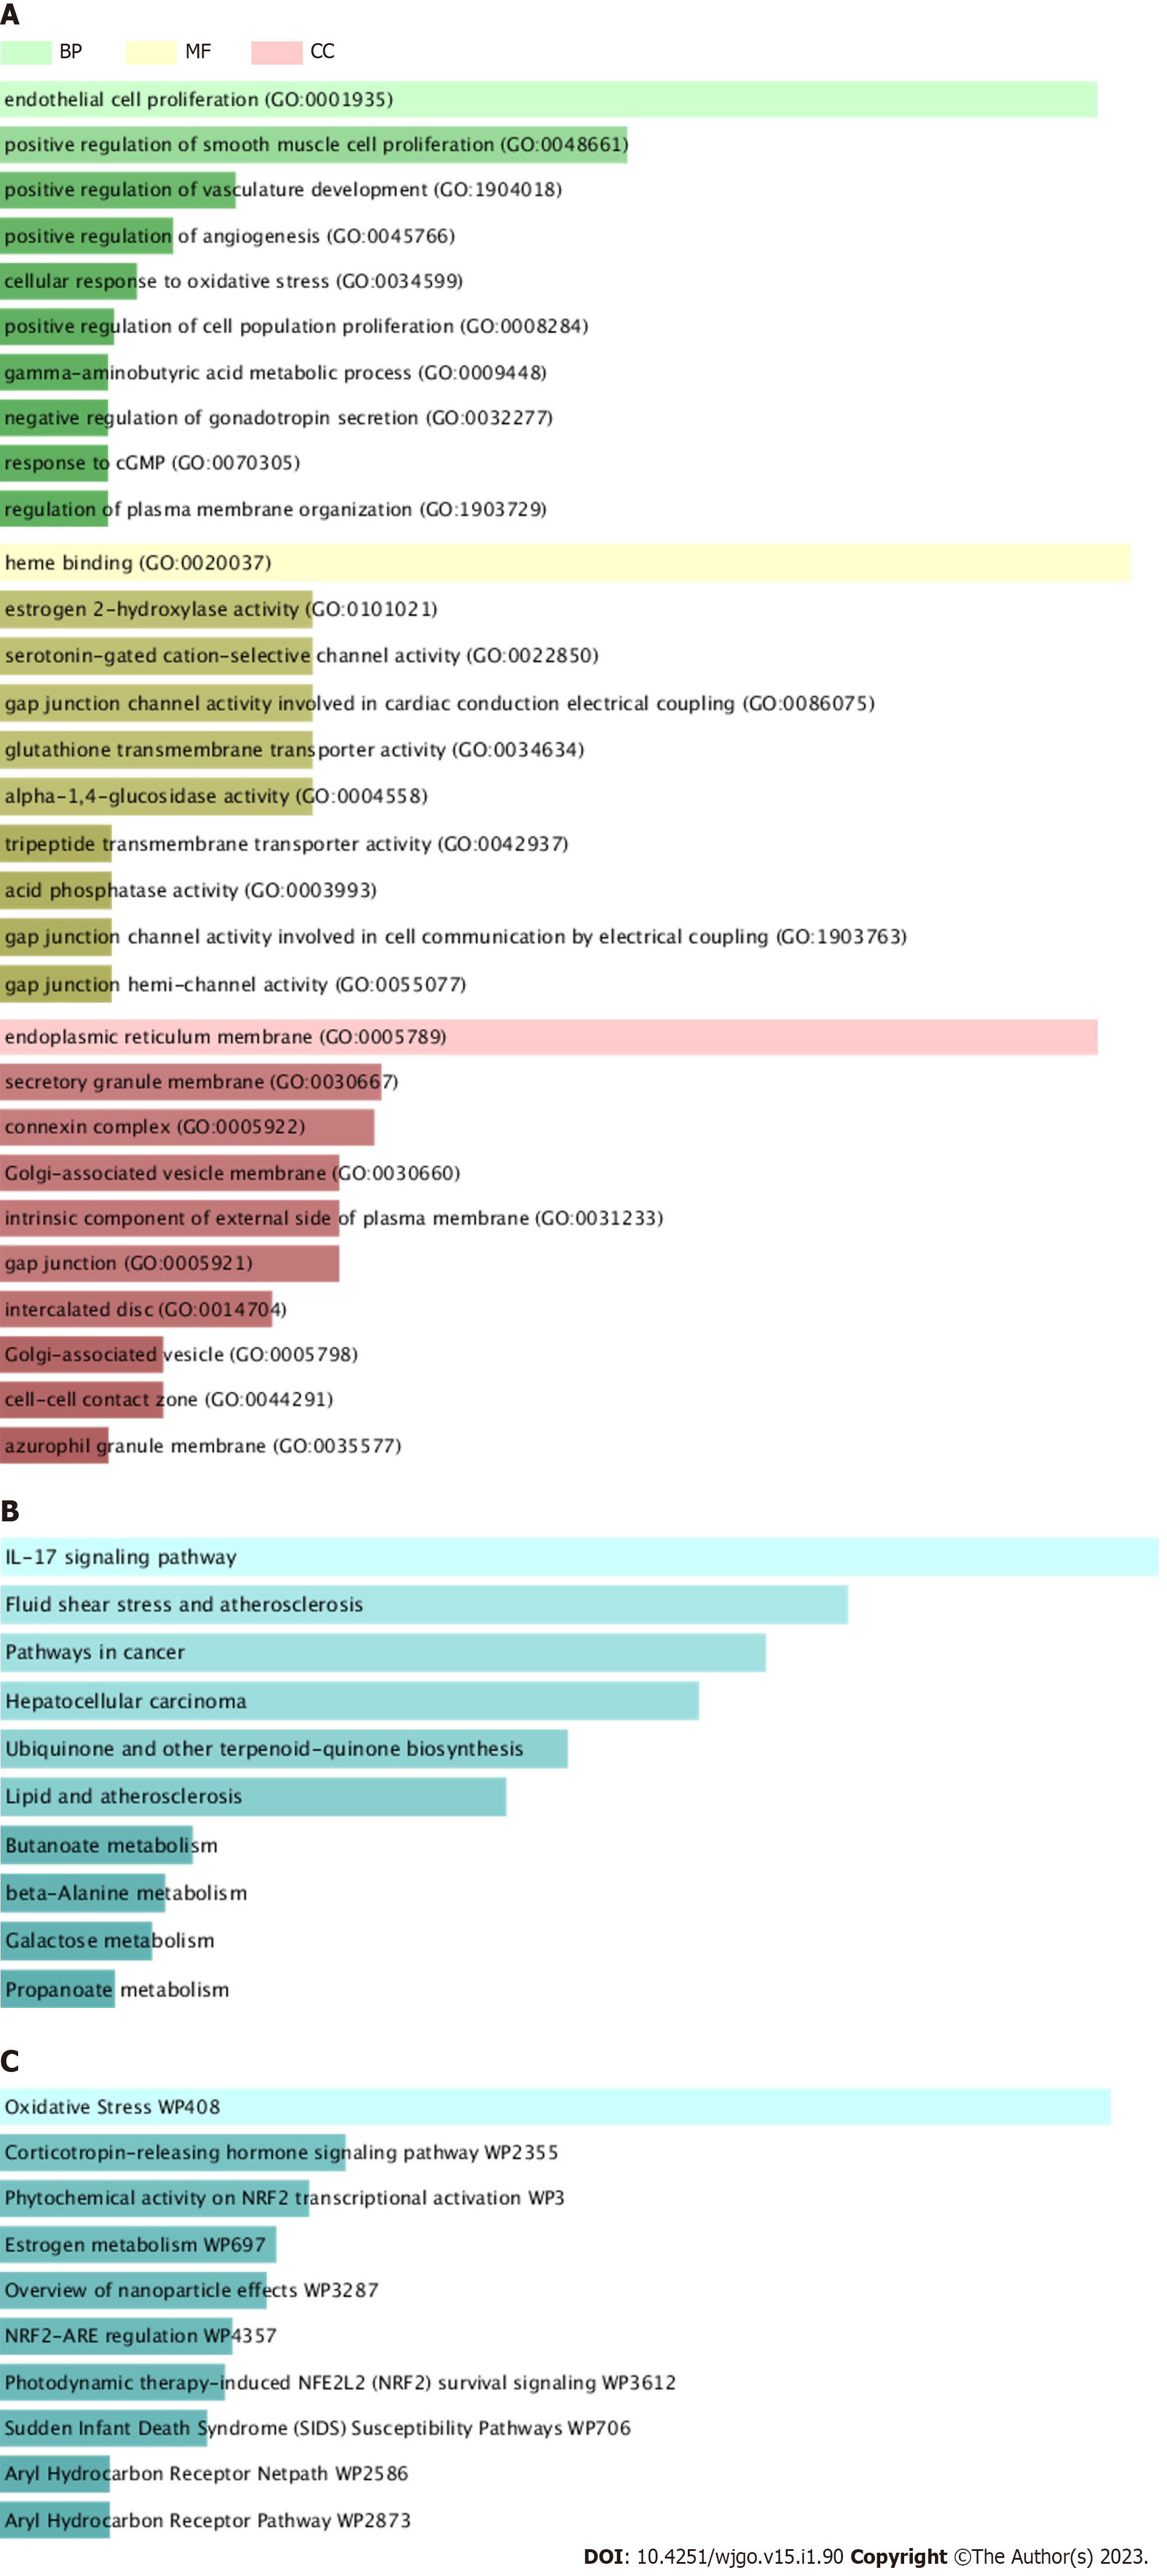
Figure 3 Functional and pathway enrichment analysis of JC724-colorectal cancer targets.
The horizontal axis represents the enrichment scores for each term, while the vertical axis represents the annotations. A: Bar chart of predominant GO terms. Three different colors represent distinct terms of biology process, cellular component, and molecular function; B: Bar chart of KEGG enrichment analysis and essential pathways; C: Bar chart of Wiki pathway analysis. MF: Molecular function; CC: Cellular component; BP: Biological process.
- Citation: Tang HZ, Yang ZP, Lu S, Wang B, Wang YY, Sun XB, Qu JX, Rao BQ. Network pharmacology-based analysis of heat clearing and detoxifying drug JC724 on the treatment of colorectal cancer. World J Gastrointest Oncol 2023; 15(1): 90-101
- URL: https://www.wjgnet.com/1948-5204/full/v15/i1/90.htm
- DOI: https://dx.doi.org/10.4251/wjgo.v15.i1.90


