Copyright
©The Author(s) 2021.
World J Gastrointest Oncol. Oct 15, 2021; 13(10): 1492-1505
Published online Oct 15, 2021. doi: 10.4251/wjgo.v13.i10.1492
Published online Oct 15, 2021. doi: 10.4251/wjgo.v13.i10.1492
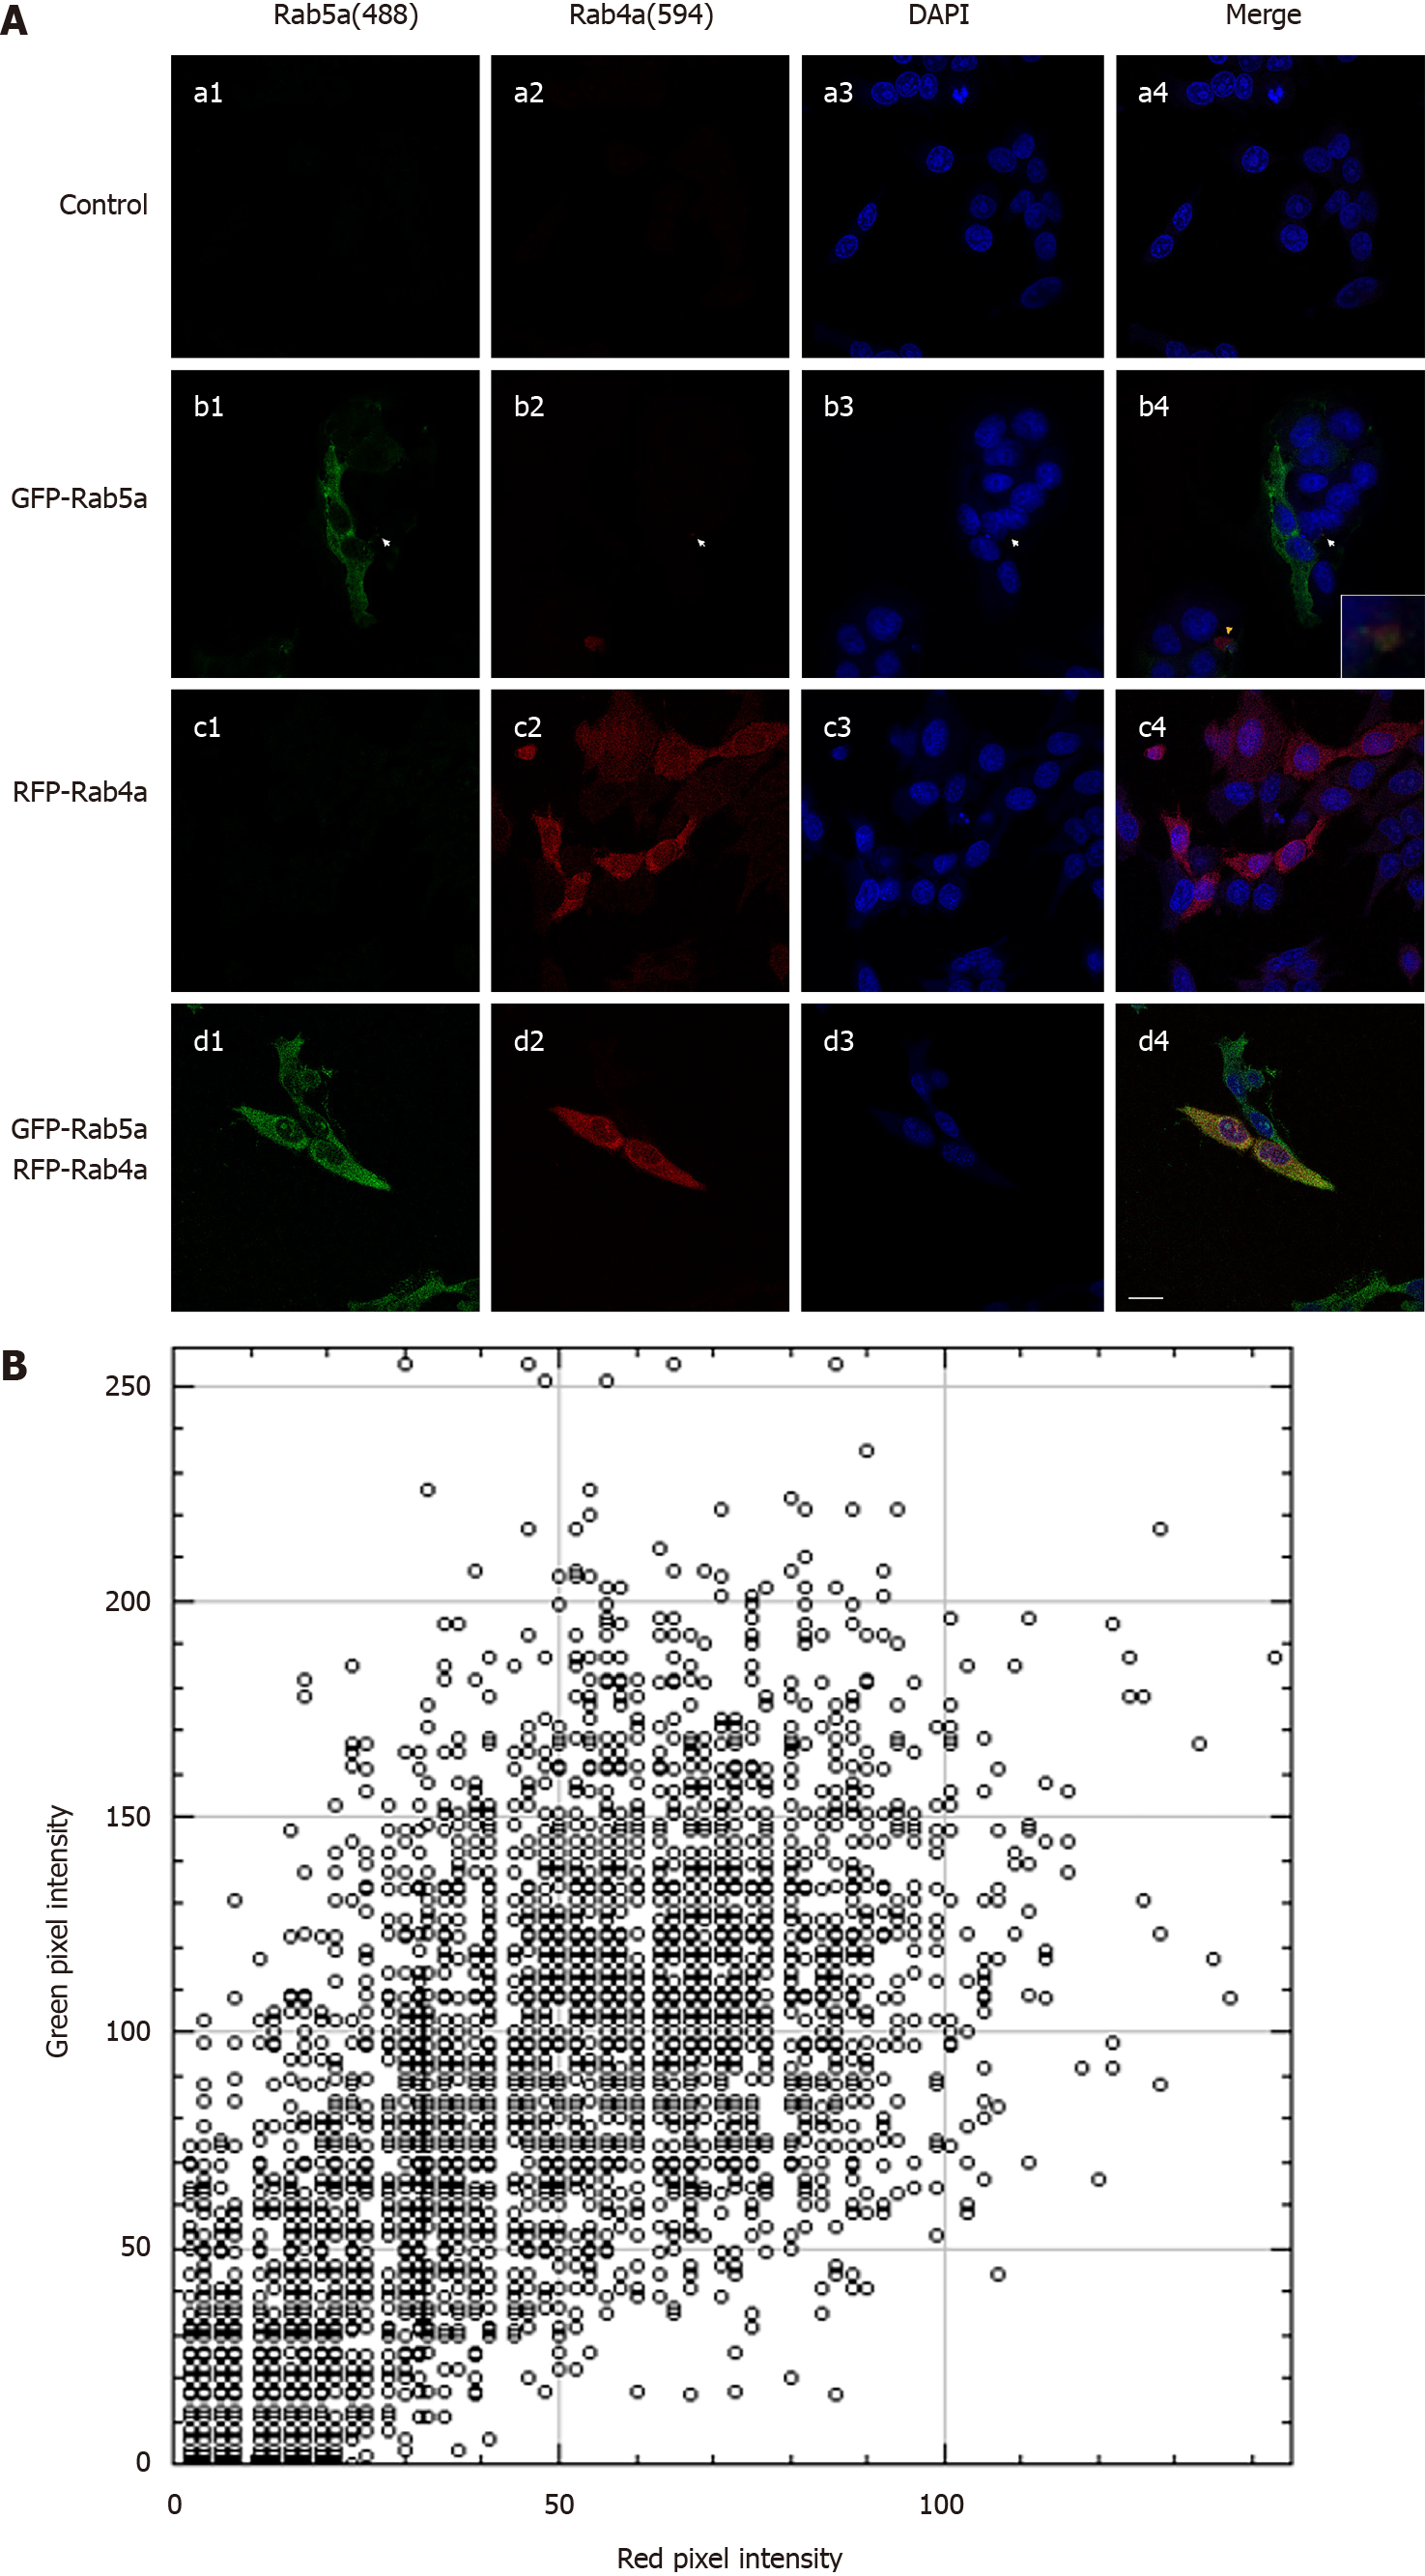
Figure 4 Confocal immunofluorescent analysis of the co-localization between Rab5a and Rab4a in endosomes of HGC-27 cells.
A: Green fluorescent protein (GFP)–Rab5a and red fluorescent protein (RFP)–Rab4a overexpressed in HGC-27 cells were visualized using immunofluorescent confocal microscopy. Four groups of HGC-27 cells are shown, namely the Control group (a1-a4), the Rab5a overexpression group (b1-b4), the Rab4a overexpression group (c1-c4), and the Rab5a + Rab4a overexpression group (d1-d4). Scale bar = 20 μm; B: The colocalization between Rab5a and Rab4a was evaluated by EzColocalization plugin of ImageJ. Scatterplot of GFP–Rab5a and RFP–Rab4a is shown for cells in the Rab5a + Rab4a overexpression group (d4).
- Citation: Cao GJ, Wang D, Zeng ZP, Wang GX, Hu CJ, Xing ZF. Direct interaction between Rab5a and Rab4a enhanced epidermal growth factor-stimulated proliferation of gastric cancer cells. World J Gastrointest Oncol 2021; 13(10): 1492-1505
- URL: https://www.wjgnet.com/1948-5204/full/v13/i10/1492.htm
- DOI: https://dx.doi.org/10.4251/wjgo.v13.i10.1492


