Copyright
©The Author(s) 2020.
World J Gastrointest Oncol. Nov 15, 2020; 12(11): 1255-1271
Published online Nov 15, 2020. doi: 10.4251/wjgo.v12.i11.1255
Published online Nov 15, 2020. doi: 10.4251/wjgo.v12.i11.1255
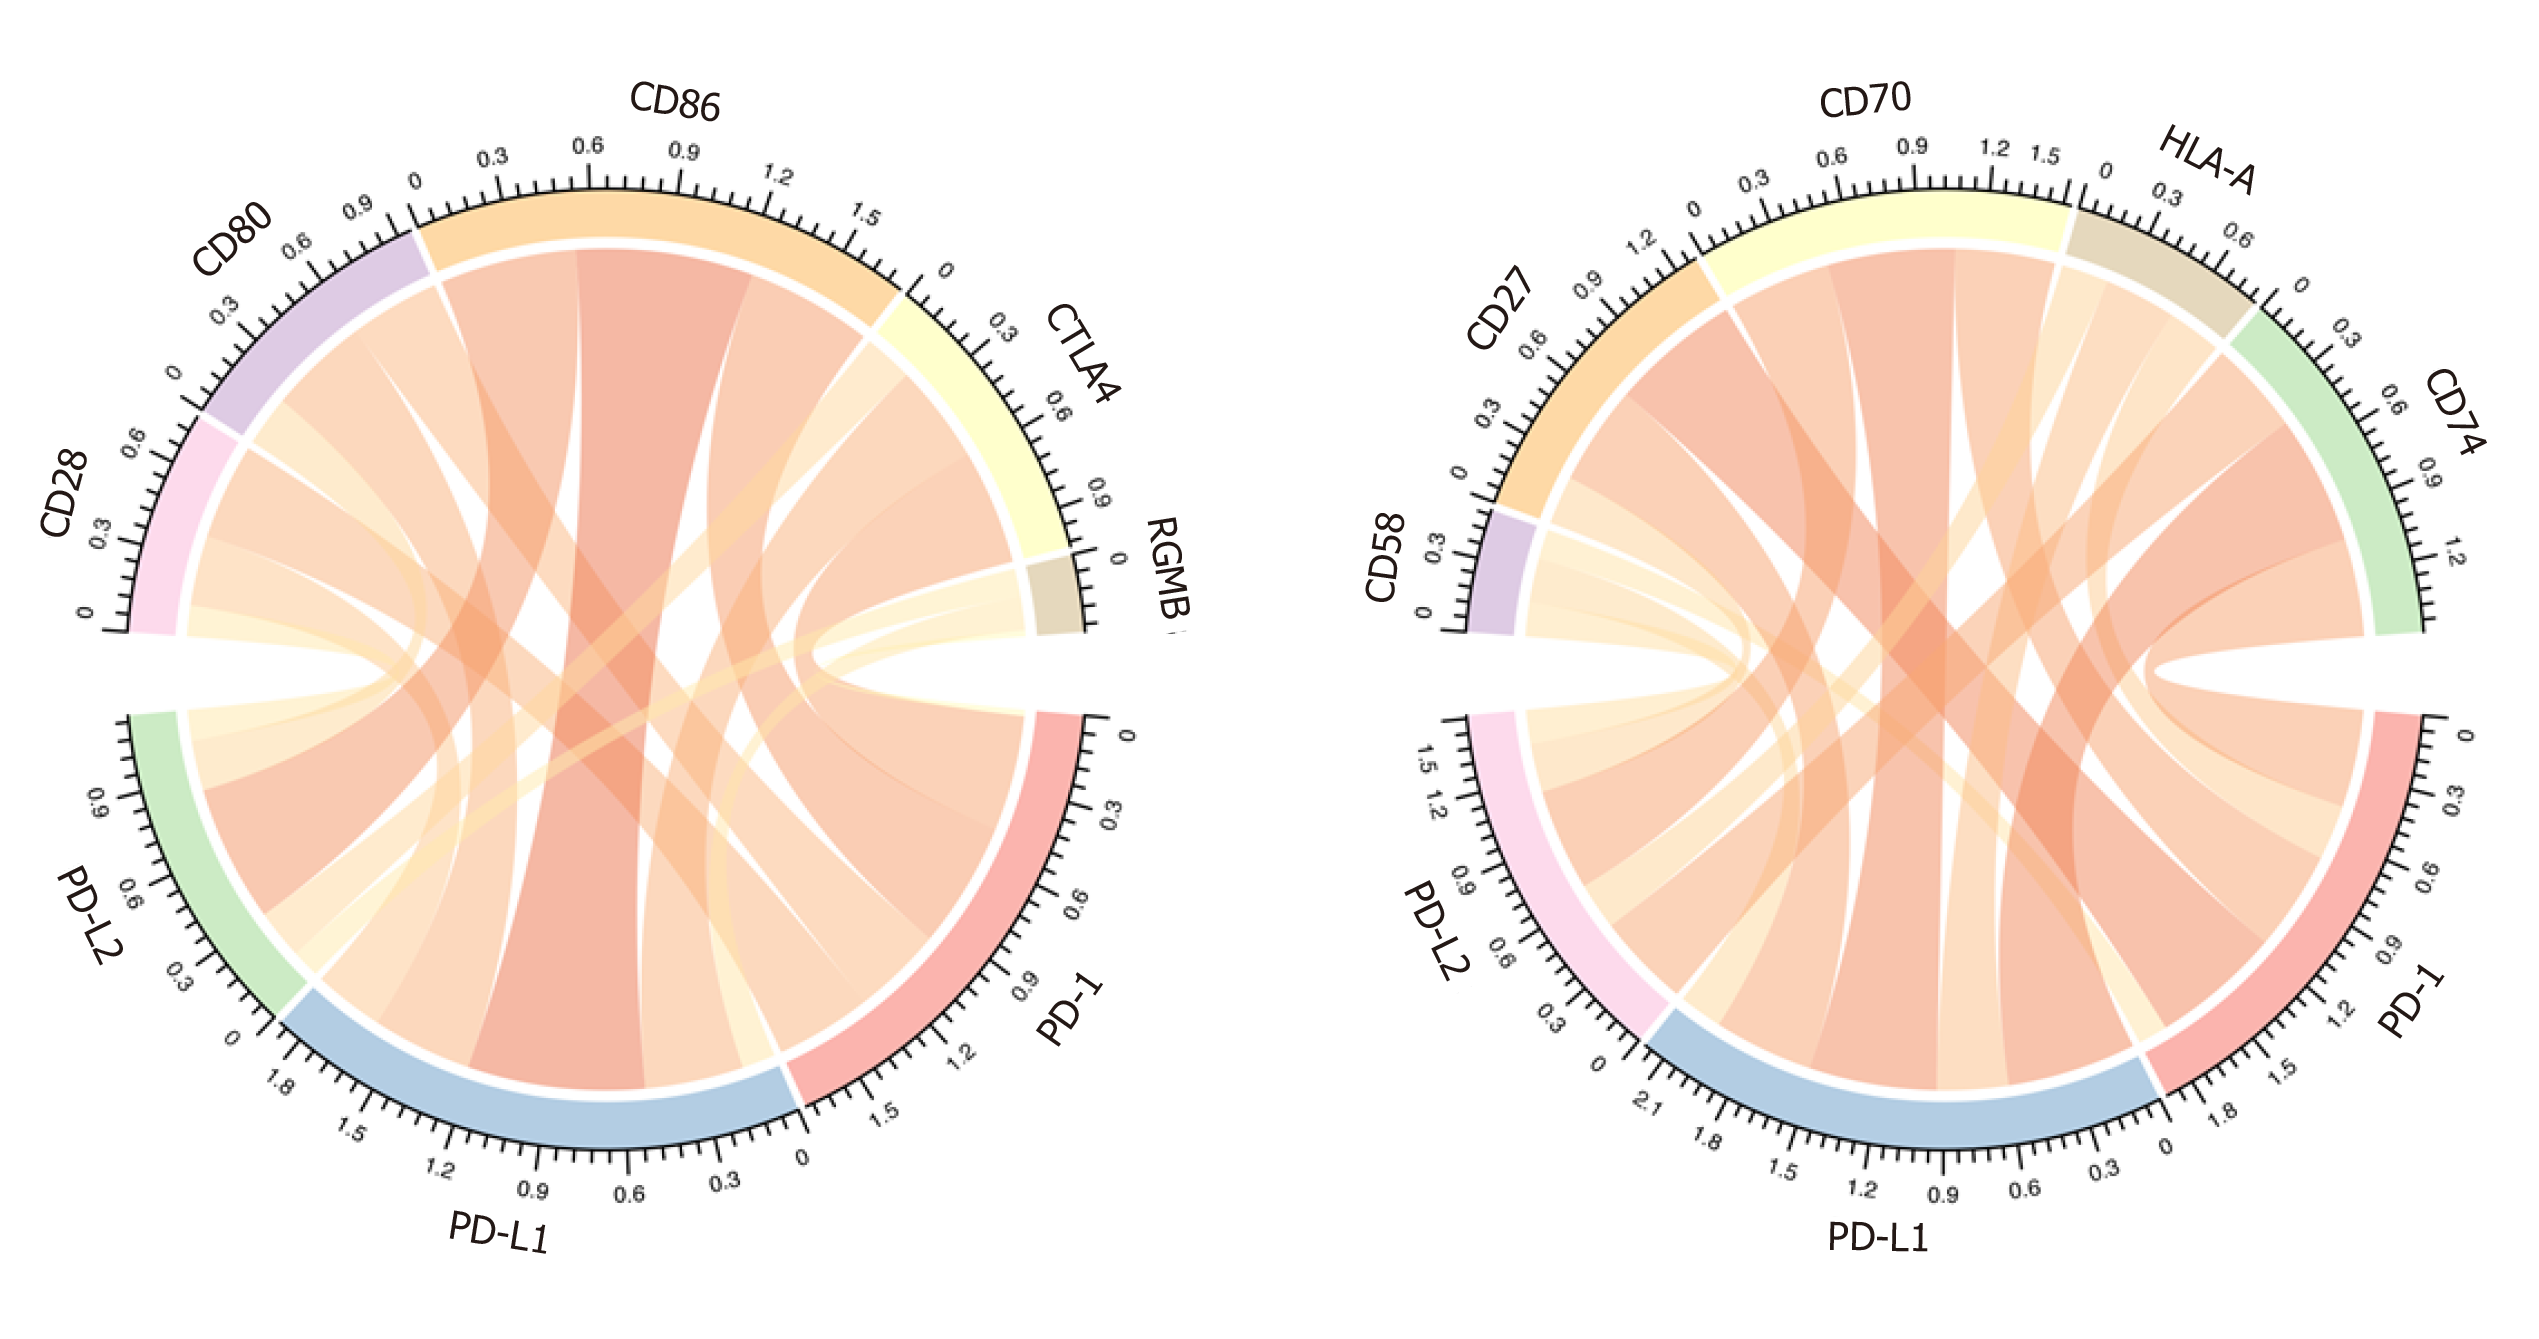
Figure 5 Correlation between programmed death 1/programmed death ligand 1/programmed death ligand 2 expression and immune checkpoint genes.
In the correlation diagram, each bar represents the interaction between two genes. The width of the strip represents the size of the correlation coefficient. PD-1: Programmed death 1; PD-L1: Programmed death ligand 1; PD-L2: Programmed death ligand 2.
- Citation: Sheng QJ, Tian WY, Dou XG, Zhang C, Li YW, Han C, Fan YX, Lai PP, Ding Y. Programmed death 1, ligand 1 and 2 correlated genes and their association with mutation, immune infiltration and clinical outcomes of hepatocellular carcinoma. World J Gastrointest Oncol 2020; 12(11): 1255-1271
- URL: https://www.wjgnet.com/1948-5204/full/v12/i11/1255.htm
- DOI: https://dx.doi.org/10.4251/wjgo.v12.i11.1255


