Copyright
©The Author(s) 2020.
World J Gastrointest Oncol. Nov 15, 2020; 12(11): 1255-1271
Published online Nov 15, 2020. doi: 10.4251/wjgo.v12.i11.1255
Published online Nov 15, 2020. doi: 10.4251/wjgo.v12.i11.1255
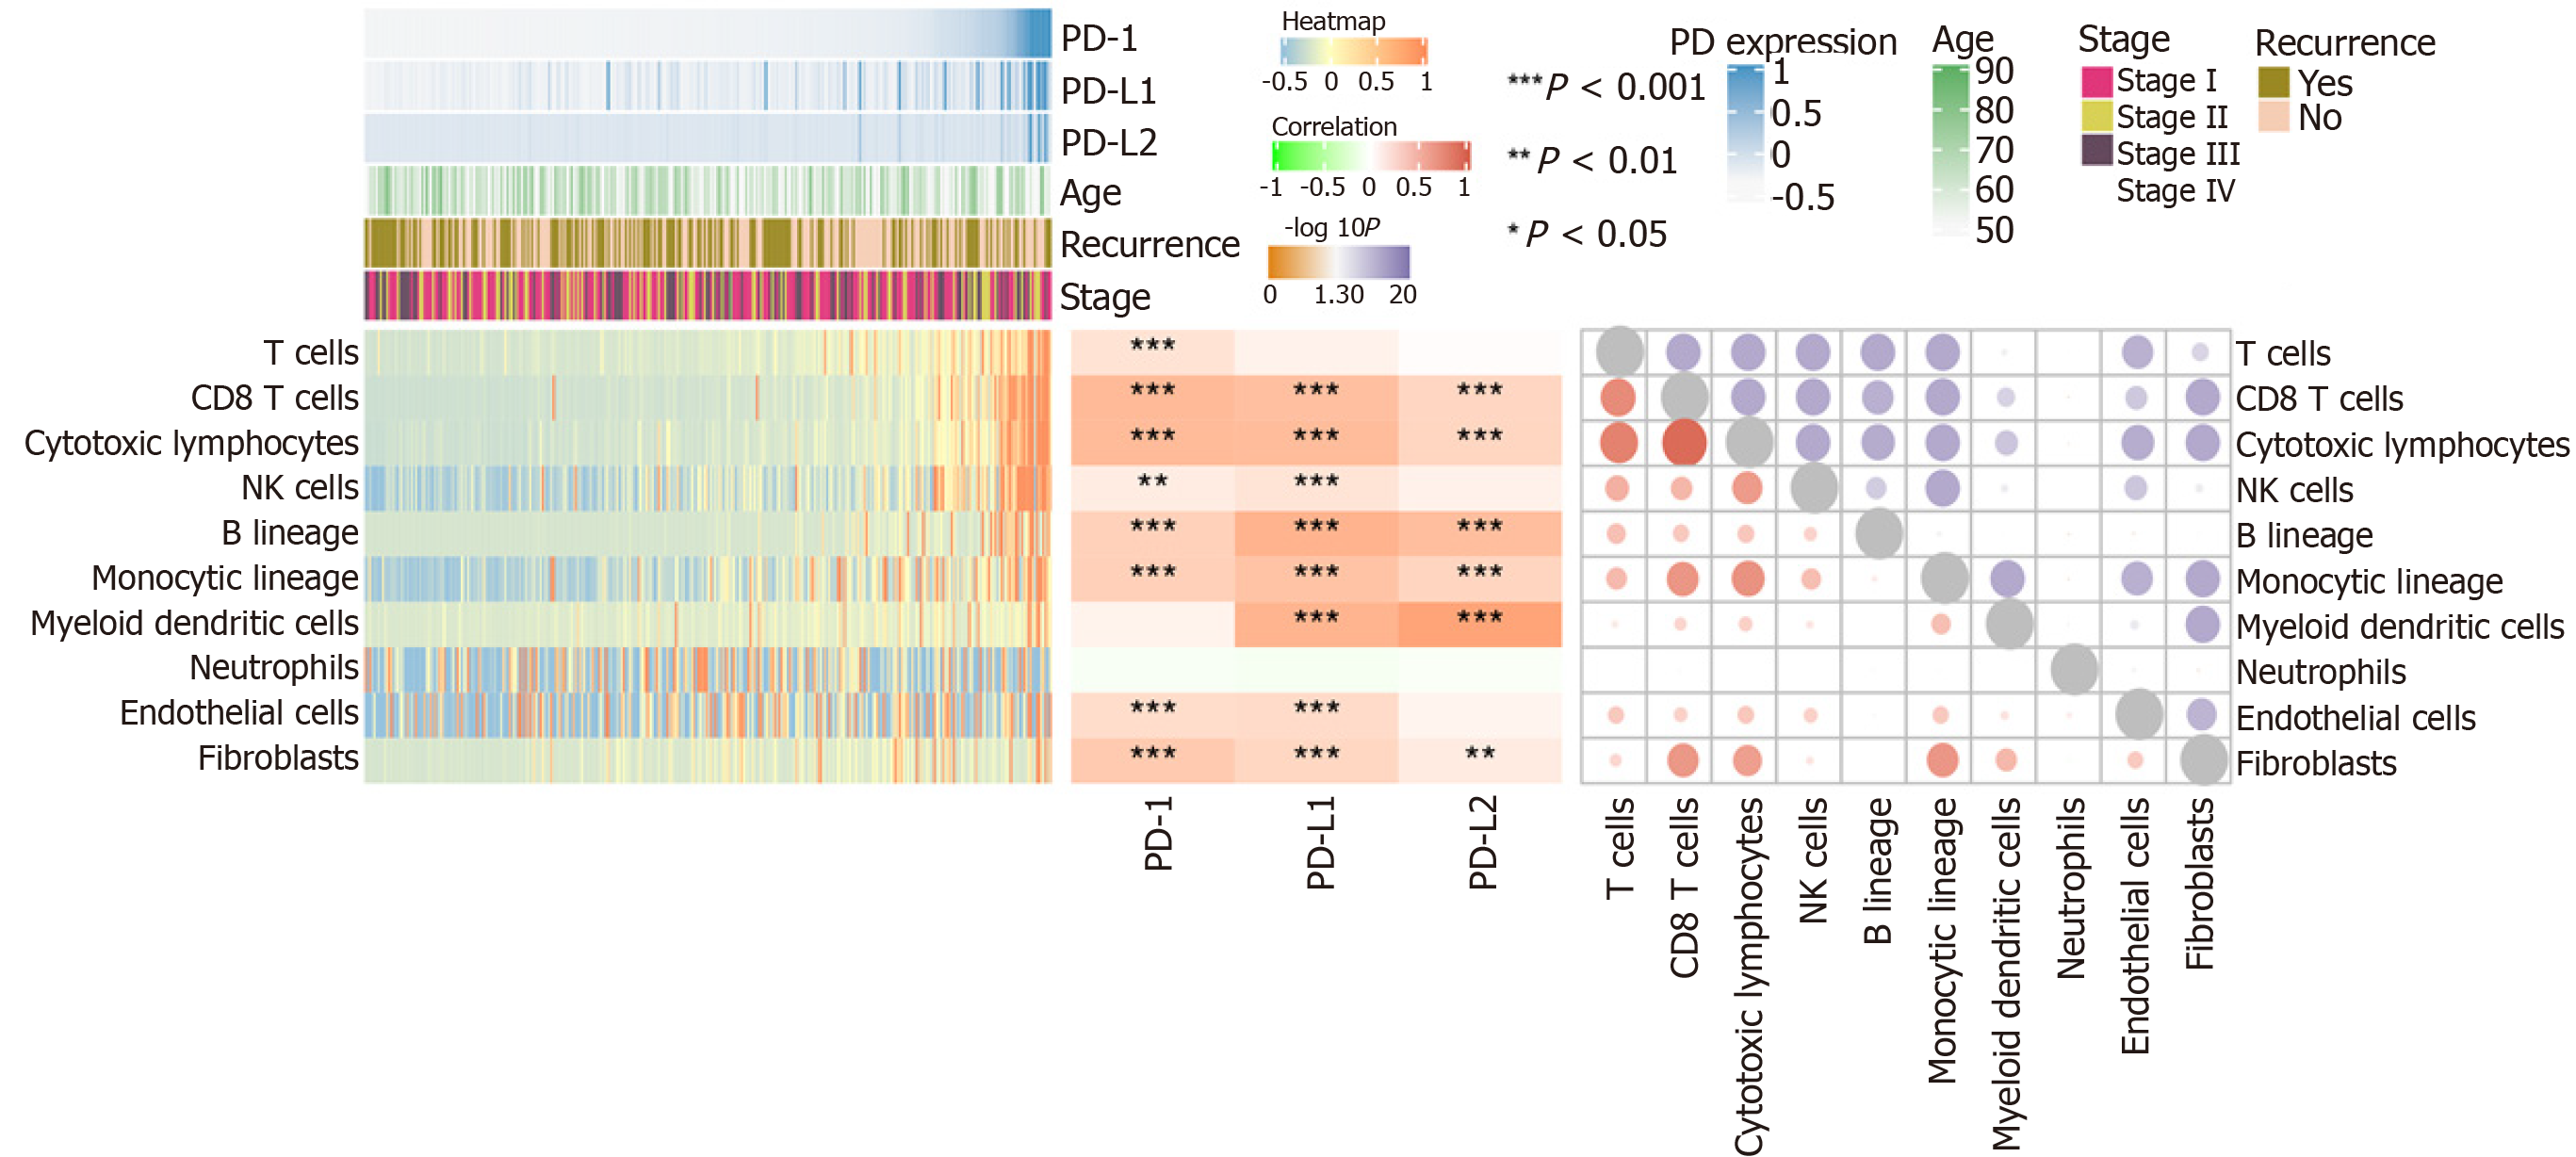
Figure 4 Programmed death 1/programmed death ligand 1/programmed death ligand 2 expression and immune infiltration.
The score of immune infiltration is calculated based on the MCP-counter algorithm. The left heatmap shows the immune infiltration score in hepatocellular carcinoma. The lower part is the immune infiltration score in each sample. The upper part is the gene expression of each sample and some common clinical features. The middle heatmap shows the relationship between gene expression and immune infiltration, and the right heatmap shows the relation among immune infiltration. The lower part is the interaction coefficient, and the upper part is the -log10 (P value) of the correlation analysis. PD-1: Programmed death 1; PD-L1: Programmed death ligand 1; PD-L2: Programmed death ligand 2; NK: Natural killer.
- Citation: Sheng QJ, Tian WY, Dou XG, Zhang C, Li YW, Han C, Fan YX, Lai PP, Ding Y. Programmed death 1, ligand 1 and 2 correlated genes and their association with mutation, immune infiltration and clinical outcomes of hepatocellular carcinoma. World J Gastrointest Oncol 2020; 12(11): 1255-1271
- URL: https://www.wjgnet.com/1948-5204/full/v12/i11/1255.htm
- DOI: https://dx.doi.org/10.4251/wjgo.v12.i11.1255


