Copyright
©The Author(s) 2024.
World J Gastrointest Oncol. Apr 15, 2024; 16(4): 1319-1333
Published online Apr 15, 2024. doi: 10.4251/wjgo.v16.i4.1319
Published online Apr 15, 2024. doi: 10.4251/wjgo.v16.i4.1319
Figure 1 The process of present mendelian randomization analyses is shown in flow chart.
A: Principle diagram of mendelian randomization study; B: Diagrammatic illustration of the complete mendelian randomization analysis process. Other risk factors influencing the occurrence of cholangiocarcinoma include exposure to fluke infections, inflammatory bowel disease, intrahepatic bile duct stones, choledochal cysts, and primary sclerosing cholangitis. Assumption 1: The instrumental variables (IVs) selected for this study should demonstrate a significant association with gut microbiota; Assumption 2: The IVs chosen for present study are required to have no significant associations with other potential confounding factors; Assumption 3: The IVs utilized in present study do not have any independent causal pathways leading to the outcome (CCA) other than through gut microbiota. MR: Mendelian randomization; IV: Instrumental variable; CCA: Cholangiocarcinoma; GC: Gallbladder cancer; eCCA: Extrahepatic cholangiocarcinoma; iCCA: Intrahepatic cholangiocarcinoma; LD: Linkage disequilibrium; SNPs: Single nucleotide polymorphisms.
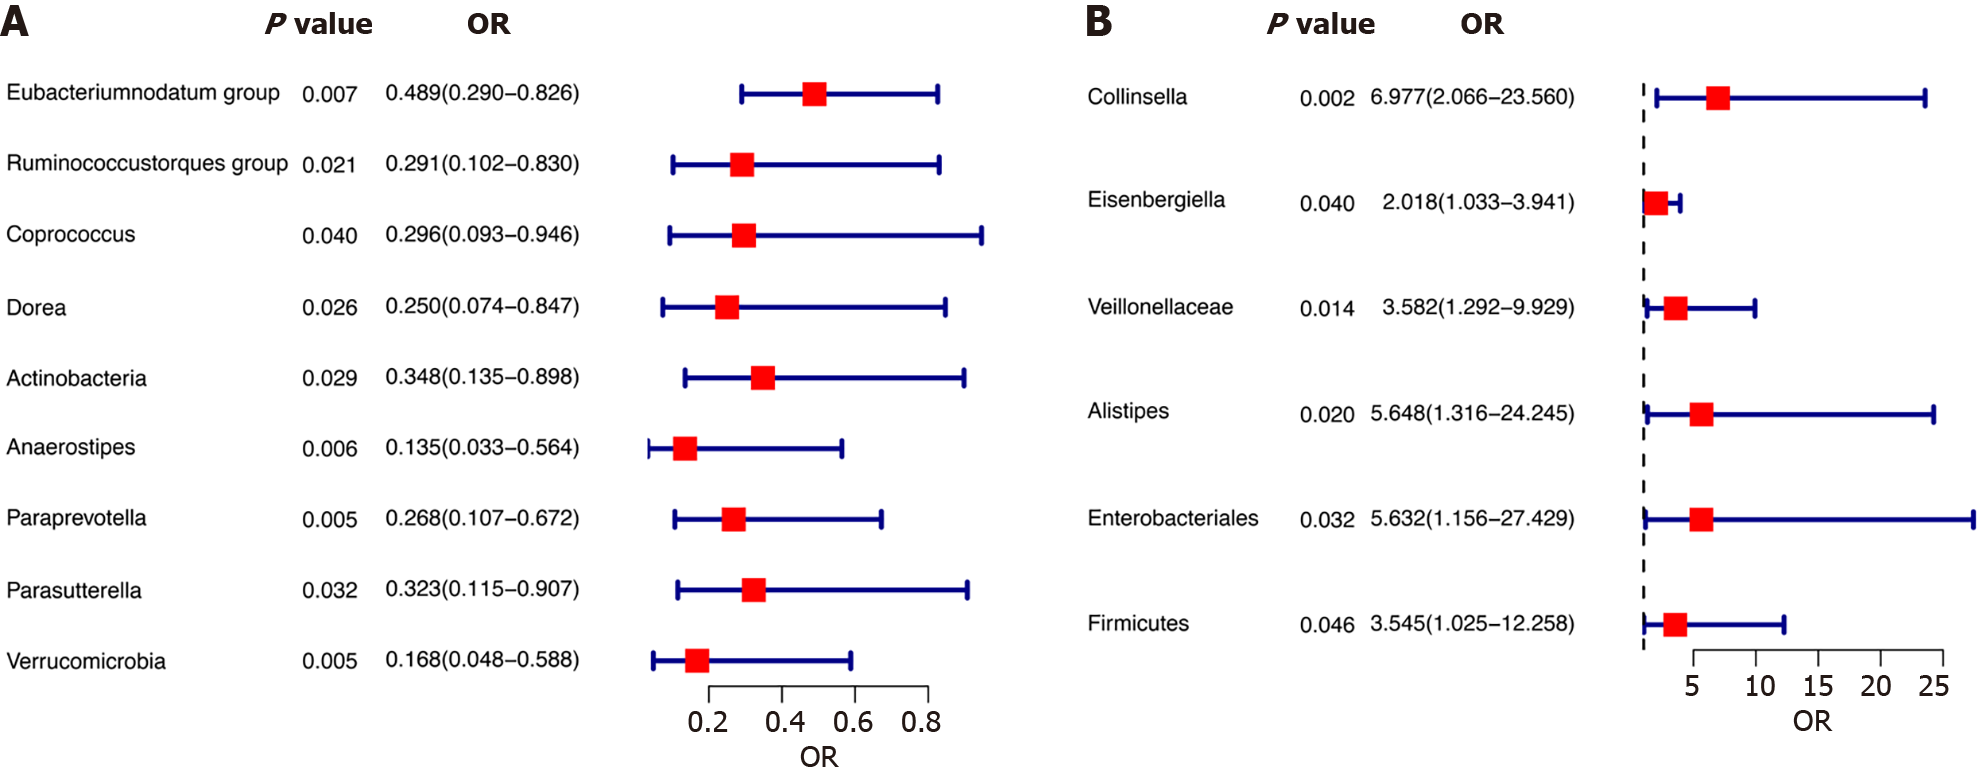
Figure 2 The forest plot illustrates the relationships between gut microbiota and cholangiocarcinoma.
A: An increased abundance of gut microbial taxa was observed to be linked with a reduced risk of cholangiocarcinoma (CCA); B: An increased abundance of gut microbial taxa was observed to be linked with an elevated risk of CCA. OR: Odds ratio.
Figure 3 Scatter plots of causal estimates of specific gut microbiota taxa on gallbladder cancer and extrahepatic cholangiocarcinoma.
The slope of each line corresponding to the estimated mendelian randomization effect in different models, including the conventional inverse variance weighted, weighted median, simple mode, and weighted mode. A: Genus Eubacteriumnodatum group; B: Genus Ruminococcustorques group; C: Genus Collinsella; D: Genus Coprococcus; E: Genus Dorea; F: Genus Eisenbergiella; G: Phylum Actinobacteria. MR: Mendelian randomization; SNP: Single nucleotide polymorphisms.
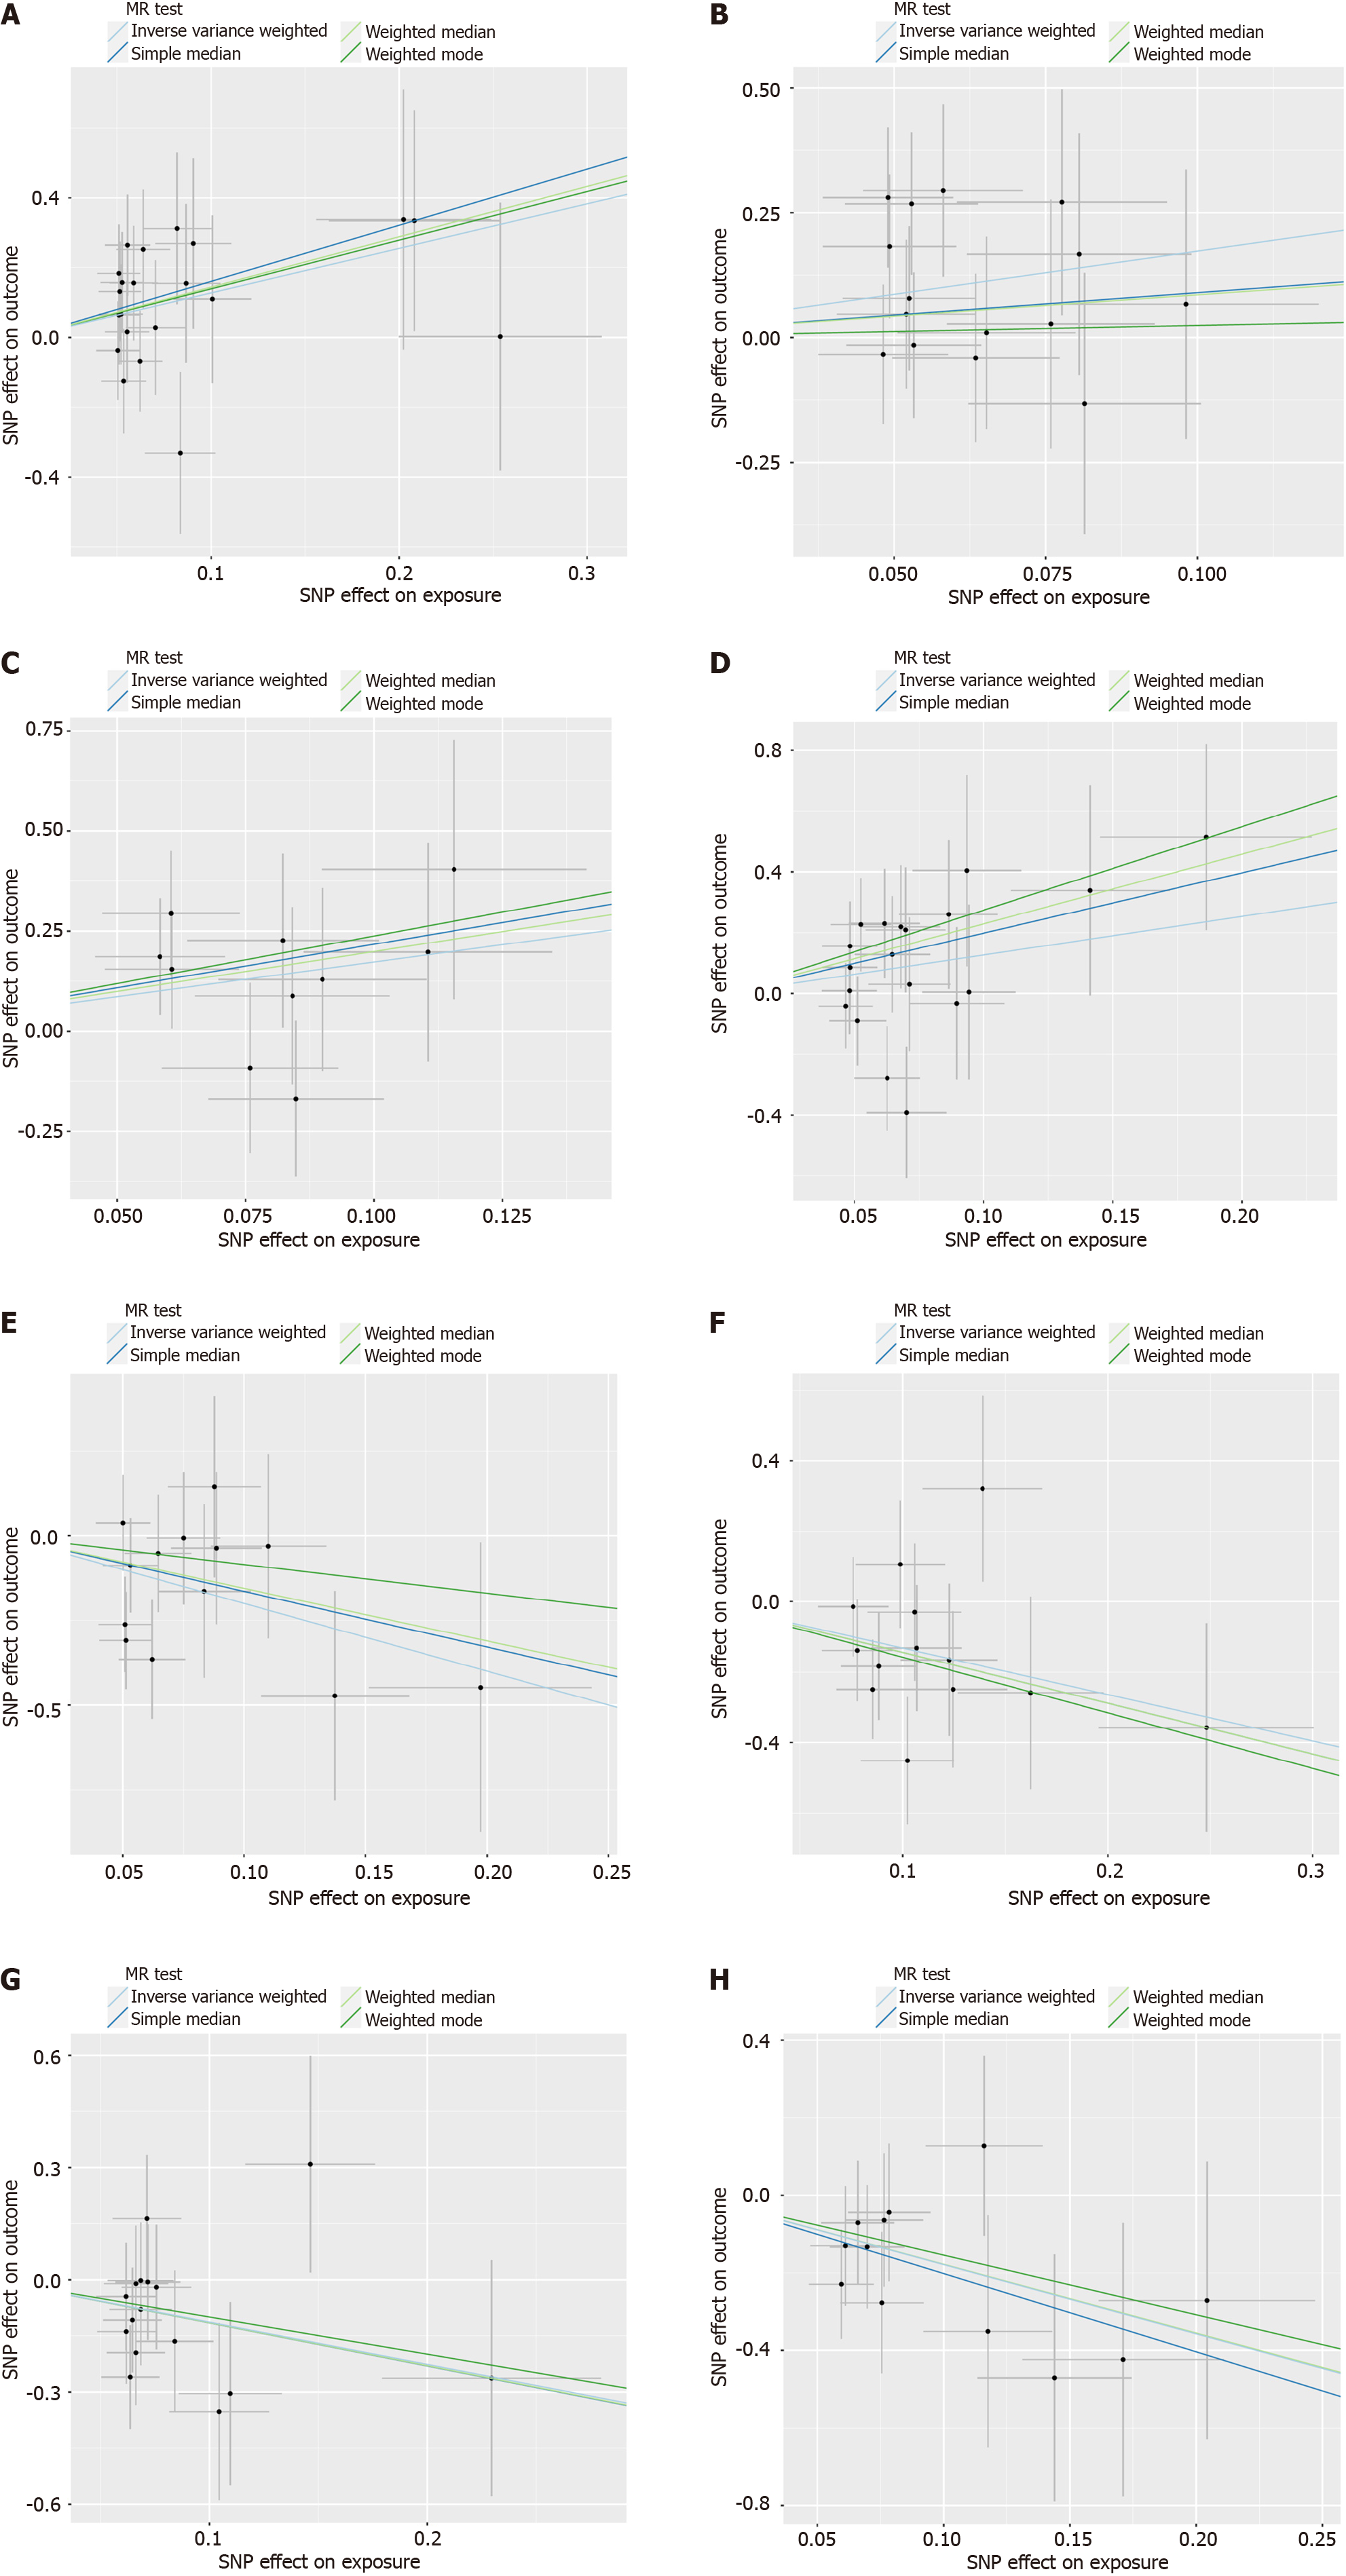
Figure 4 Scatter plots of causal estimates of specific gut microbiota taxa on intrahepatic cholangiocarcinoma.
The slope of each line corresponding to the estimated Mendelian randomization effect in different models, including the conventional inverse variance weighted, weighted median, simple mode, and weighted mode. A: Family Veillonellaceae; B: Genus Alistipes; C: Order Enterobacteriales; D: Phylum Firmicutes; E: Genus Anaerostipes; F: Genus Paraprevotella; G: Genus Parasutterella; H: Phylum Verrucomicrobia. MR: Mendelian randomization; SNP: Single nucleotide polymorphisms.
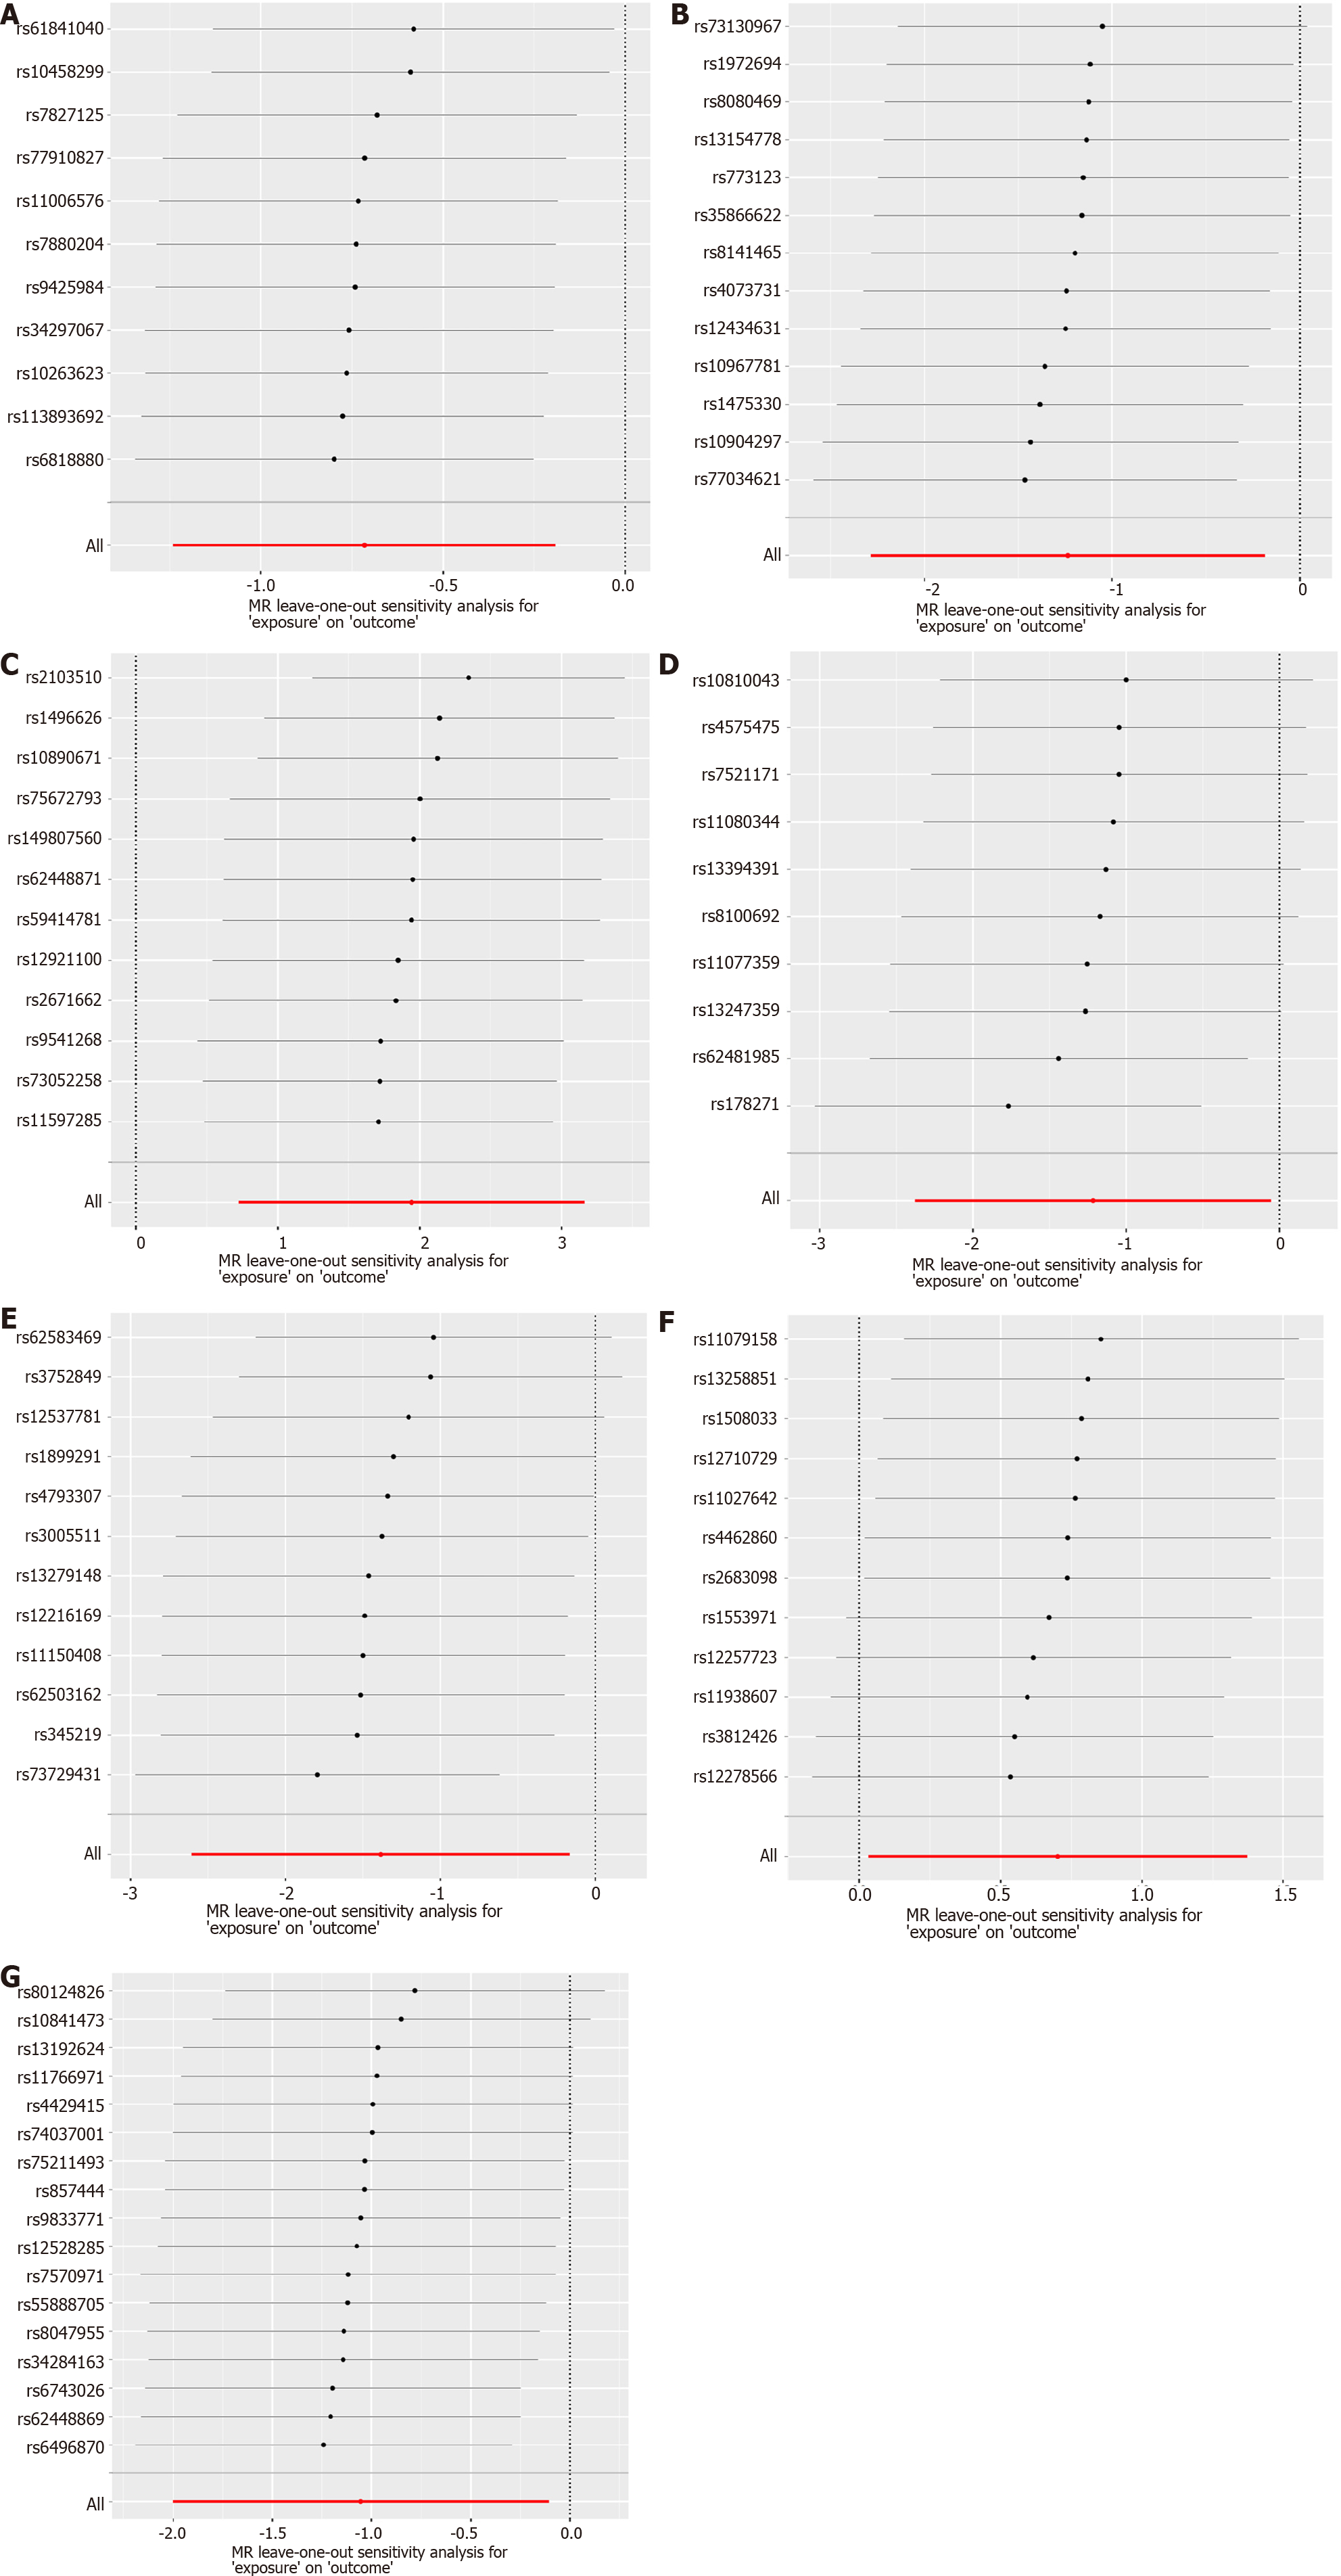
Figure 5 Leave-one-out stability tests causal estimates of specific gut microbiota taxa on gallbladder cancer and extrahepatic cholangiocarcinoma.
Calculate the Mendelian randomization results of the remaining single nucleotide polymorphisms (SNPs) after removing the SNP one by one. A: Genus Eubacteriumnodatum group; B: Genus Ruminococcustorques group; C: Genus Collinsella; D: Genus Coprococcus; E: Genus Dorea; F: Genus Eisenbergiella; G: Phylum Actinobacteria. MR: Mendelian randomization; SNP: Single nucleotide polymorphisms.
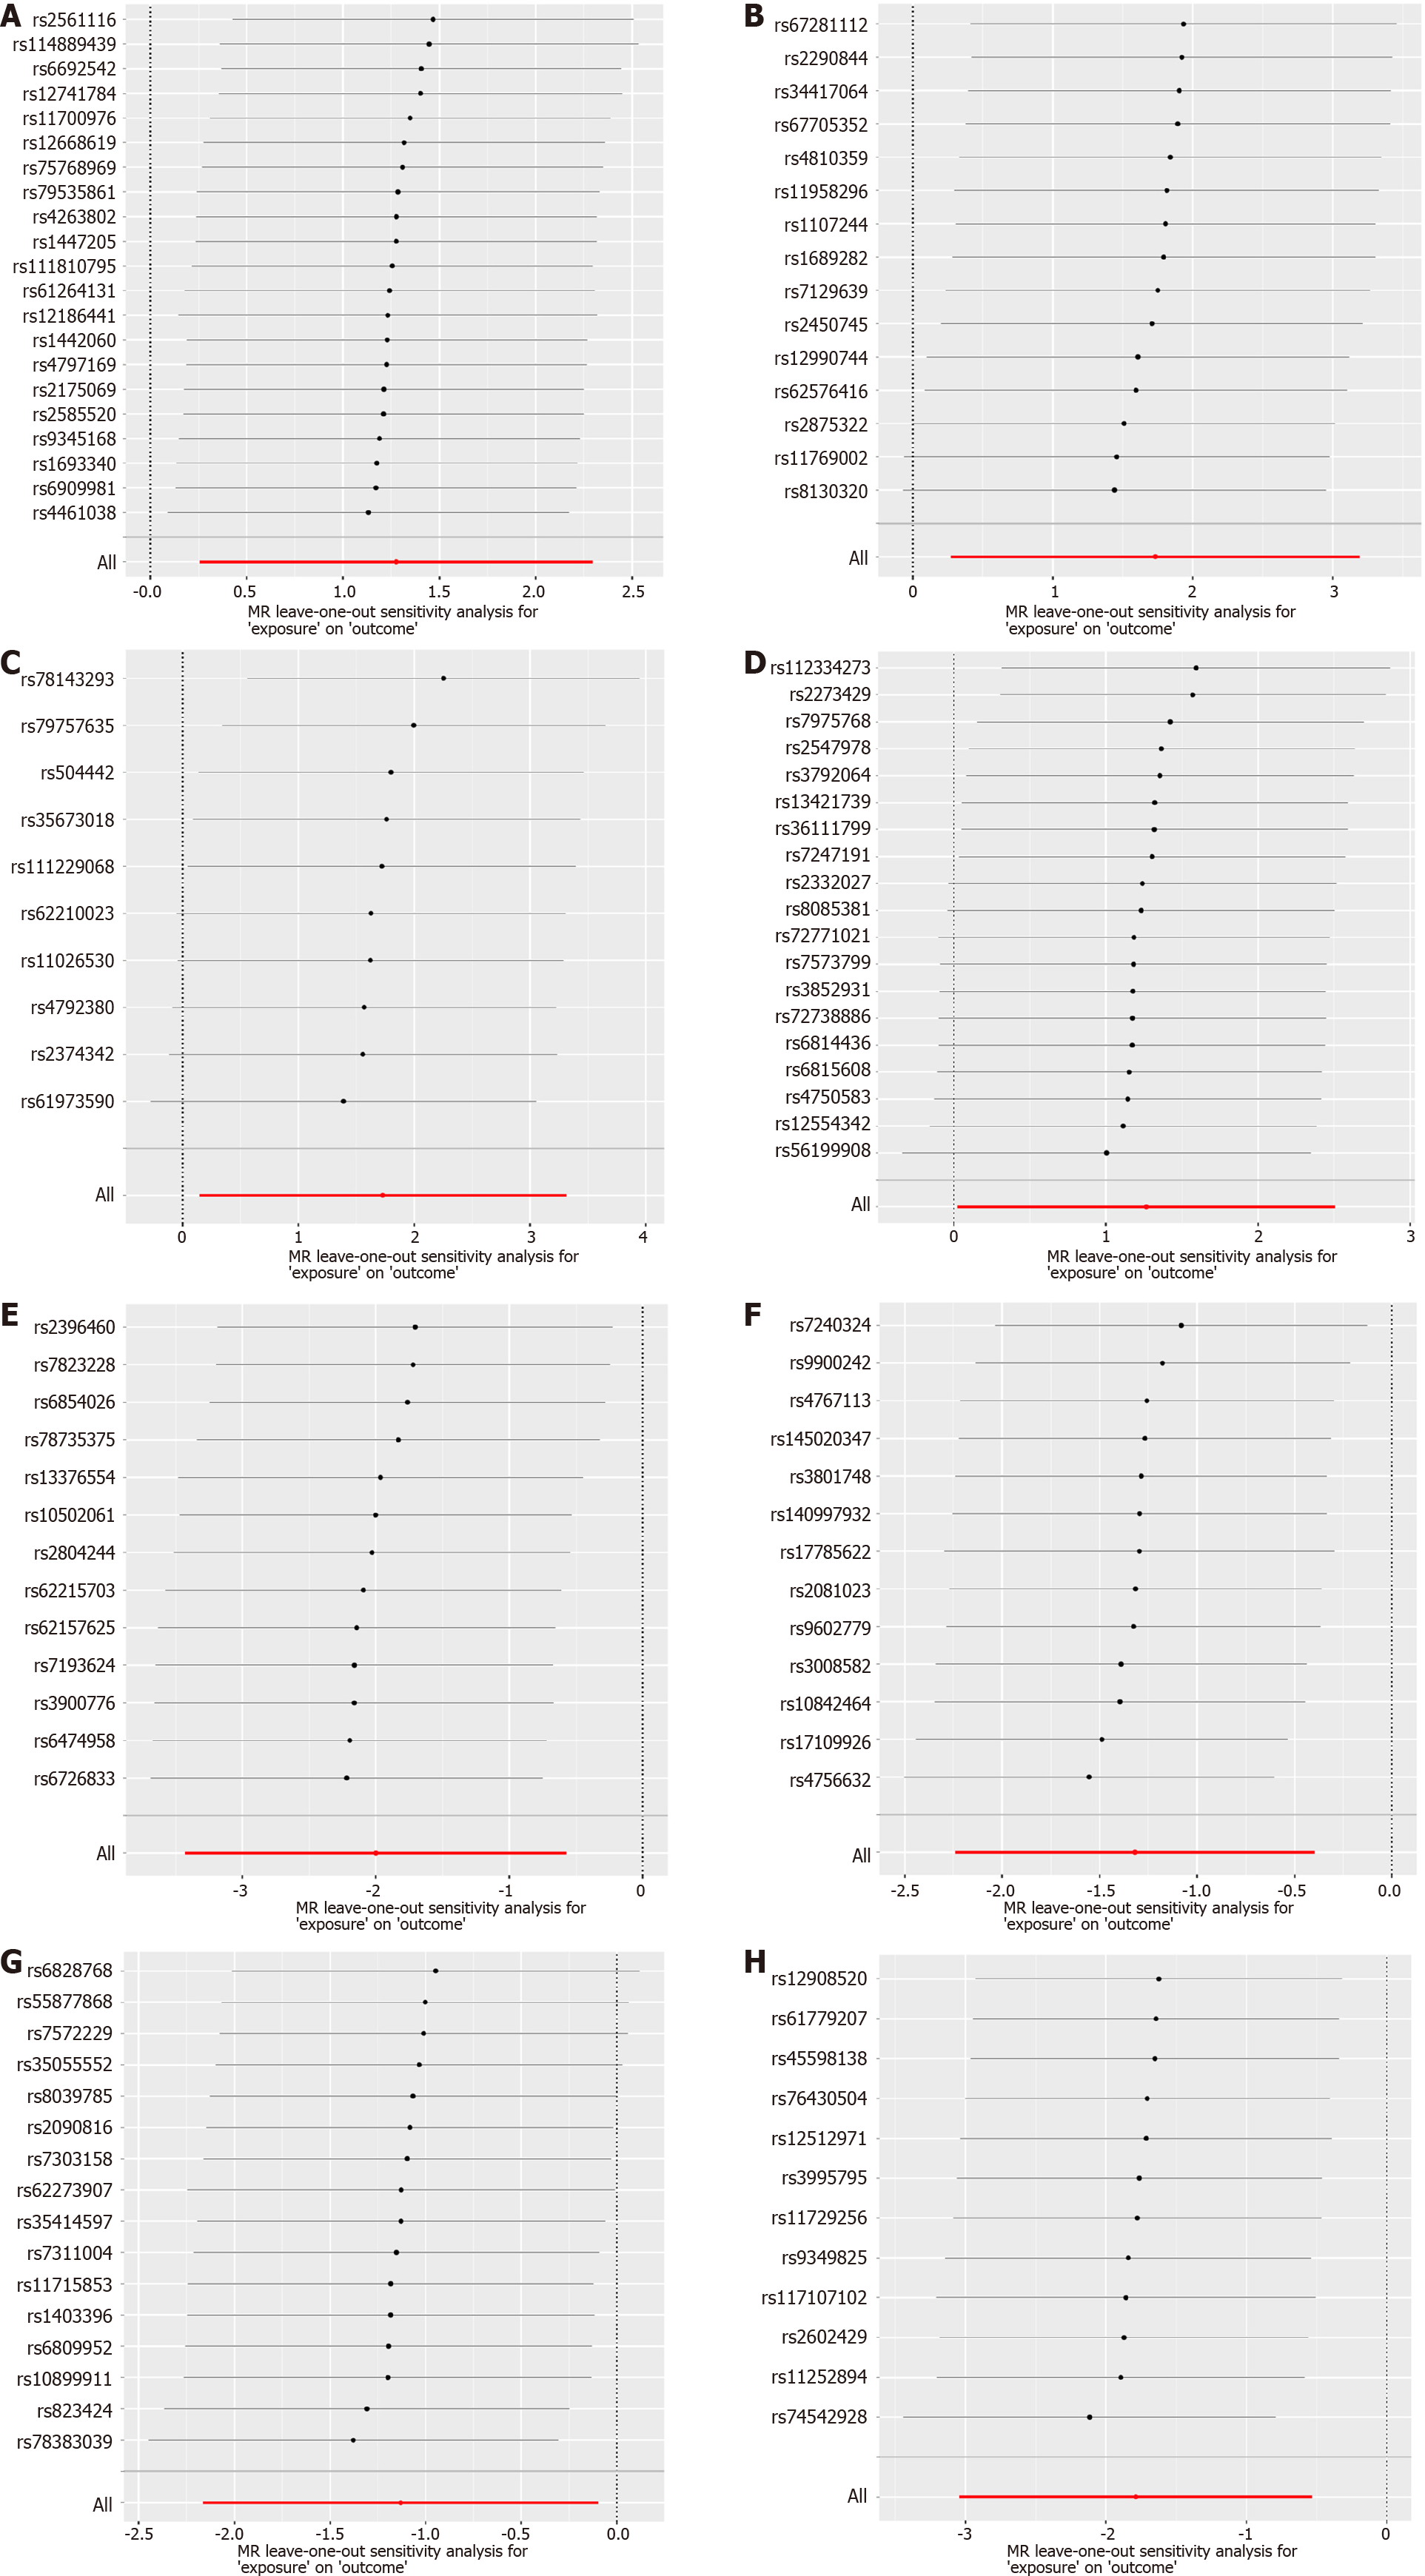
Figure 6 Leave-one-out stability tests causal estimates of specific gut microbiota taxa on intrahepatic cholangiocarcinoma.
Calculate the mendelian randomization results of the remaining single nucleotide polymorphisms (SNPs) after removing the SNP one by one. A: Family Veillonellaceae; B: Genus Alistipes; C: Order Enterobacteriales; D: Phylum Firmicutes; E: Genus Anaerostipes; F: Genus Paraprevotella; G: Genus Parasutterella; H: Phylum Verrucomicrobia. MR: Mendelian randomization; SNP: Single nucleotide polymorphisms.
- Citation: Chen ZT, Ding CC, Chen KL, Gu YJ, Lu CC, Li QY. Causal roles of gut microbiota in cholangiocarcinoma etiology suggested by genetic study. World J Gastrointest Oncol 2024; 16(4): 1319-1333
- URL: https://www.wjgnet.com/1948-5204/full/v16/i4/1319.htm
- DOI: https://dx.doi.org/10.4251/wjgo.v16.i4.1319


