Copyright
©The Author(s) 2024.
World J Gastrointest Oncol. Mar 15, 2024; 16(3): 968-978
Published online Mar 15, 2024. doi: 10.4251/wjgo.v16.i3.968
Published online Mar 15, 2024. doi: 10.4251/wjgo.v16.i3.968
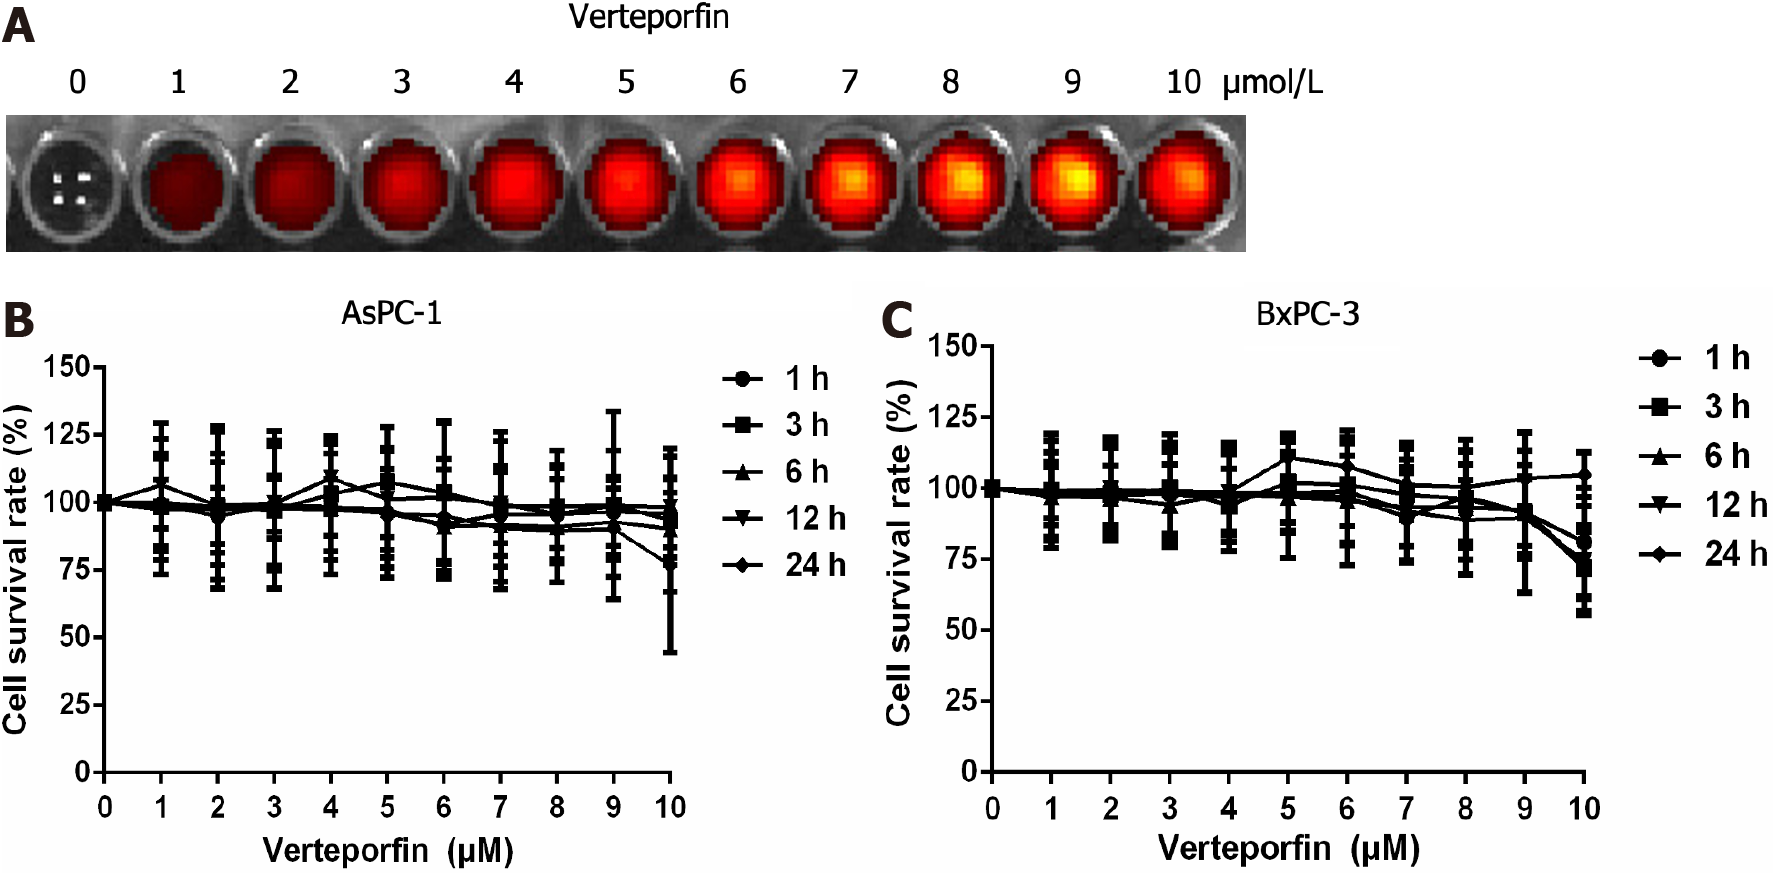
Figure 1 Fluorescence of verteporfin and proliferation of human pancreatic cancer cells after incubation with verteporfin.
A: Fluorescence imaging of different concentrations of verteporfin using an IVIS Spectrum small animal imaging system; B and C: Proliferation of (B) AsPC-1 cells and (C) BxPC-3 cells after incubation with different concentrations of verteporfin (nil, 1, 2, 3, 4, 5, 6, 7, 8, 9, 10 μmol/L) for 1, 3, 6, 12, and 24 h; preformed in triplicate.
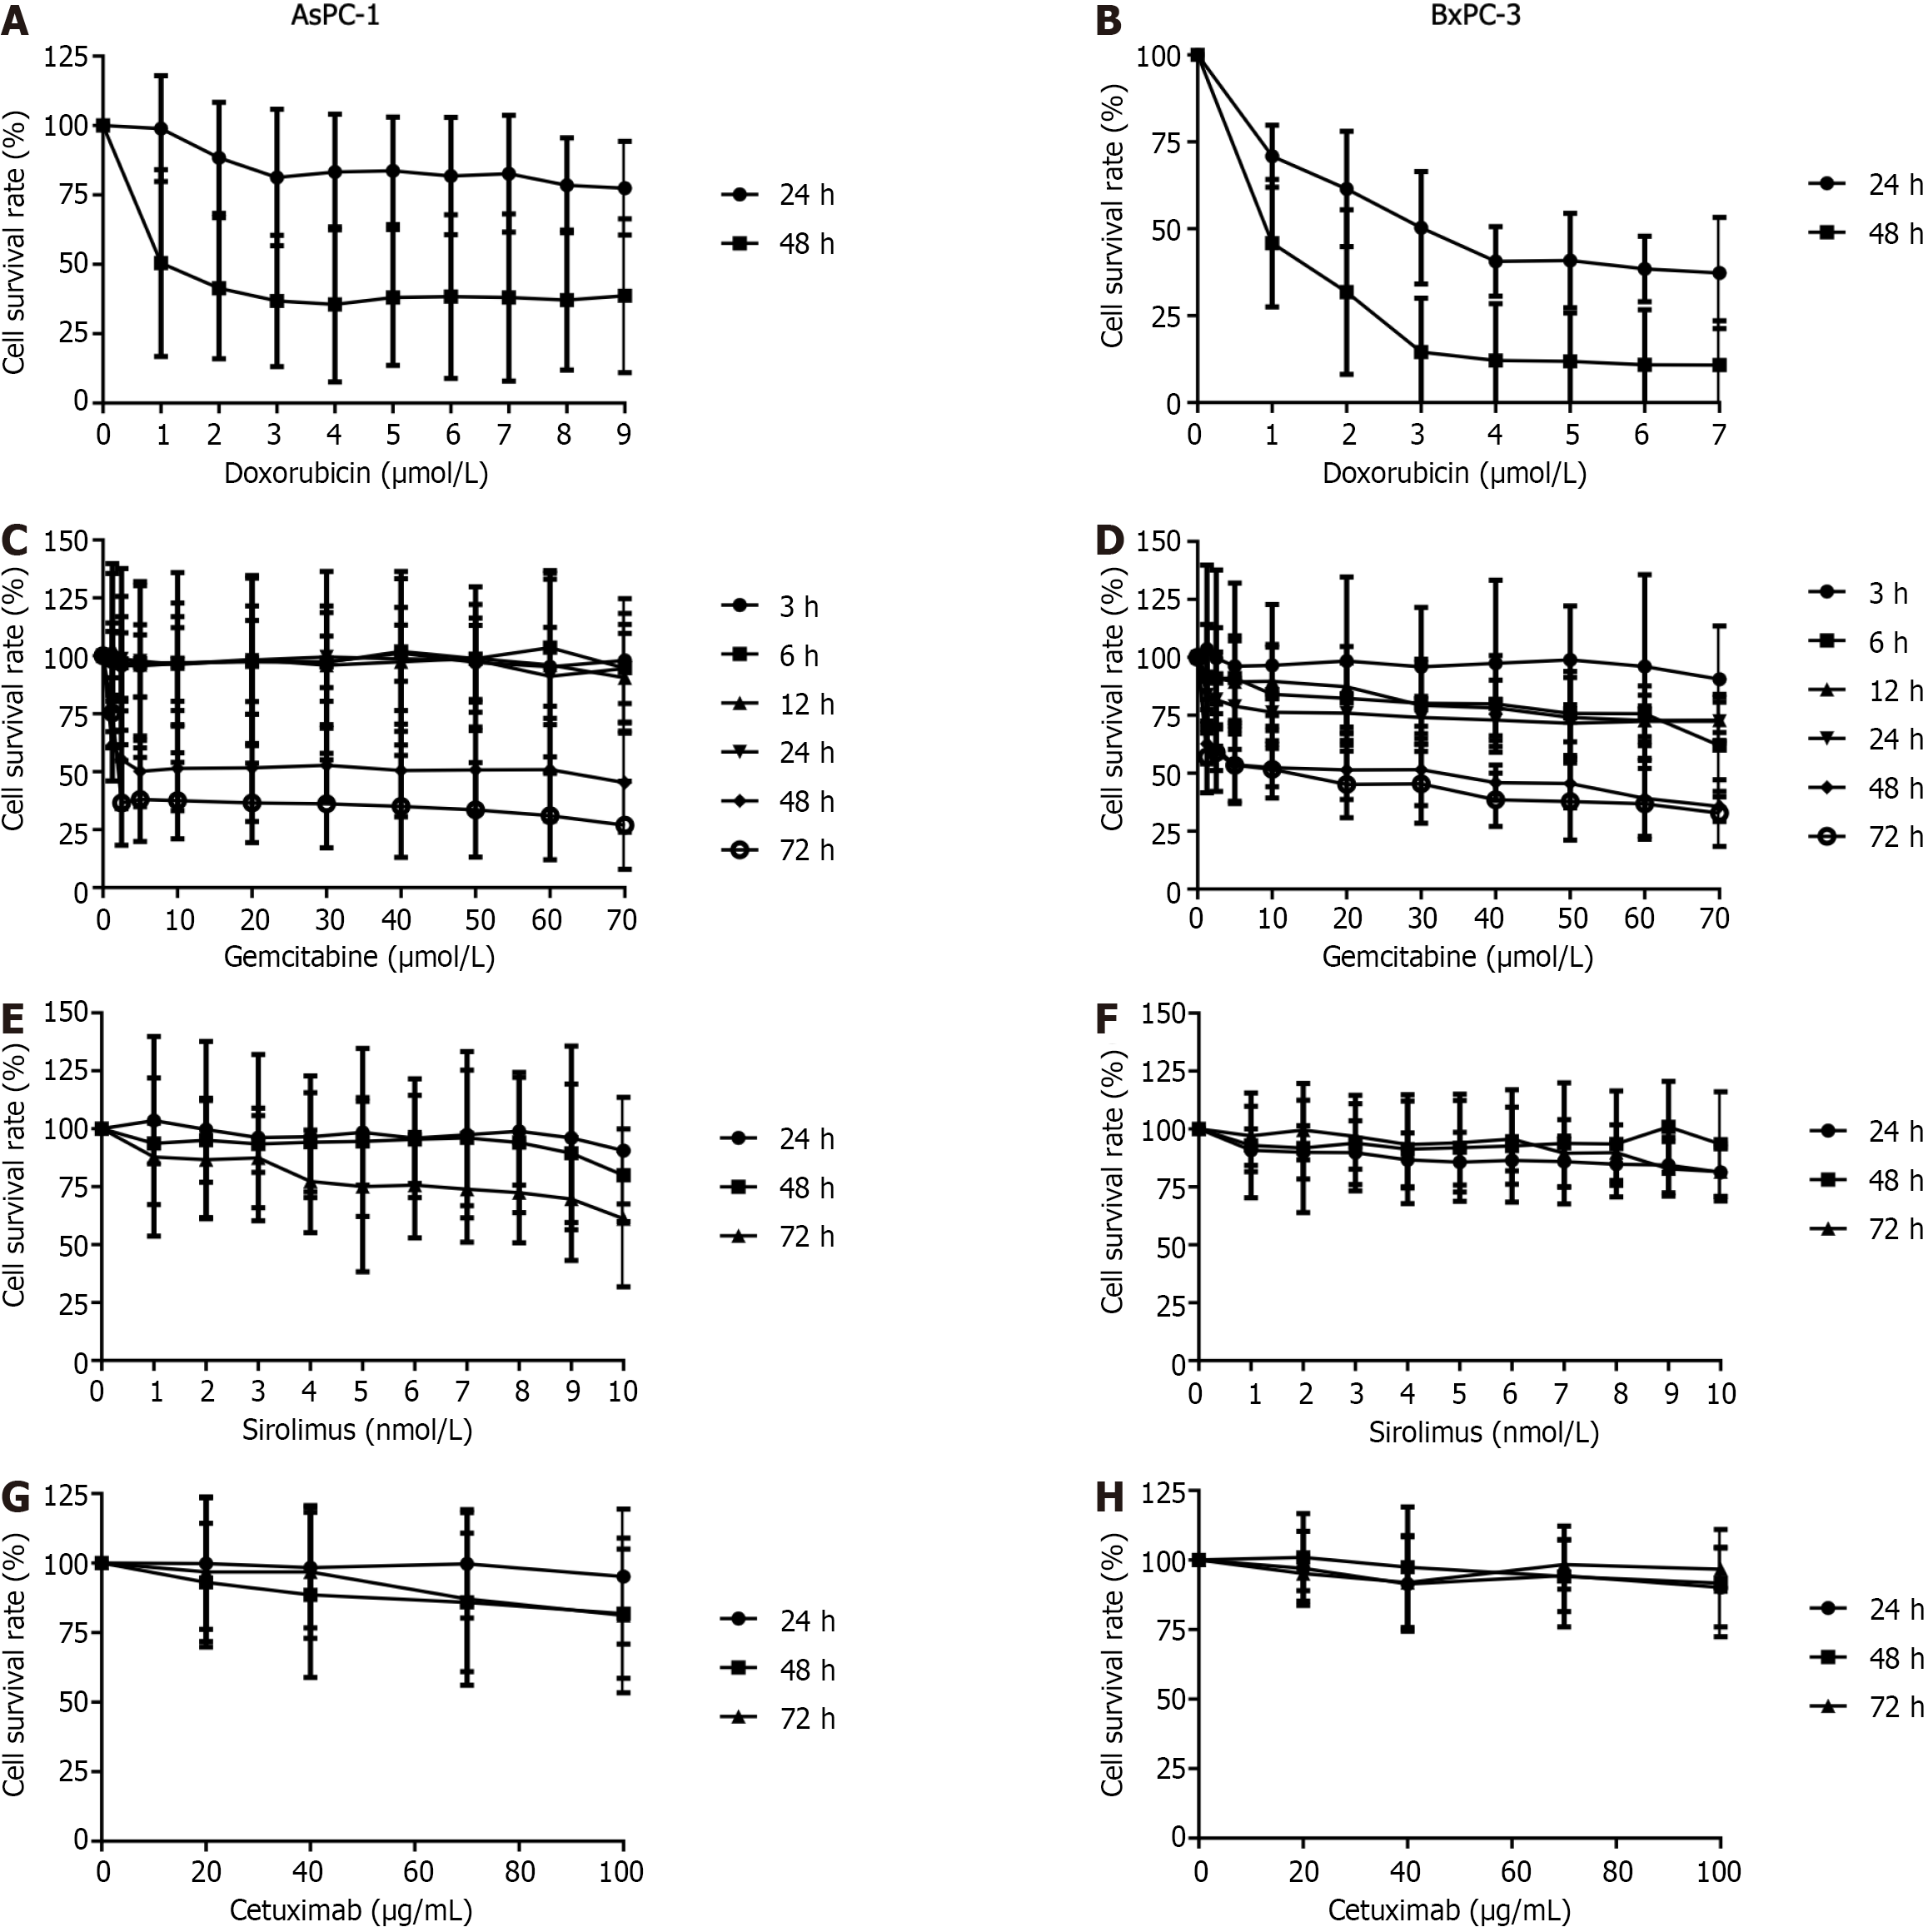
Figure 2 Proliferation of pancreatic cancer cells after incubation with different drugs.
A and B: Proliferation of AsPC-1 cells (A) and BxPC-3 cells (B) after incubation with different concentrations of doxorubicin (nil, 0.2, 0.6, 0.8, 1.0, 1.2, 1.4 μmol/L) for 24 h and 48 h; C and D: Proliferation of AsPC-1 cells (C) and BxPC-3 cells (D) after incubation with different concentrations of gemcitabine (nil, 1.25, 2.5, 5, 10, 20, 30, 40, 50, 60, 70 μmol/L) for 3 h, 6 h, 12 h, 24 h, 48 h and 72 h; E and F: Proliferative viability of AsPC-1 cells (E) and BxPC-3 cells (F) after incubation with different concentrations of sirolimus (0 nmol/L, 1 nmol/L, 2 nmol/L, 3 nmol/L, 4 nmol/L, 5 nmol/L, 6 nmol/L, 7 nmol/L, 8 nmol/L, 9 nmol/L, 10 nmol/L) for 24 h, 48 h and 72 h; G and H: Proliferative viability of AsPC-1 cells (G) and BxPC-3 cells (H) after incubation with different concentrations of cetuximab (nil, 20, 40, 60, 80, and 100 μg/mL) for 24, 48 and 72 h; preformed in triplicate.
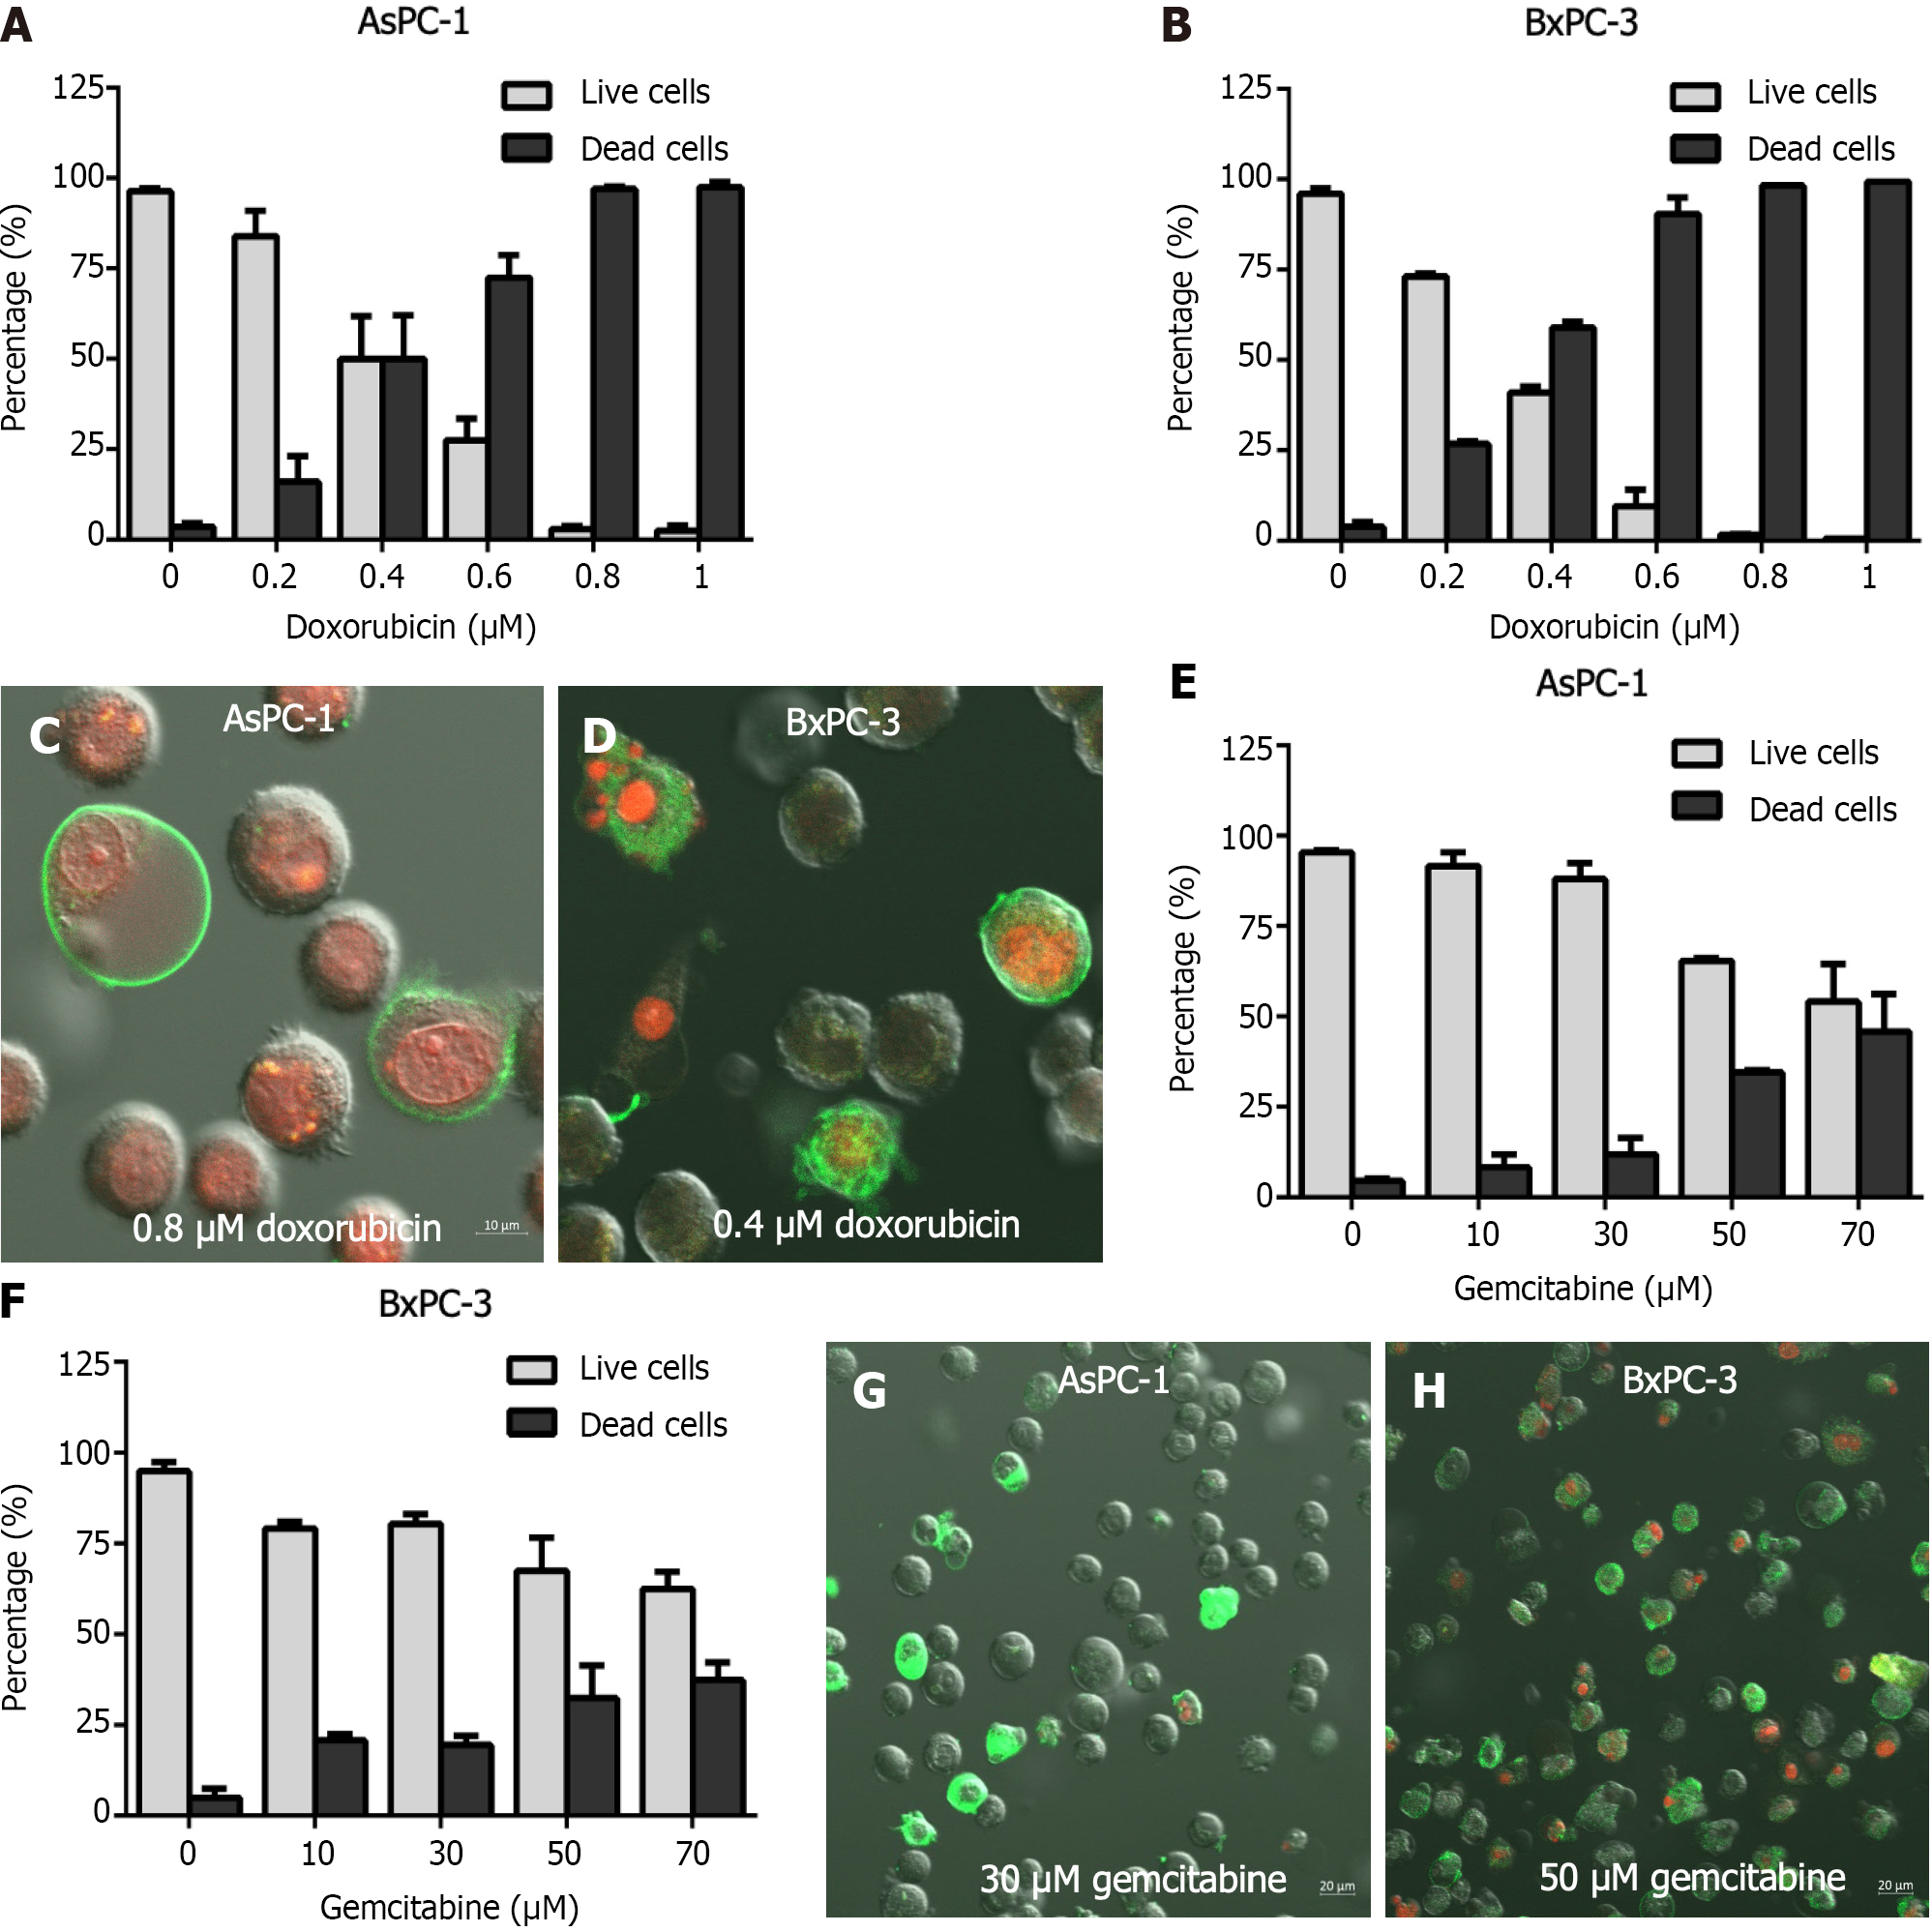
Figure 3 Apoptosis of pancreatic cancer cells after incubation with doxorubicin and gemcitabine.
A: Apoptotic rates of AsPC-1 cells after incubation with different concentrations of doxorubicin (DOX) (nil, 0.2, 0.4, 0.6, 0.8, 1 μmol/L) for 48 h; B: Apoptotic rate of BxPC-3 cells after incubation with different concentrations of DOX (nil, 0.2, 0.4, 0.6, 0.8, 1 μmol/L) for 48 h; C: AsPC-1 pancreatic cancer (PC) cells were incubated with 0.8 μmol/L DOX for 48 h and observed by confocal laser scanning microscopy after staining with Annexin V-FITC and propidium iodide (PI); D: BxPC-1 PC cells were incubated with 0.4 μmol/L DOX for 48 h and observed by confocal laser scanning microscopy after staining with Annexin V-FITC and PI; E: Apoptotic rate of AsPC-1 cells after incubation with different concentrations of gemcitabine (GEM) (nil, 10, 30, 50, 70 μmol/L) for 72 h; F: Apoptotic rates of BxPC-3 cells after incubation with different concentrations of GEM (nil, 10, 30, 50, 70 μmol/L) for 72 h; G: AsPC-1 cells were incubated with 30 μmol/L of GEM for 72 h and observed by confocal laser scanning microscopy after staining with Annexin V-FITC and PI; H: BxPC-1 cells were incubated with 50 μmol/L of GEM for 72 h and observed by confocal laser scanning microscopy after staining with Annexin V-FITC and PI. Experiments were performed in triplicate.
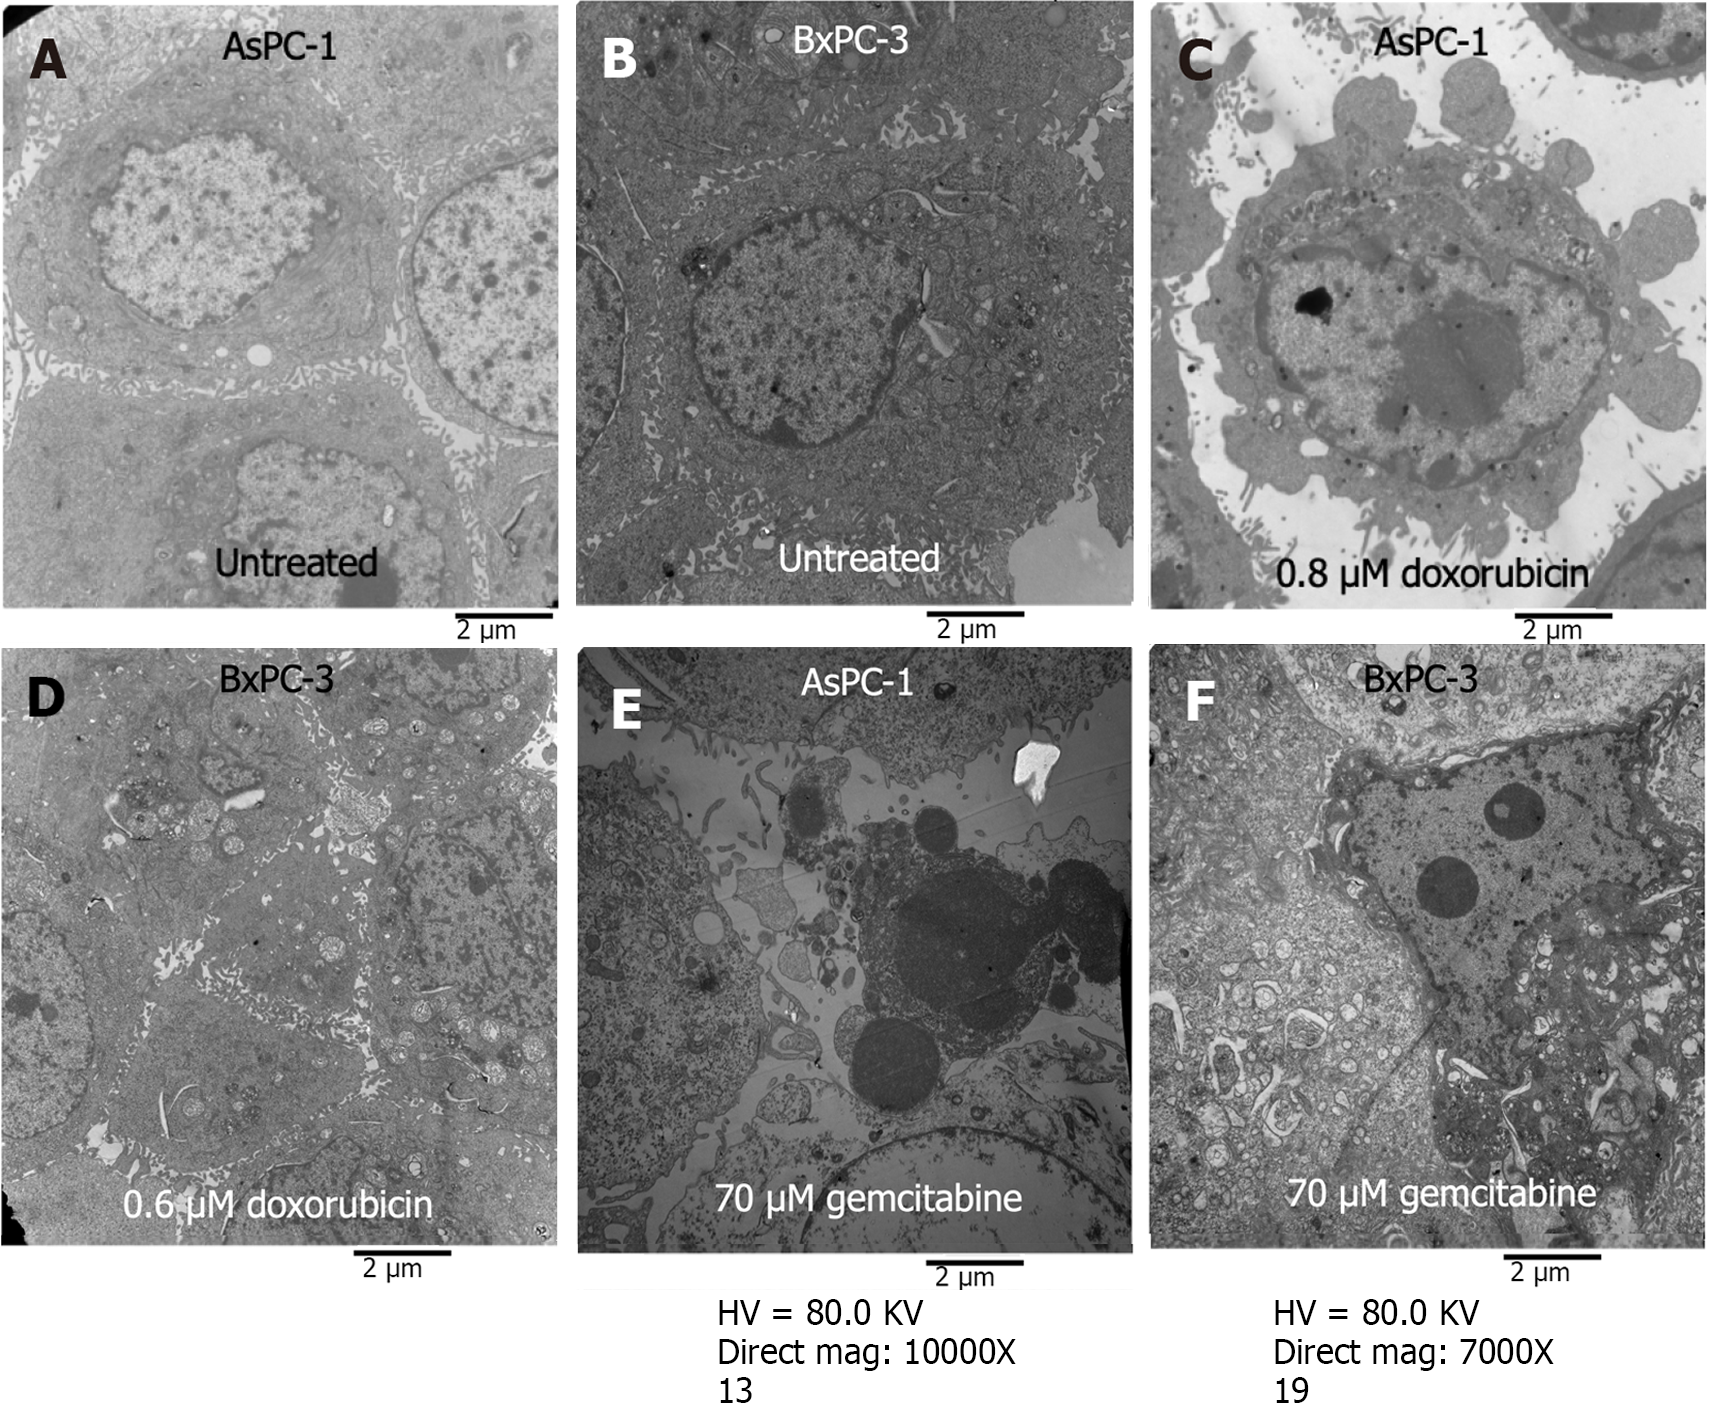
Figure 4 Pancreatic cancer cells viewed by transmission electron microscopy.
A and B: Untreated (A) AsPC-1 (B) or BxPC-3 cells were used as the control; C: AsPC-1 cells exposed to 0.8 μmol/L doxorubicin (DOX) for 48 h; D: BxPC-3 treated with 0.6 μmol/L DOX for 48 h; E: AsPC-1 cells exposed to 70 μmol/L gemcitabine (GEM) for 72 h; F: BxPC-3 cells treated with 70 μmol/L GEM for 72 h. Scale bar: 2 μm. Experiments were performed in triplicate.
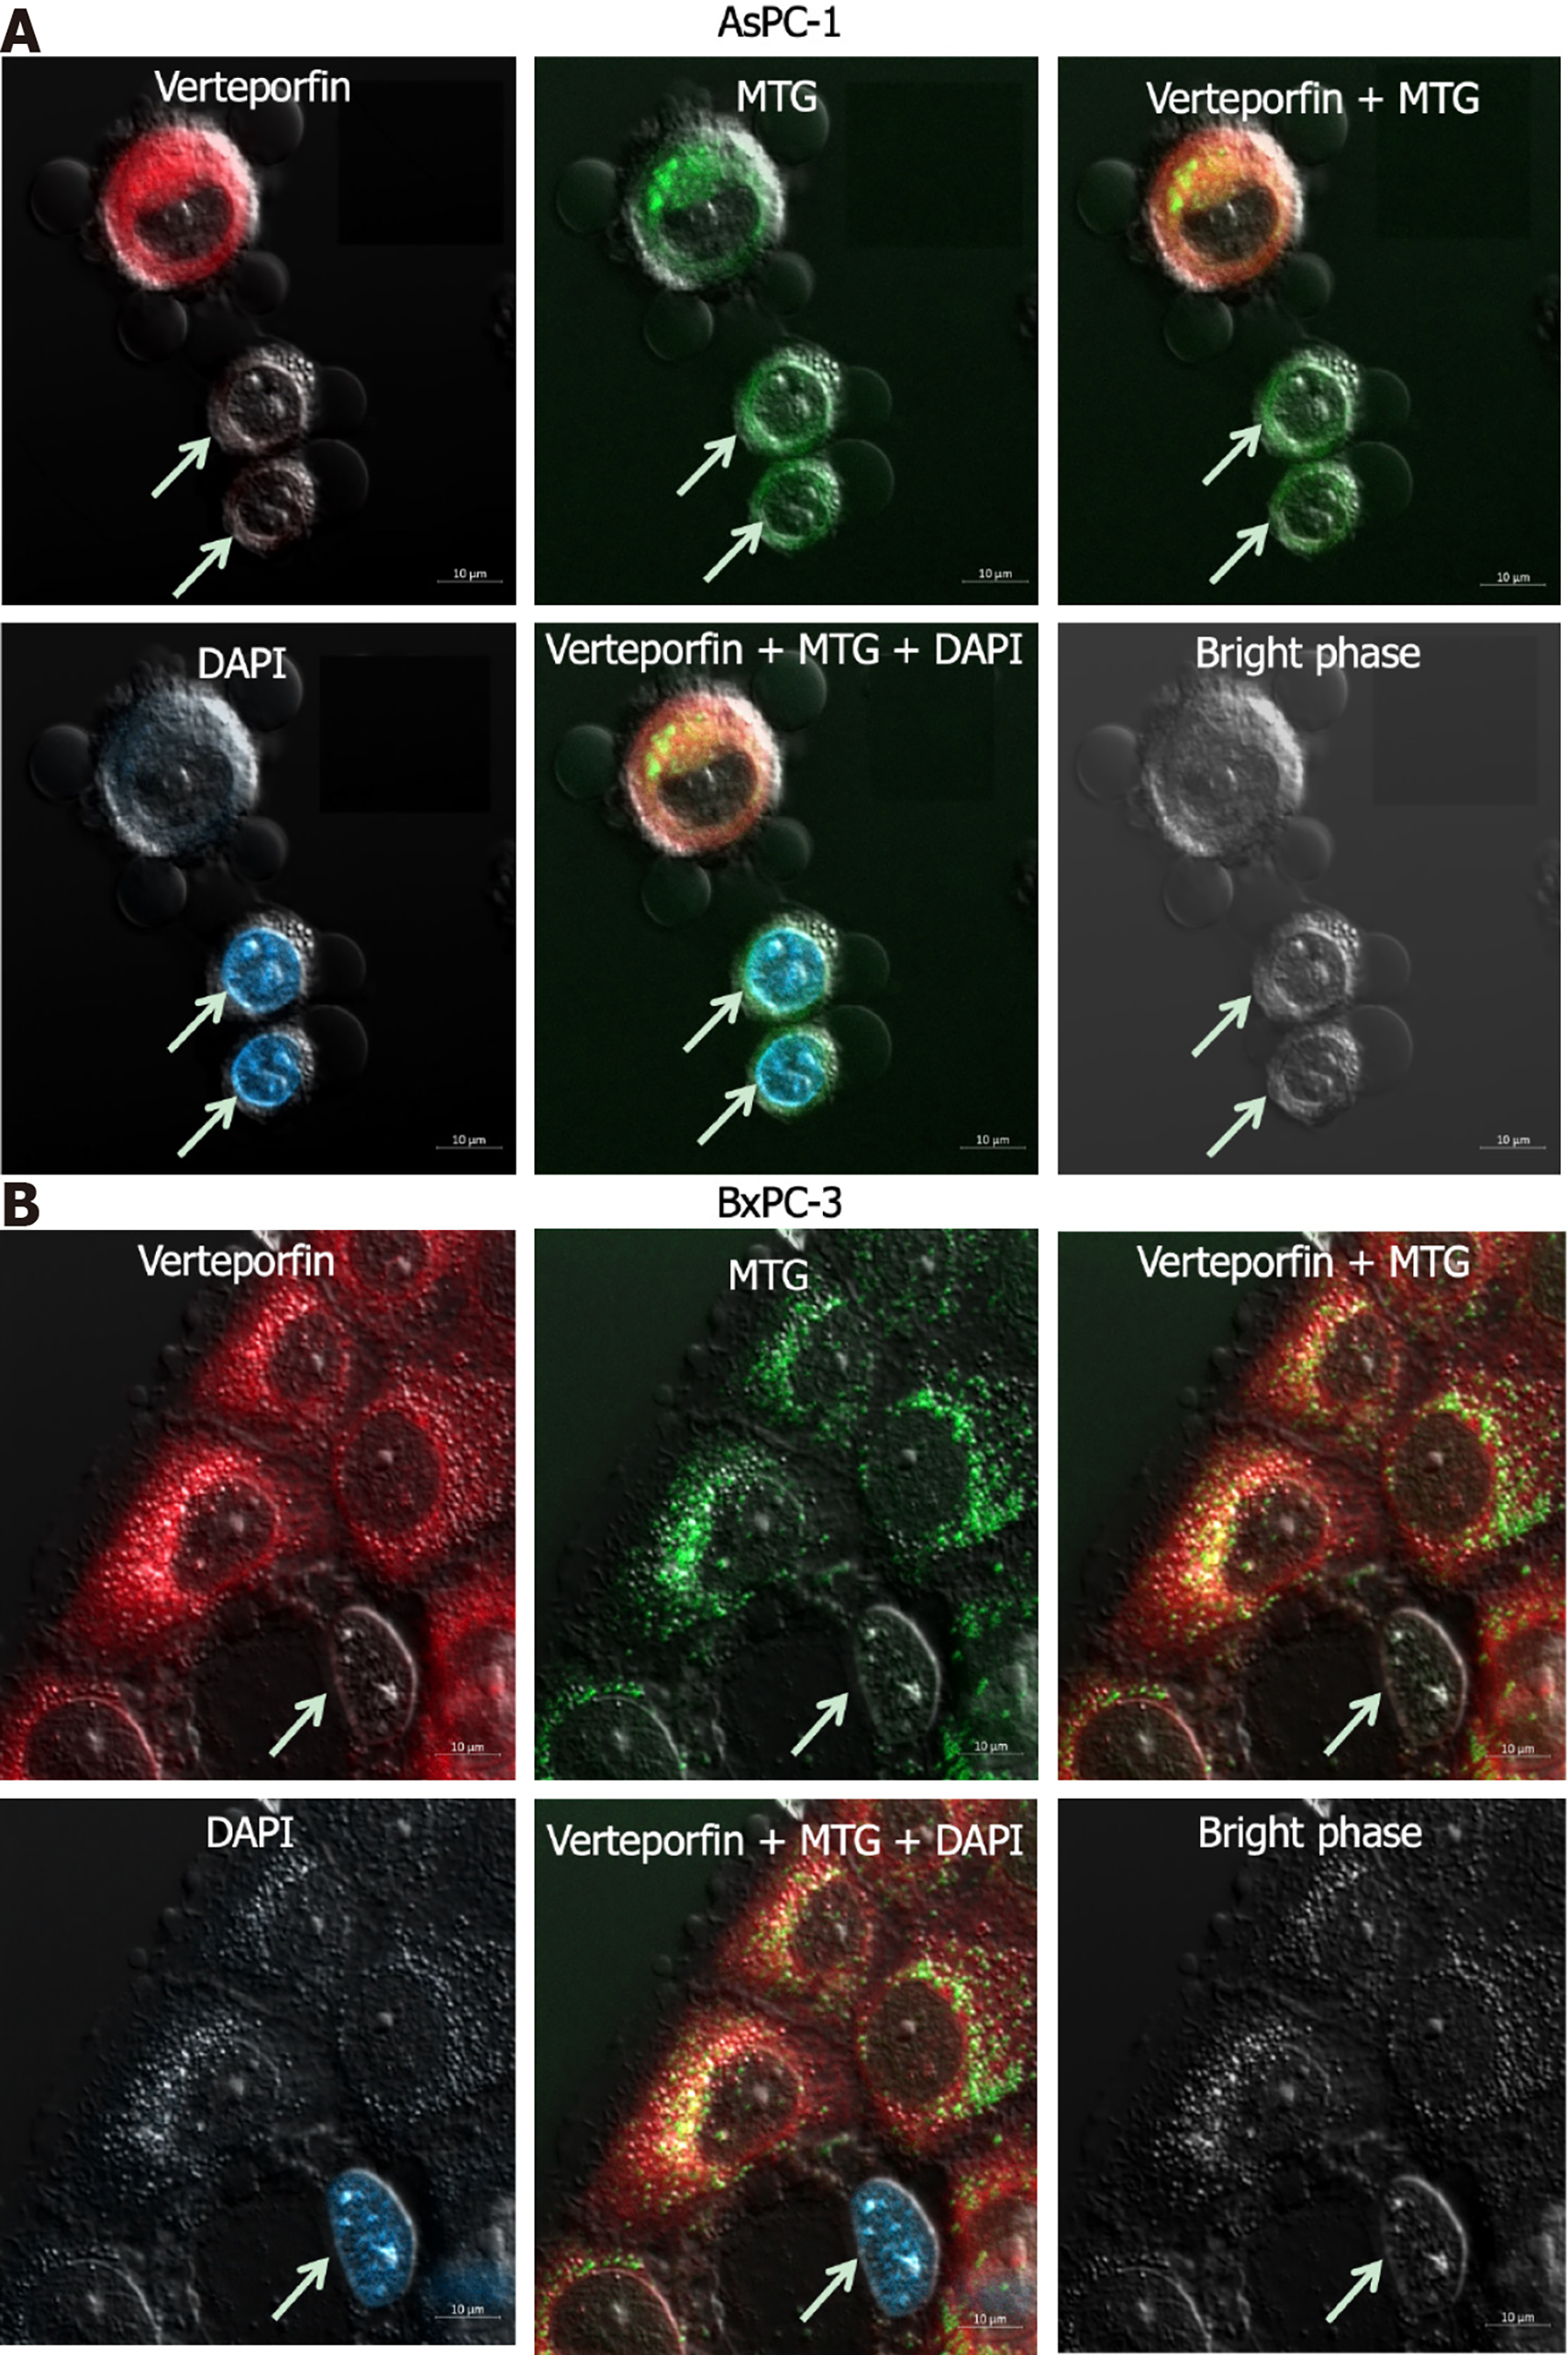
Figure 5 Fluorescence imaging of gemcitabine-treated AsPC-1 and BxPC-3 cells after staining.
A and B: After treating (A) AsPC-1 and (B) BxPC-3 cells with 30 μmol/L gemcitabine for 72 h, the cells were incubated with 1 μmol/L verteporfin for 2 h, and then co-stained with MitoTracker Green and 4’,6-diamidino-2-phenylindole. The distribution of verteporfin in cells was carefully observed by confocal laser microscope. Experiments were performed in triplicate. MTG: MitoTracker Green; DAPI: 4’,6-diamidino-2-phenylindole.
- Citation: Zhang YQ, Liu QH, Liu L, Guo PY, Wang RZ, Ba ZC. Verteporfin fluorescence in antineoplastic-treated pancreatic cancer cells found concentrated in mitochondria. World J Gastrointest Oncol 2024; 16(3): 968-978
- URL: https://www.wjgnet.com/1948-5204/full/v16/i3/968.htm
- DOI: https://dx.doi.org/10.4251/wjgo.v16.i3.968


