Copyright
©The Author(s) 2024.
World J Gastrointest Oncol. Mar 15, 2024; 16(3): 670-686
Published online Mar 15, 2024. doi: 10.4251/wjgo.v16.i3.670
Published online Mar 15, 2024. doi: 10.4251/wjgo.v16.i3.670
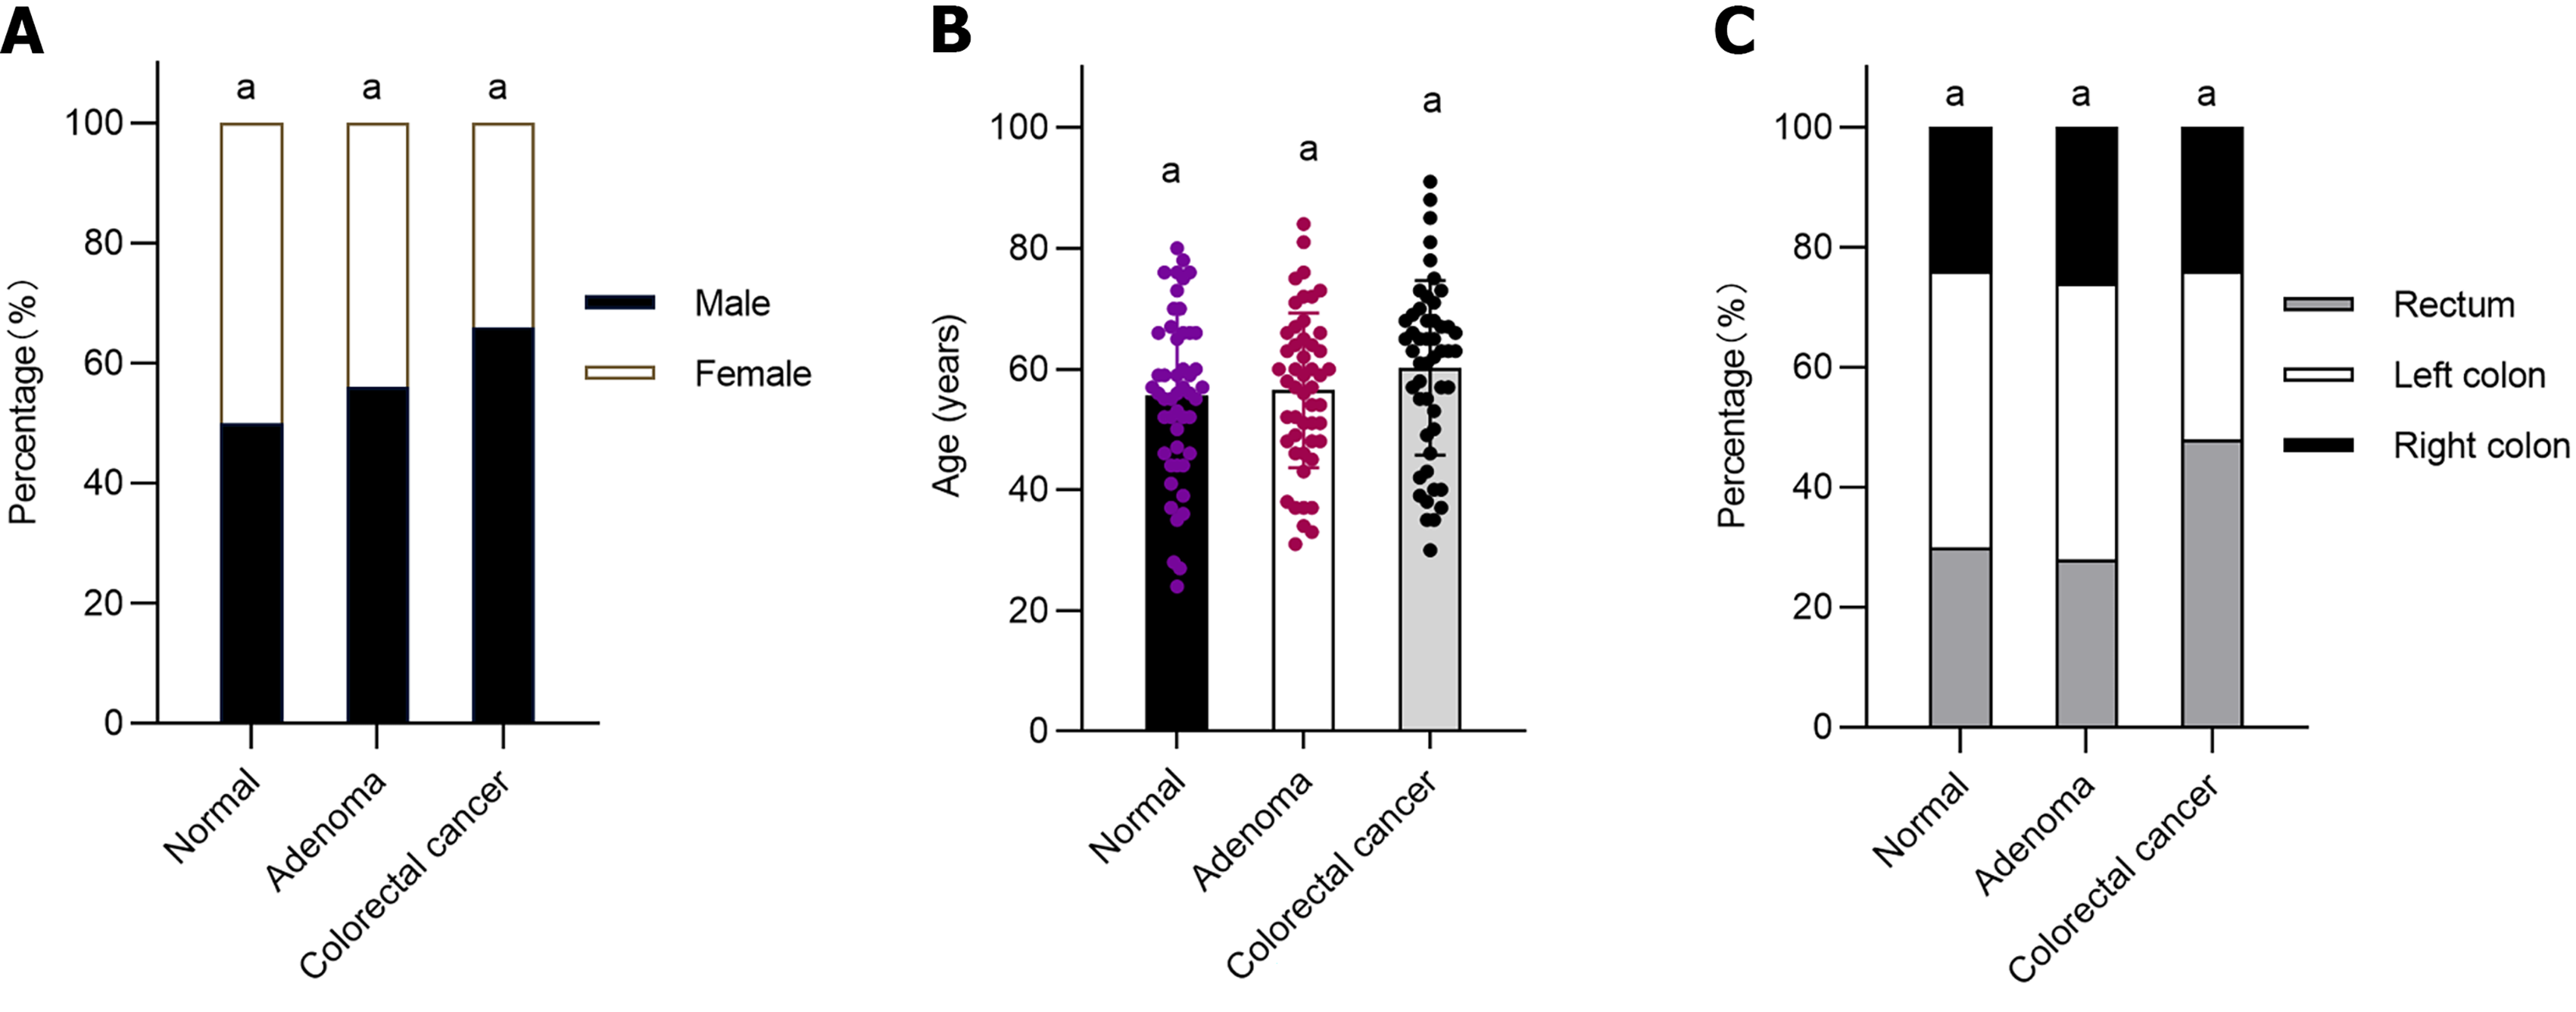
Figure 1 General data of normal control group, adenoma group and colorectal cancer group.
A: Three groups compared by gender; B: Three groups compared by age; C: Three groups compared by specimen origin. n = 50 (normal control group), n = 50 (adenoma group), n = 50 (colorectal cancer group). aP > 0.05.
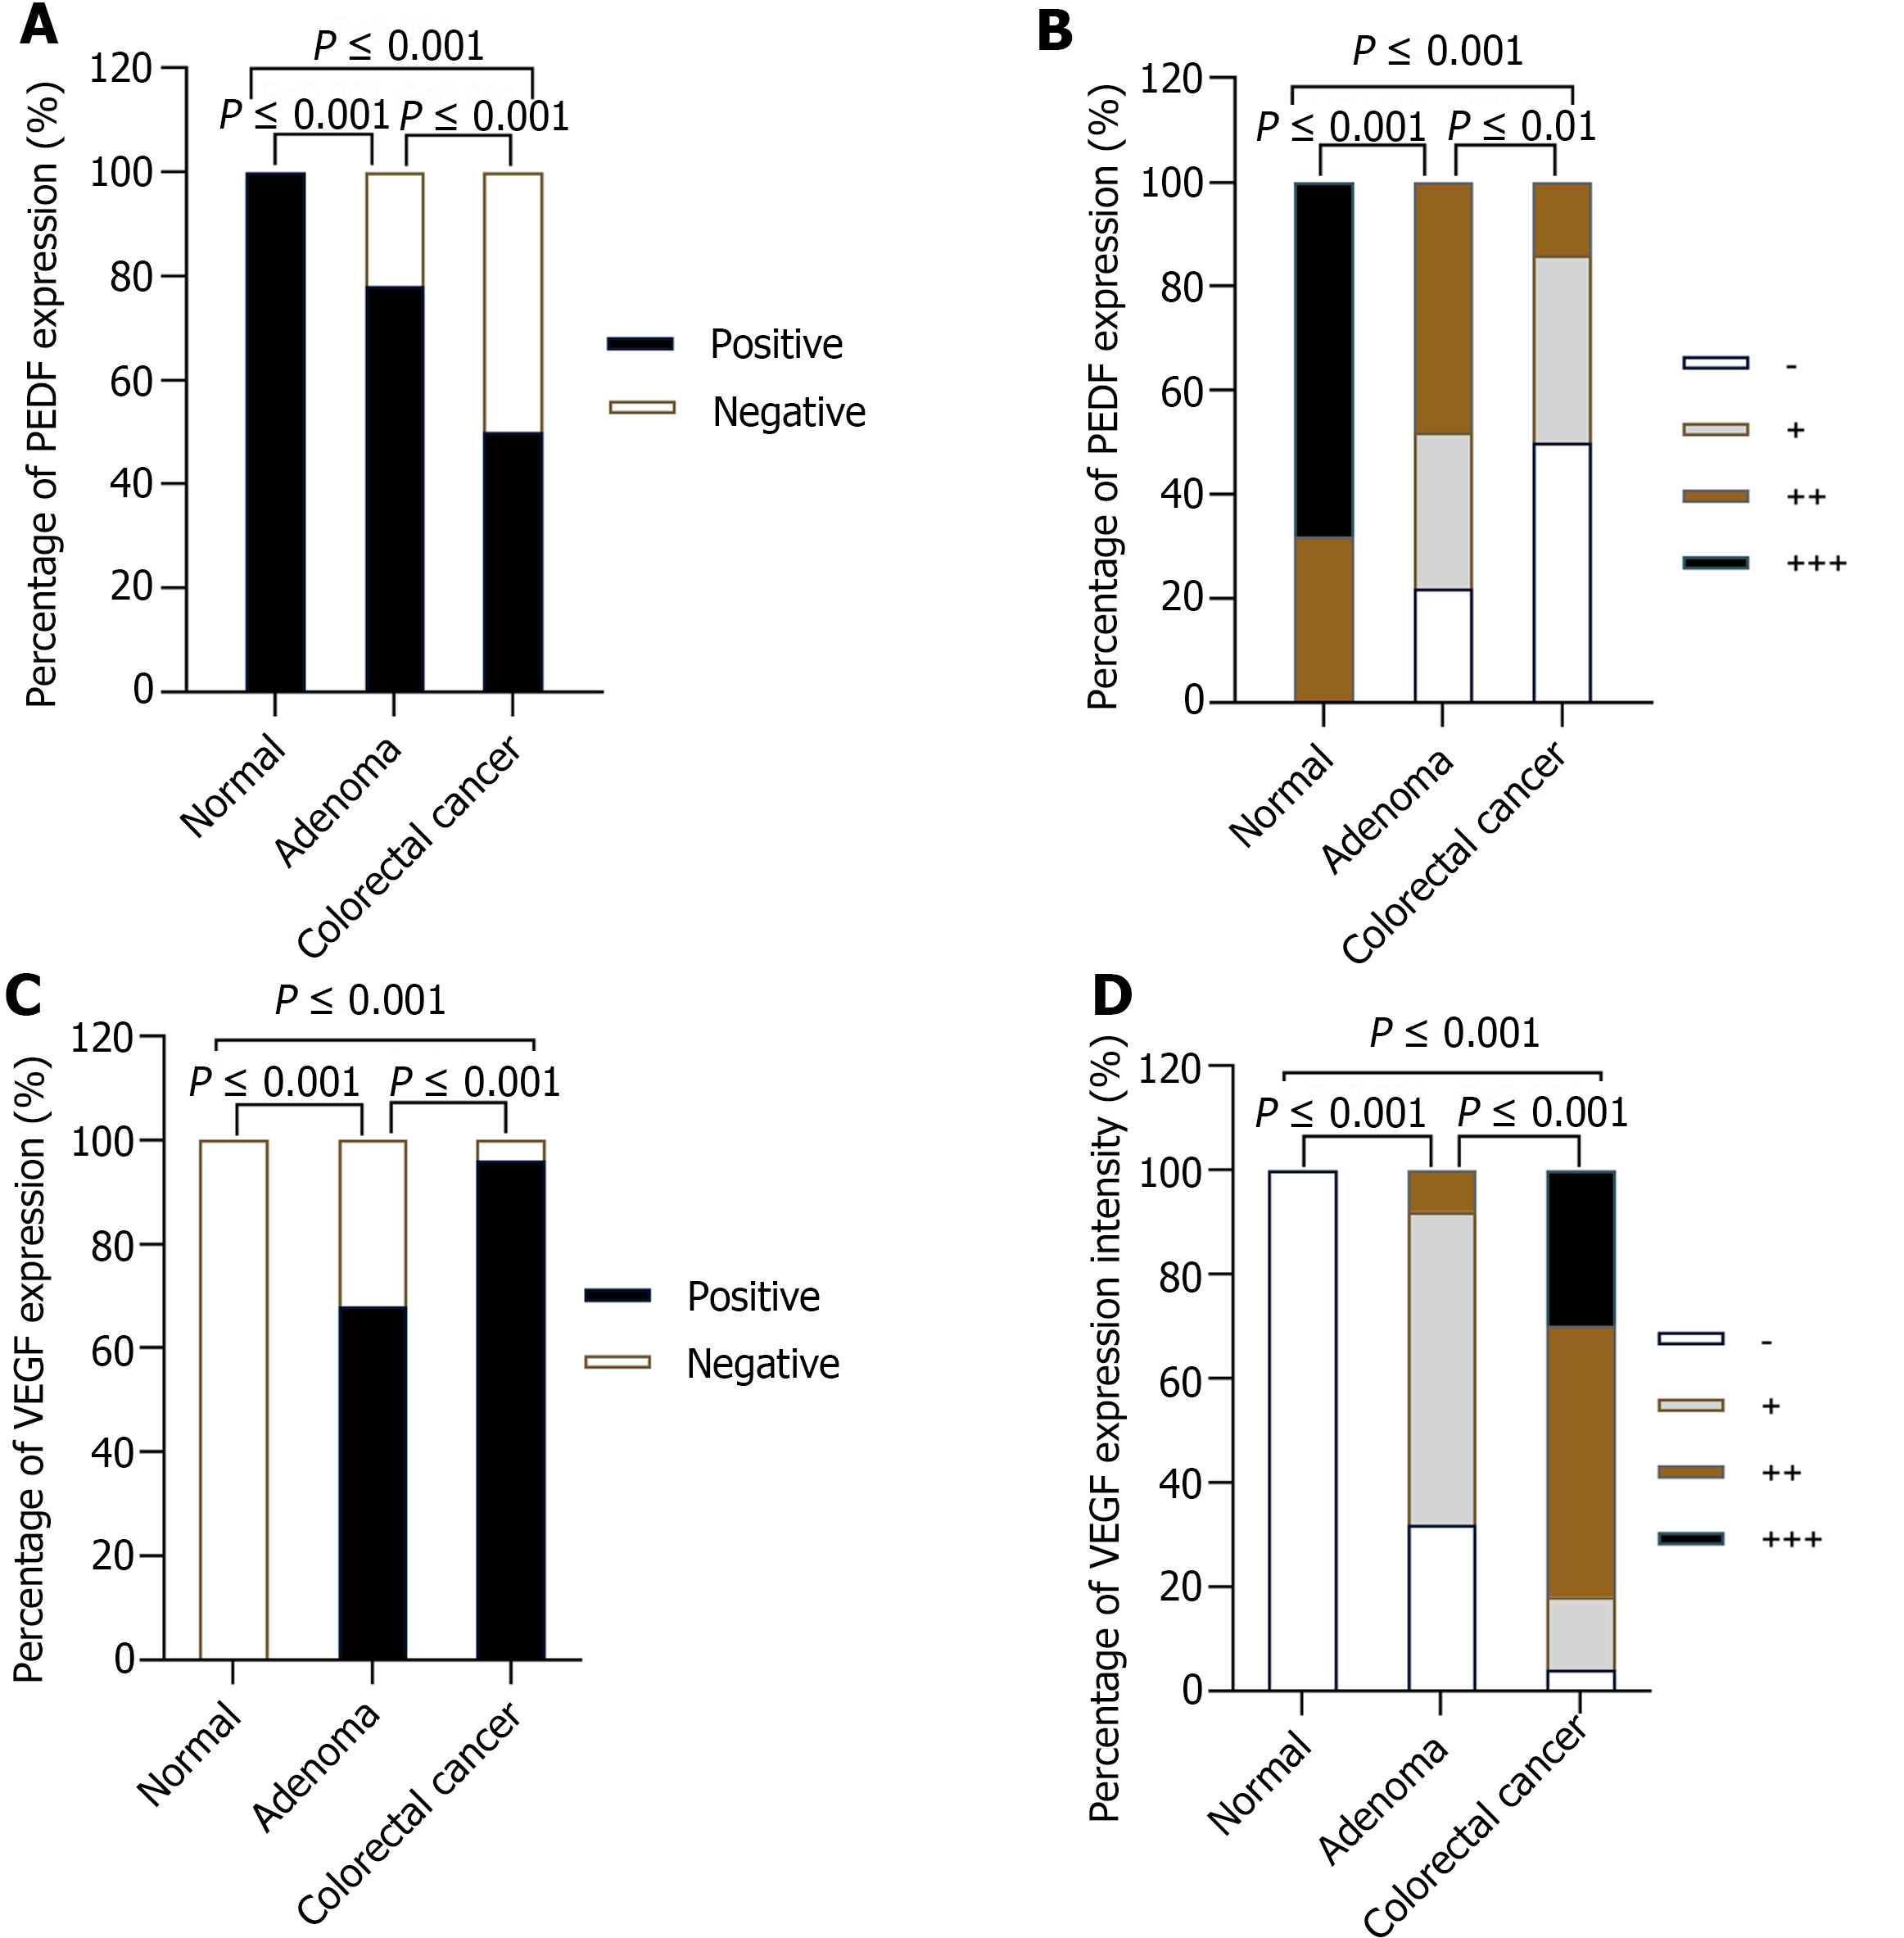
Figure 2 Comparison of positive expression rate and expression intensity of pigment epithelium-derived factors and vascular endothelial growth factors in normal control group, adenoma group and colorectal cancer group.
A: Positive expression rate of pigment epithelium-derived factors (PEDF) in the three groups; B: Expression intensity of PEDF in the three groups; C: Positive expression rate of vascular endothelial growth factors (VEGF) in the three groups; D: Expression intensity of VEGF in the three groups. n = 50 (normal control group), n = 50 (adenoma group), n = 50 (colorectal cancer group). PEDF: Pigment epithelium-derived factors; VEGF: Vascular endothelial growth factors.
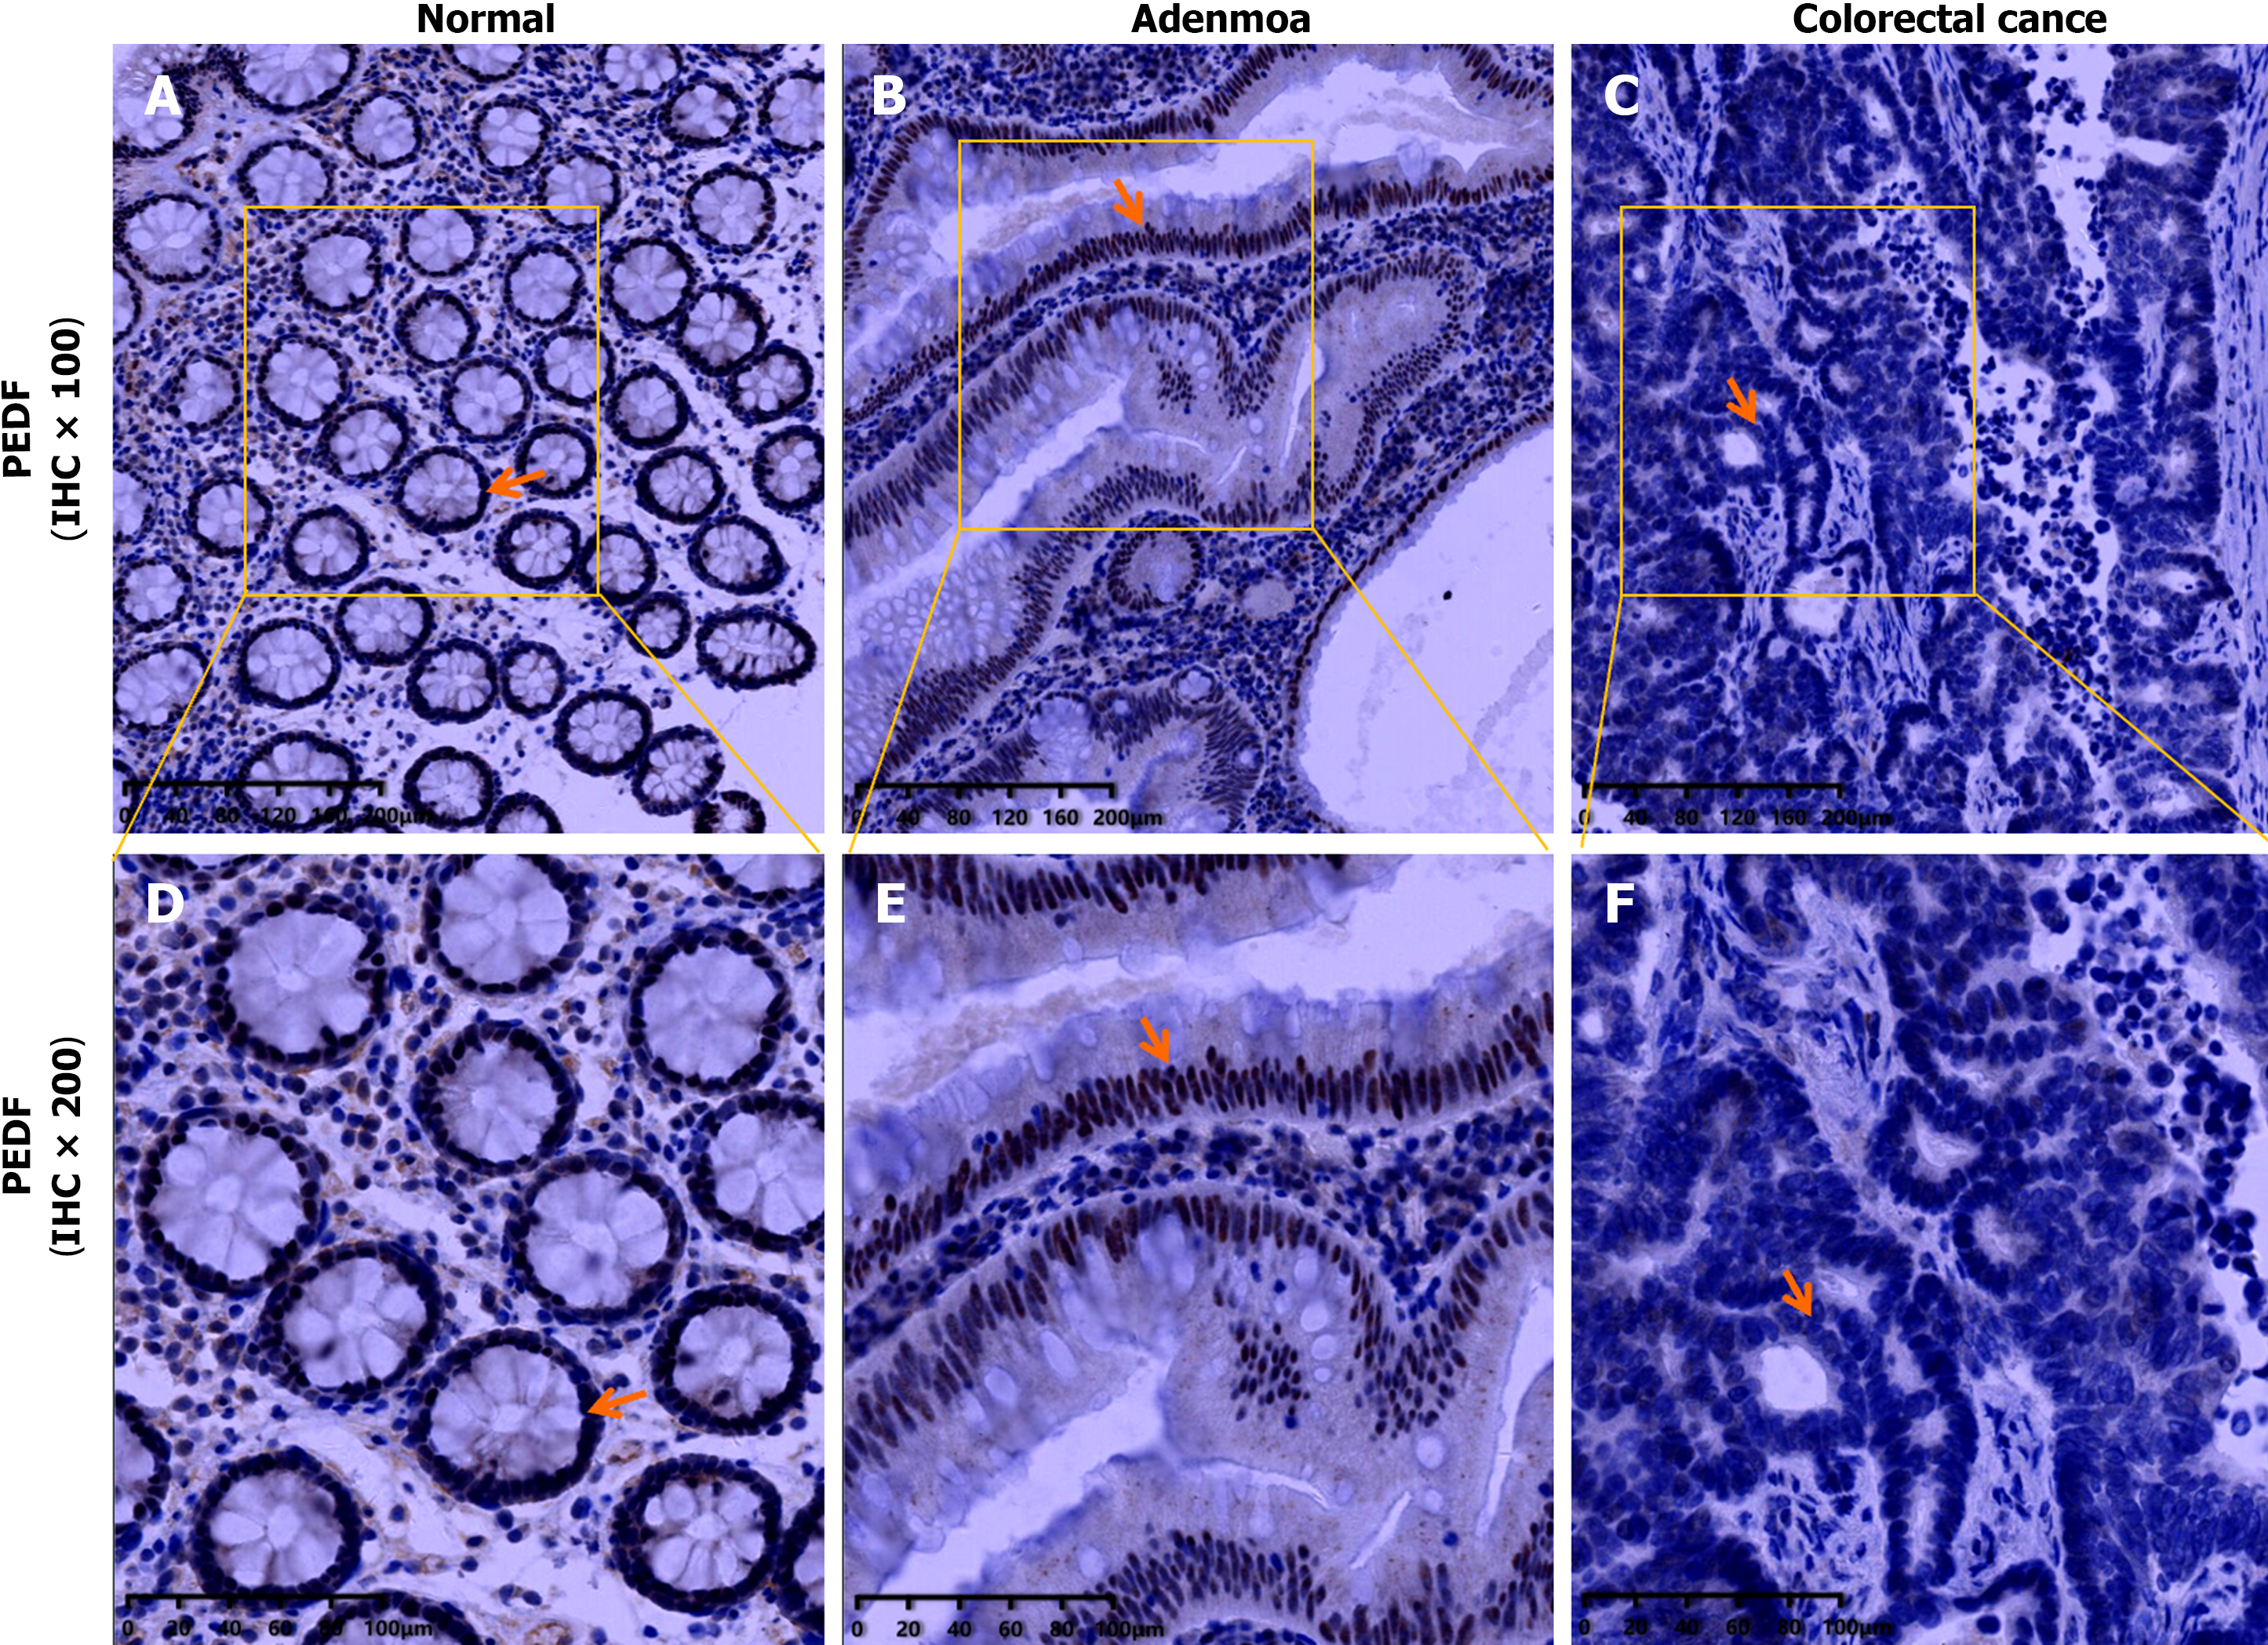
Figure 3 Immunohistochemistry of pigment epithelium-derived factors (PEDF) in three groups.
A: Pigment epithelium-derived factors (PEDF) immunohistochemistry (IHC) plot in normal group (IHC × 100); B: PEDF immunohistochemistry plot in normal group (IHC × 200). In the normal group, the nuclei of the study cells were brownish yellow, the number of positive cells was more than 75%, and the expression was strongly positive (+++); C: PEDF immunohistochemistry plot in adenoma group (IHC × 100); D: PEDF immunohistochemistry plot in adenoma group (IHC × 200). In the adenoma group, the nuclear color was mainly yellow, the number of positive cells was more than 75%, and the expression was moderately positive (++); E: PEDF immunohistochemistry plot in colorectal cancer (CRC) group (IHC × 100); F: PEDF immunohistochemistry plot in CRC group (IHC × 200). In the CRC group, the nucleus was almost uncolored, the number of positive cells was 0%, and the expression intensity was negative (-) expression. PEDF: Pigment epithelium-derived factors.
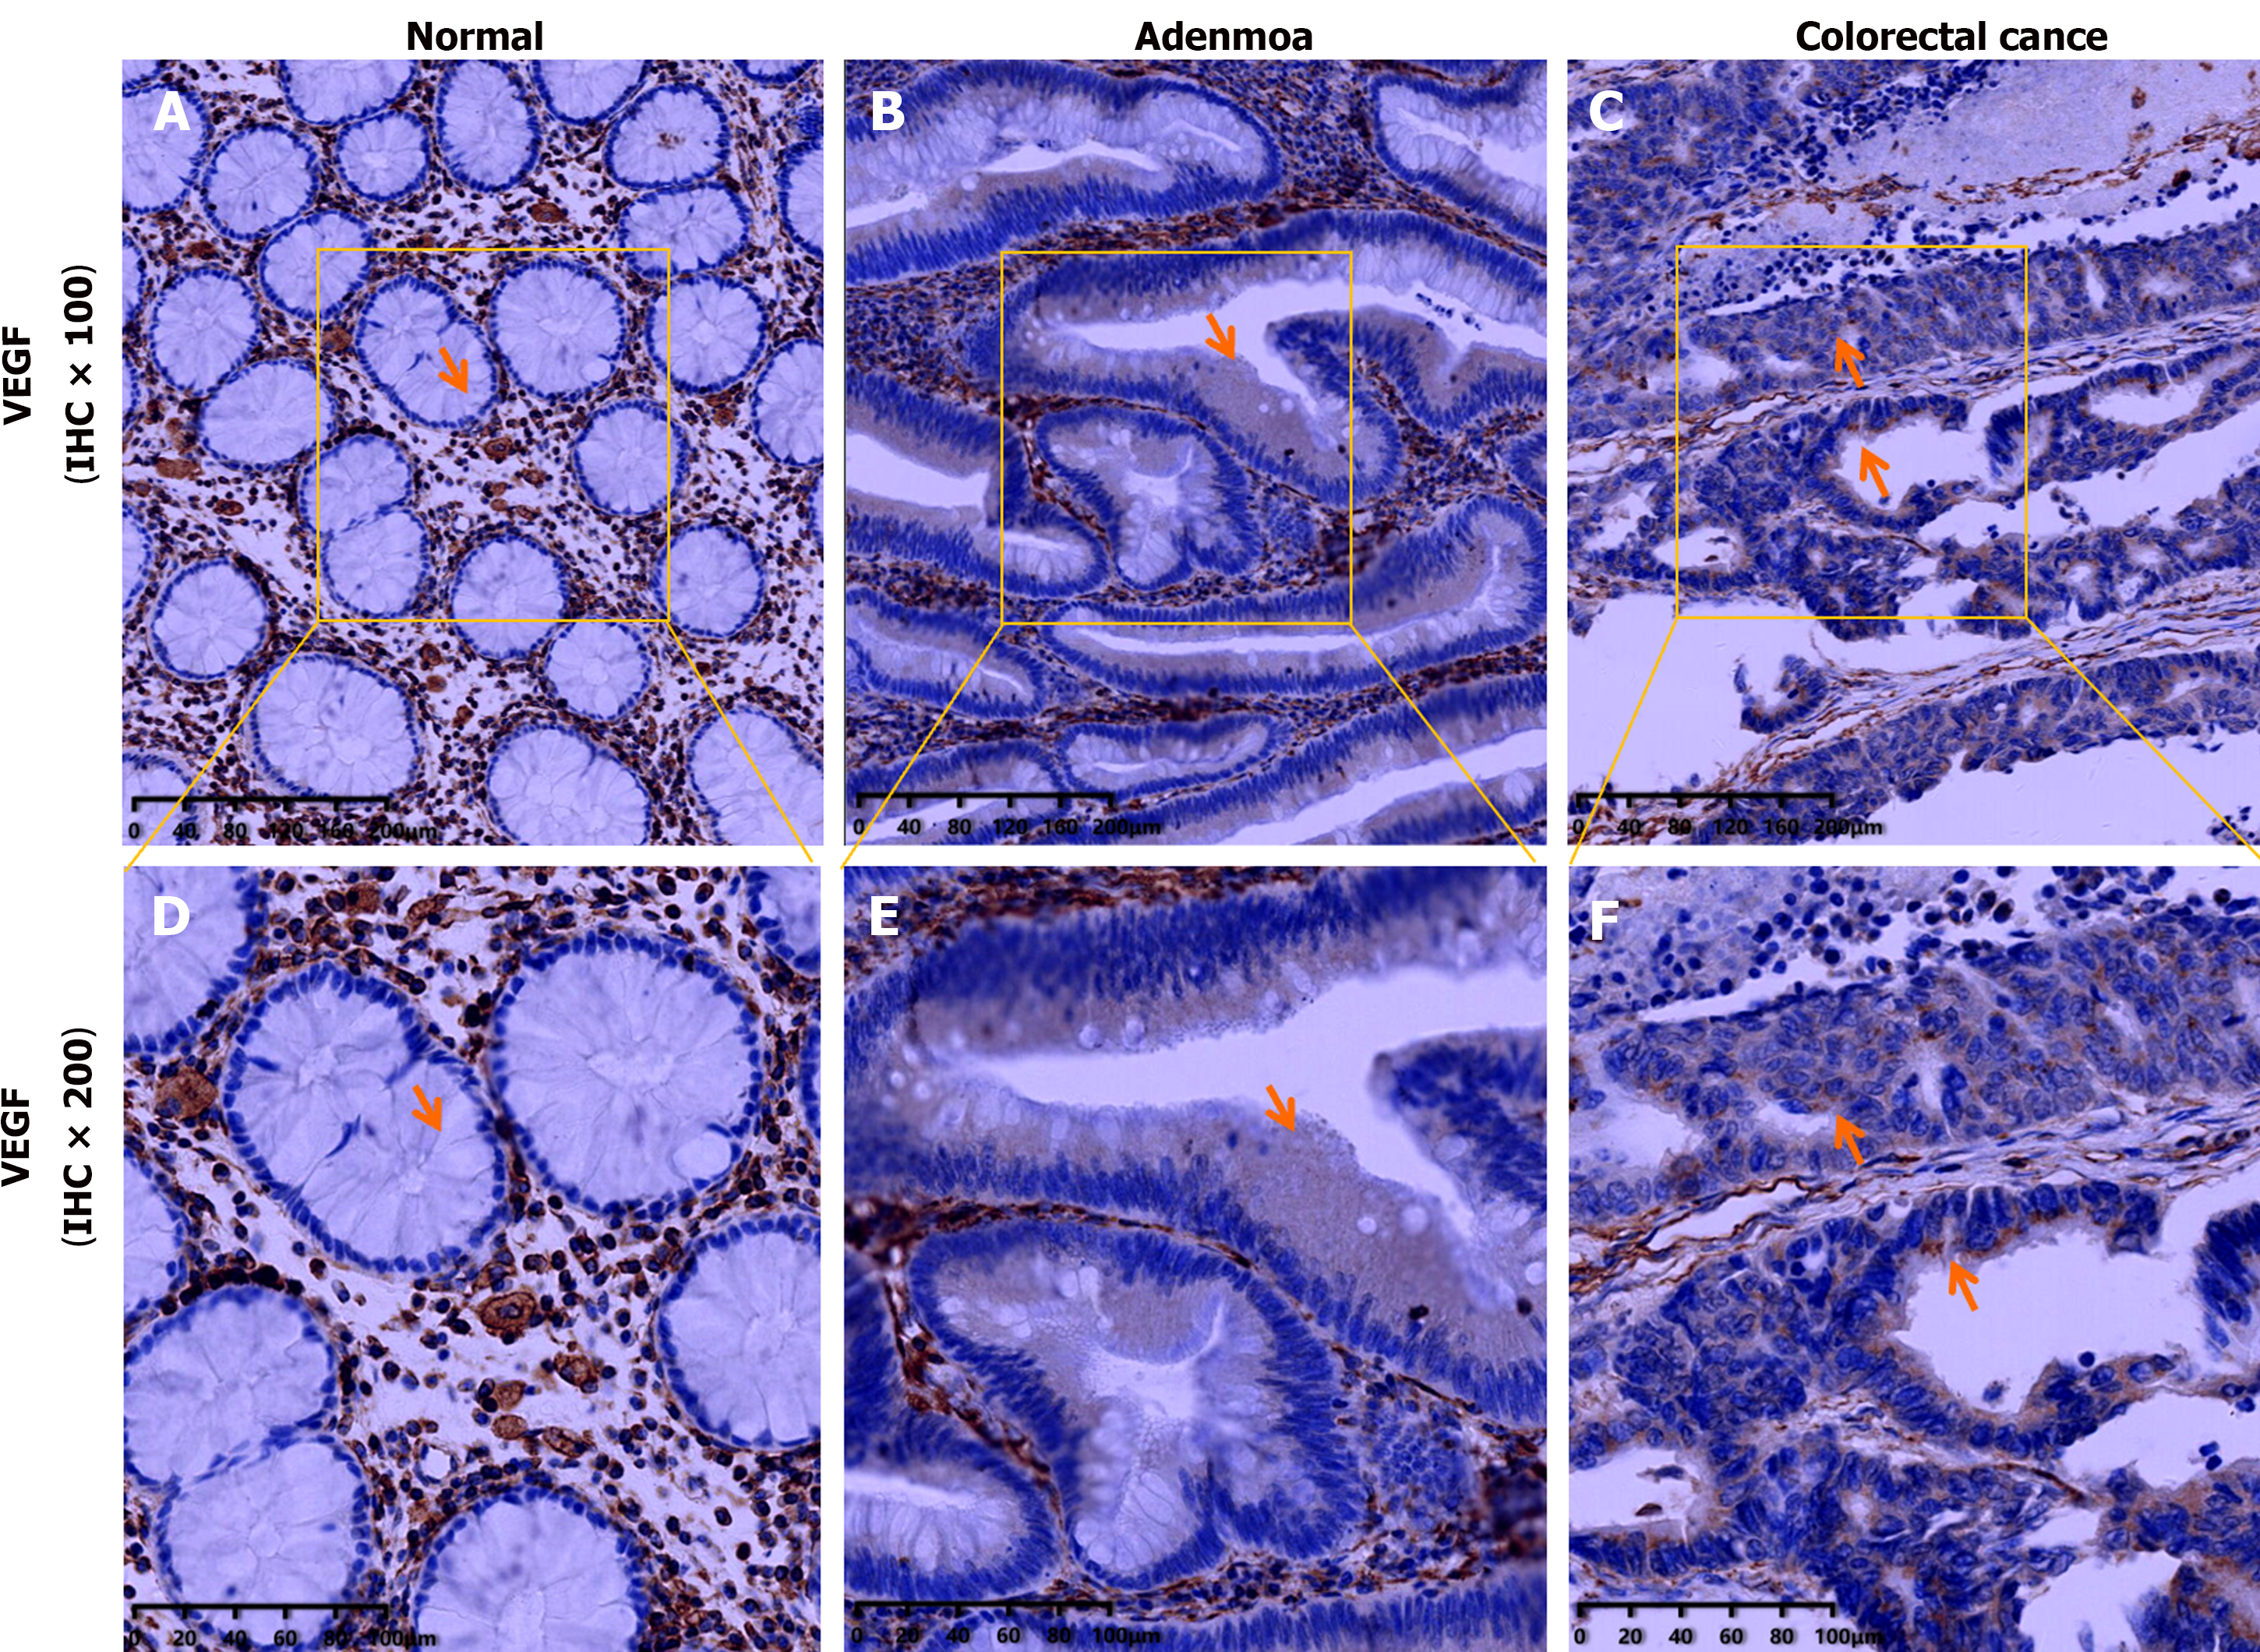
Figure 4 Immunohistochemistry of vascular endothelial growth factors in three groups.
A: Vascular endothelial growth factors (VEGF) immunohistochemistry (IHC) plot in normal group (IHC × 100); B: VEGF immunohistochemistry plot in normal group (IHC × 200). In the normal group, the cytoplasm of the study cells was not colored and showed negative (-) expression; C: VEGF immunohistochemistry plot in adenoma group (IHC × 100); D: VEGF immunohistochemistry plot in adenoma group (IHC × 200). In the adenoma group, the cytoplasm was light yellow, the number of positive cells was more than 75%, and the expression was weak positive (+); E: VEGF immunohistochemistry plot in colorectal cancer (CRC) group (IHC × 100); F: VEGF immunohistochemistry plot in CRC group (IHC × 200). In the CRC group, the cytoplasm was expressed in yellow fine particles on the surface of the tumor cell cavity, and the number of positive cells was greater than 75%, showing moderately positive (++) expression. Note: In the normal group, adenoma group and CRC group, the expression of brown or yellow was widely seen in the colorectal stromal cells and vascular endothelial cells, which was used as a positive internal control. VEGF: Vascular endothelial growth factors.
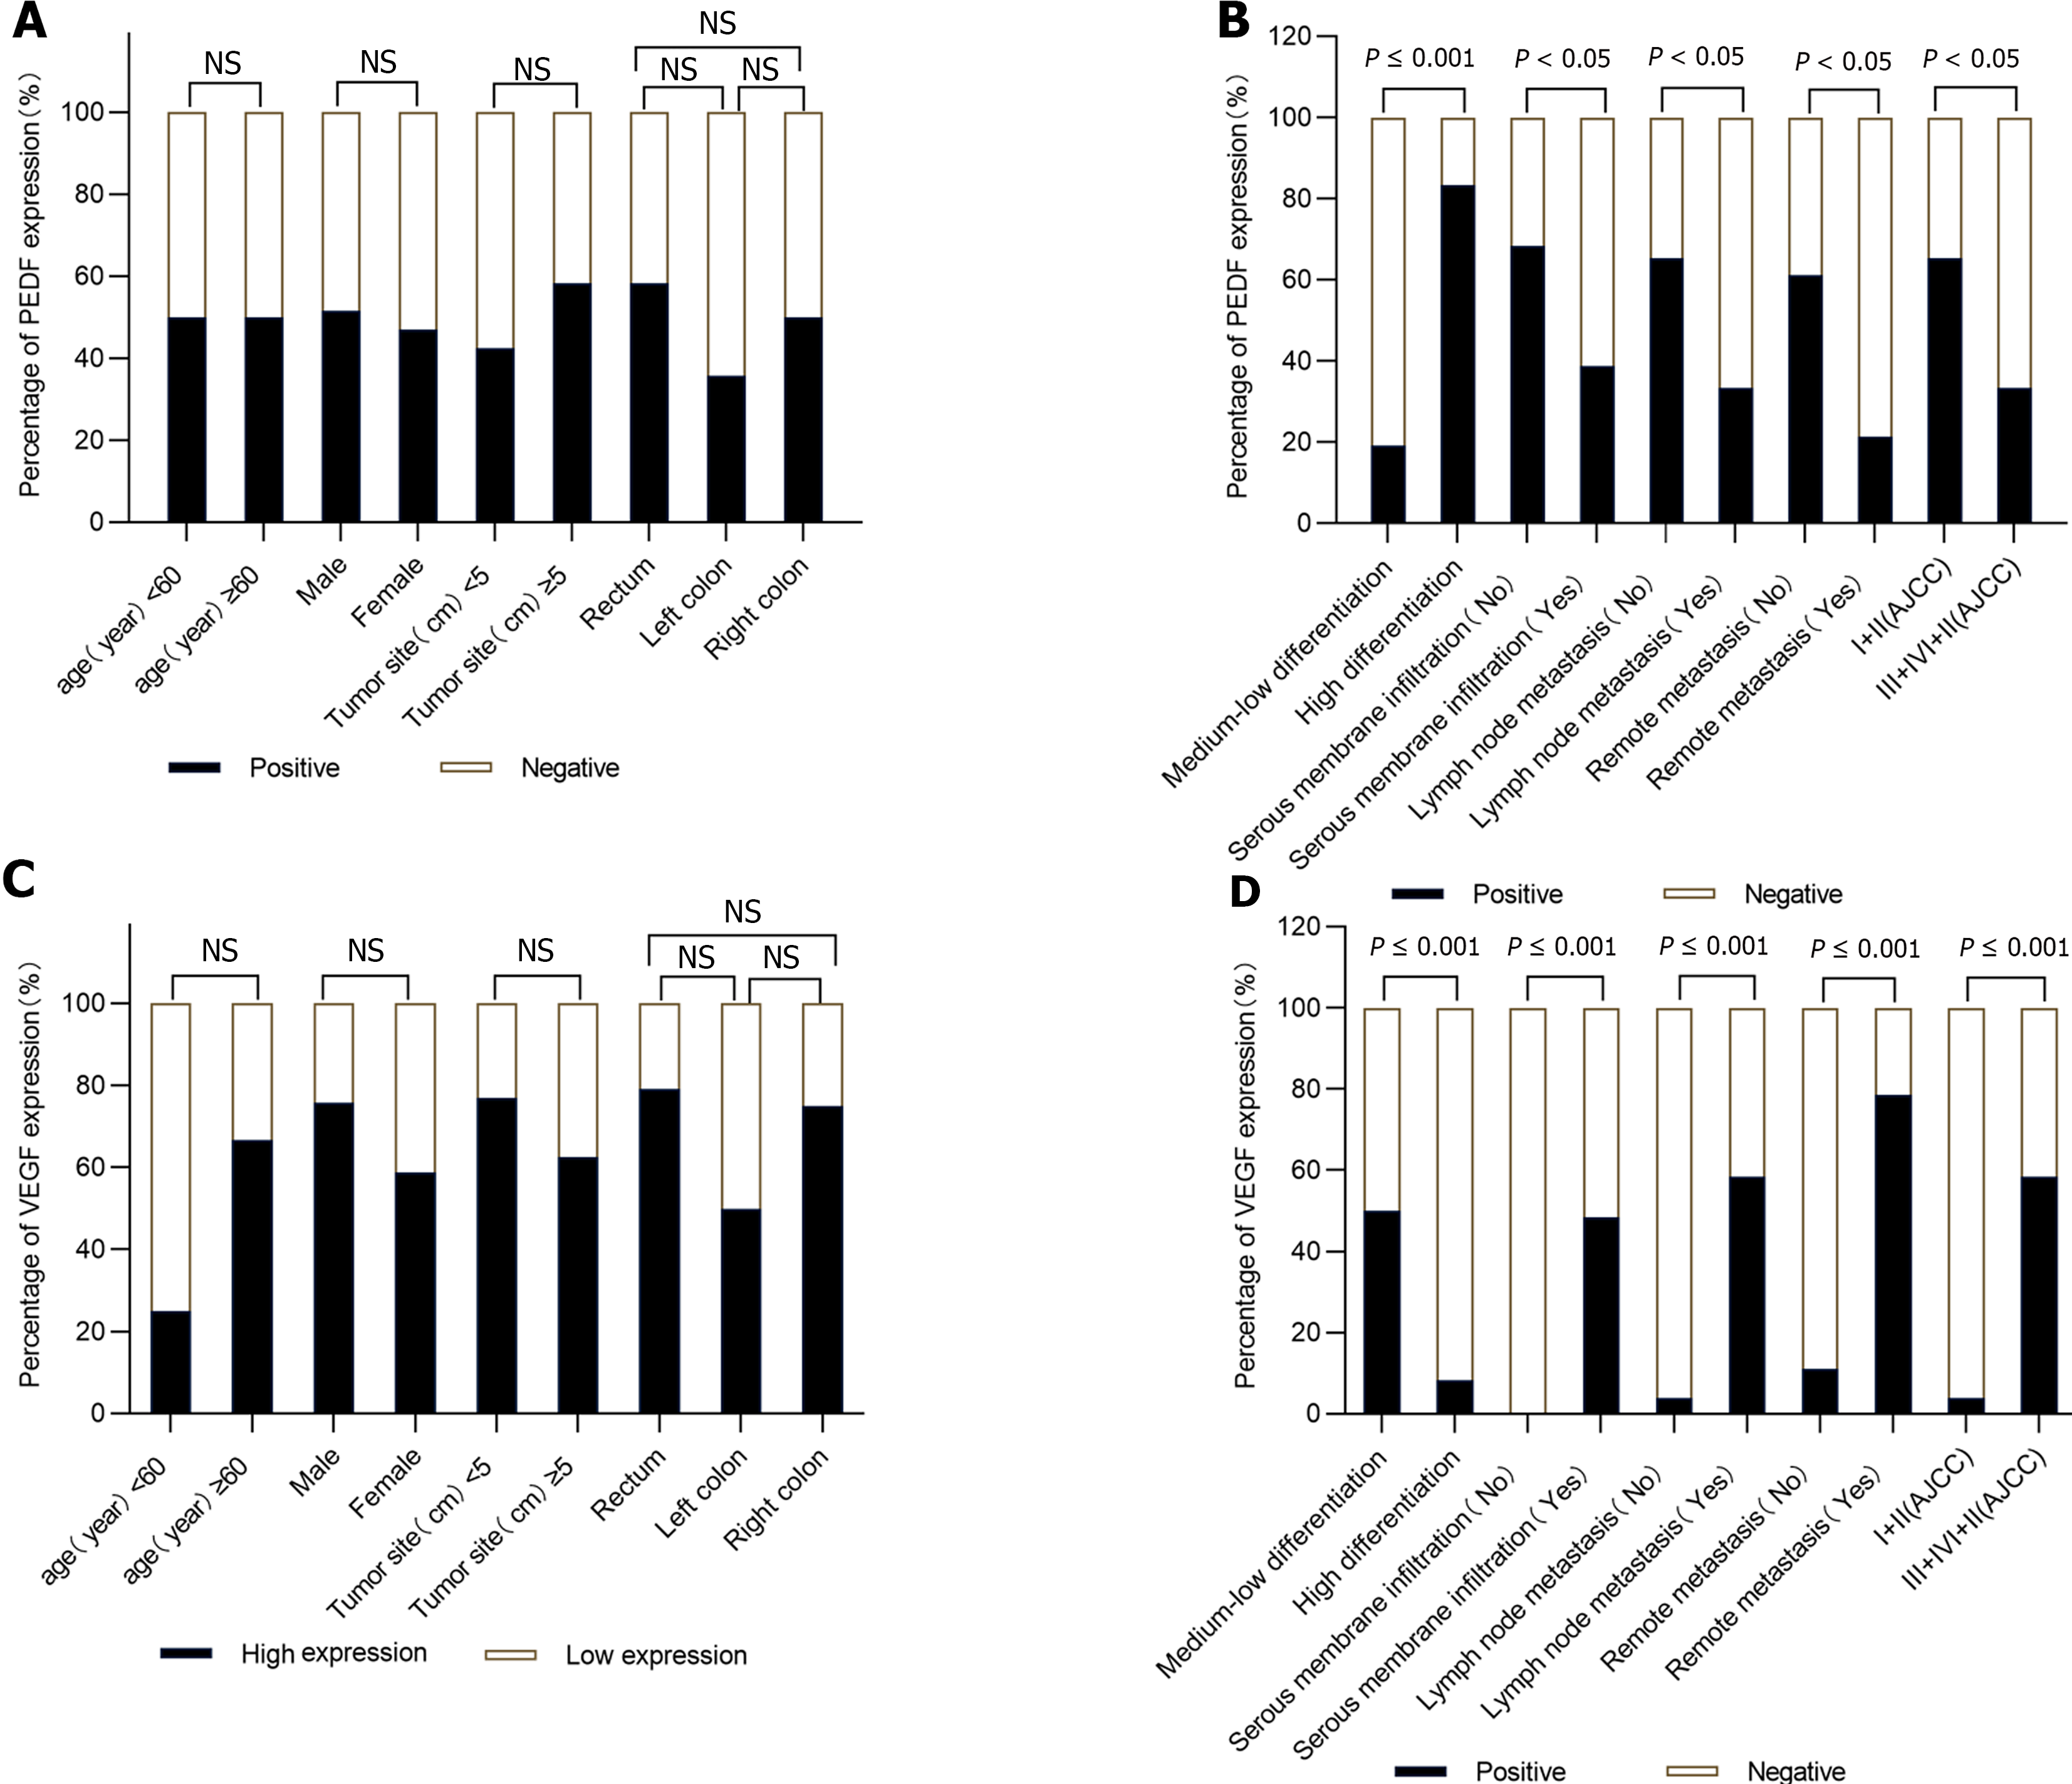
Figure 5 The relationship between the expression of pigment epithelium-derived factors and vascular endothelial growth factors with clinical parameters in colorectal cancer group.
A: The relationship between positive expression rate of pigment epithelium-derived factors (PEDF) and age, gender, tumor size, and tumor location in colorectal cancer (CRC) group; B: The relationship between high expression rate of vascular endothelial growth factors (VEGF) and age, gender, tumor size, and tumor location in CRC group; C: The relationship between positive expression rate of PEDF and tumor differentiation, serous membrane infiltration, lymph node metastasis, remote metastasis and staging tumors in CRC group; D: The relationship between high expression rate of VEGF and tumor differentiation, serous membrane infiltration, lymph node metastasis, remote metastasis and staging tumors in CRC group. High expression: +++; Low expression: -~++; n = 50 (CRC group), NS: P ≥ 0.05. PEDF: Pigment epithelium-derived factors; VEGF: Vascular endothelial growth factors.
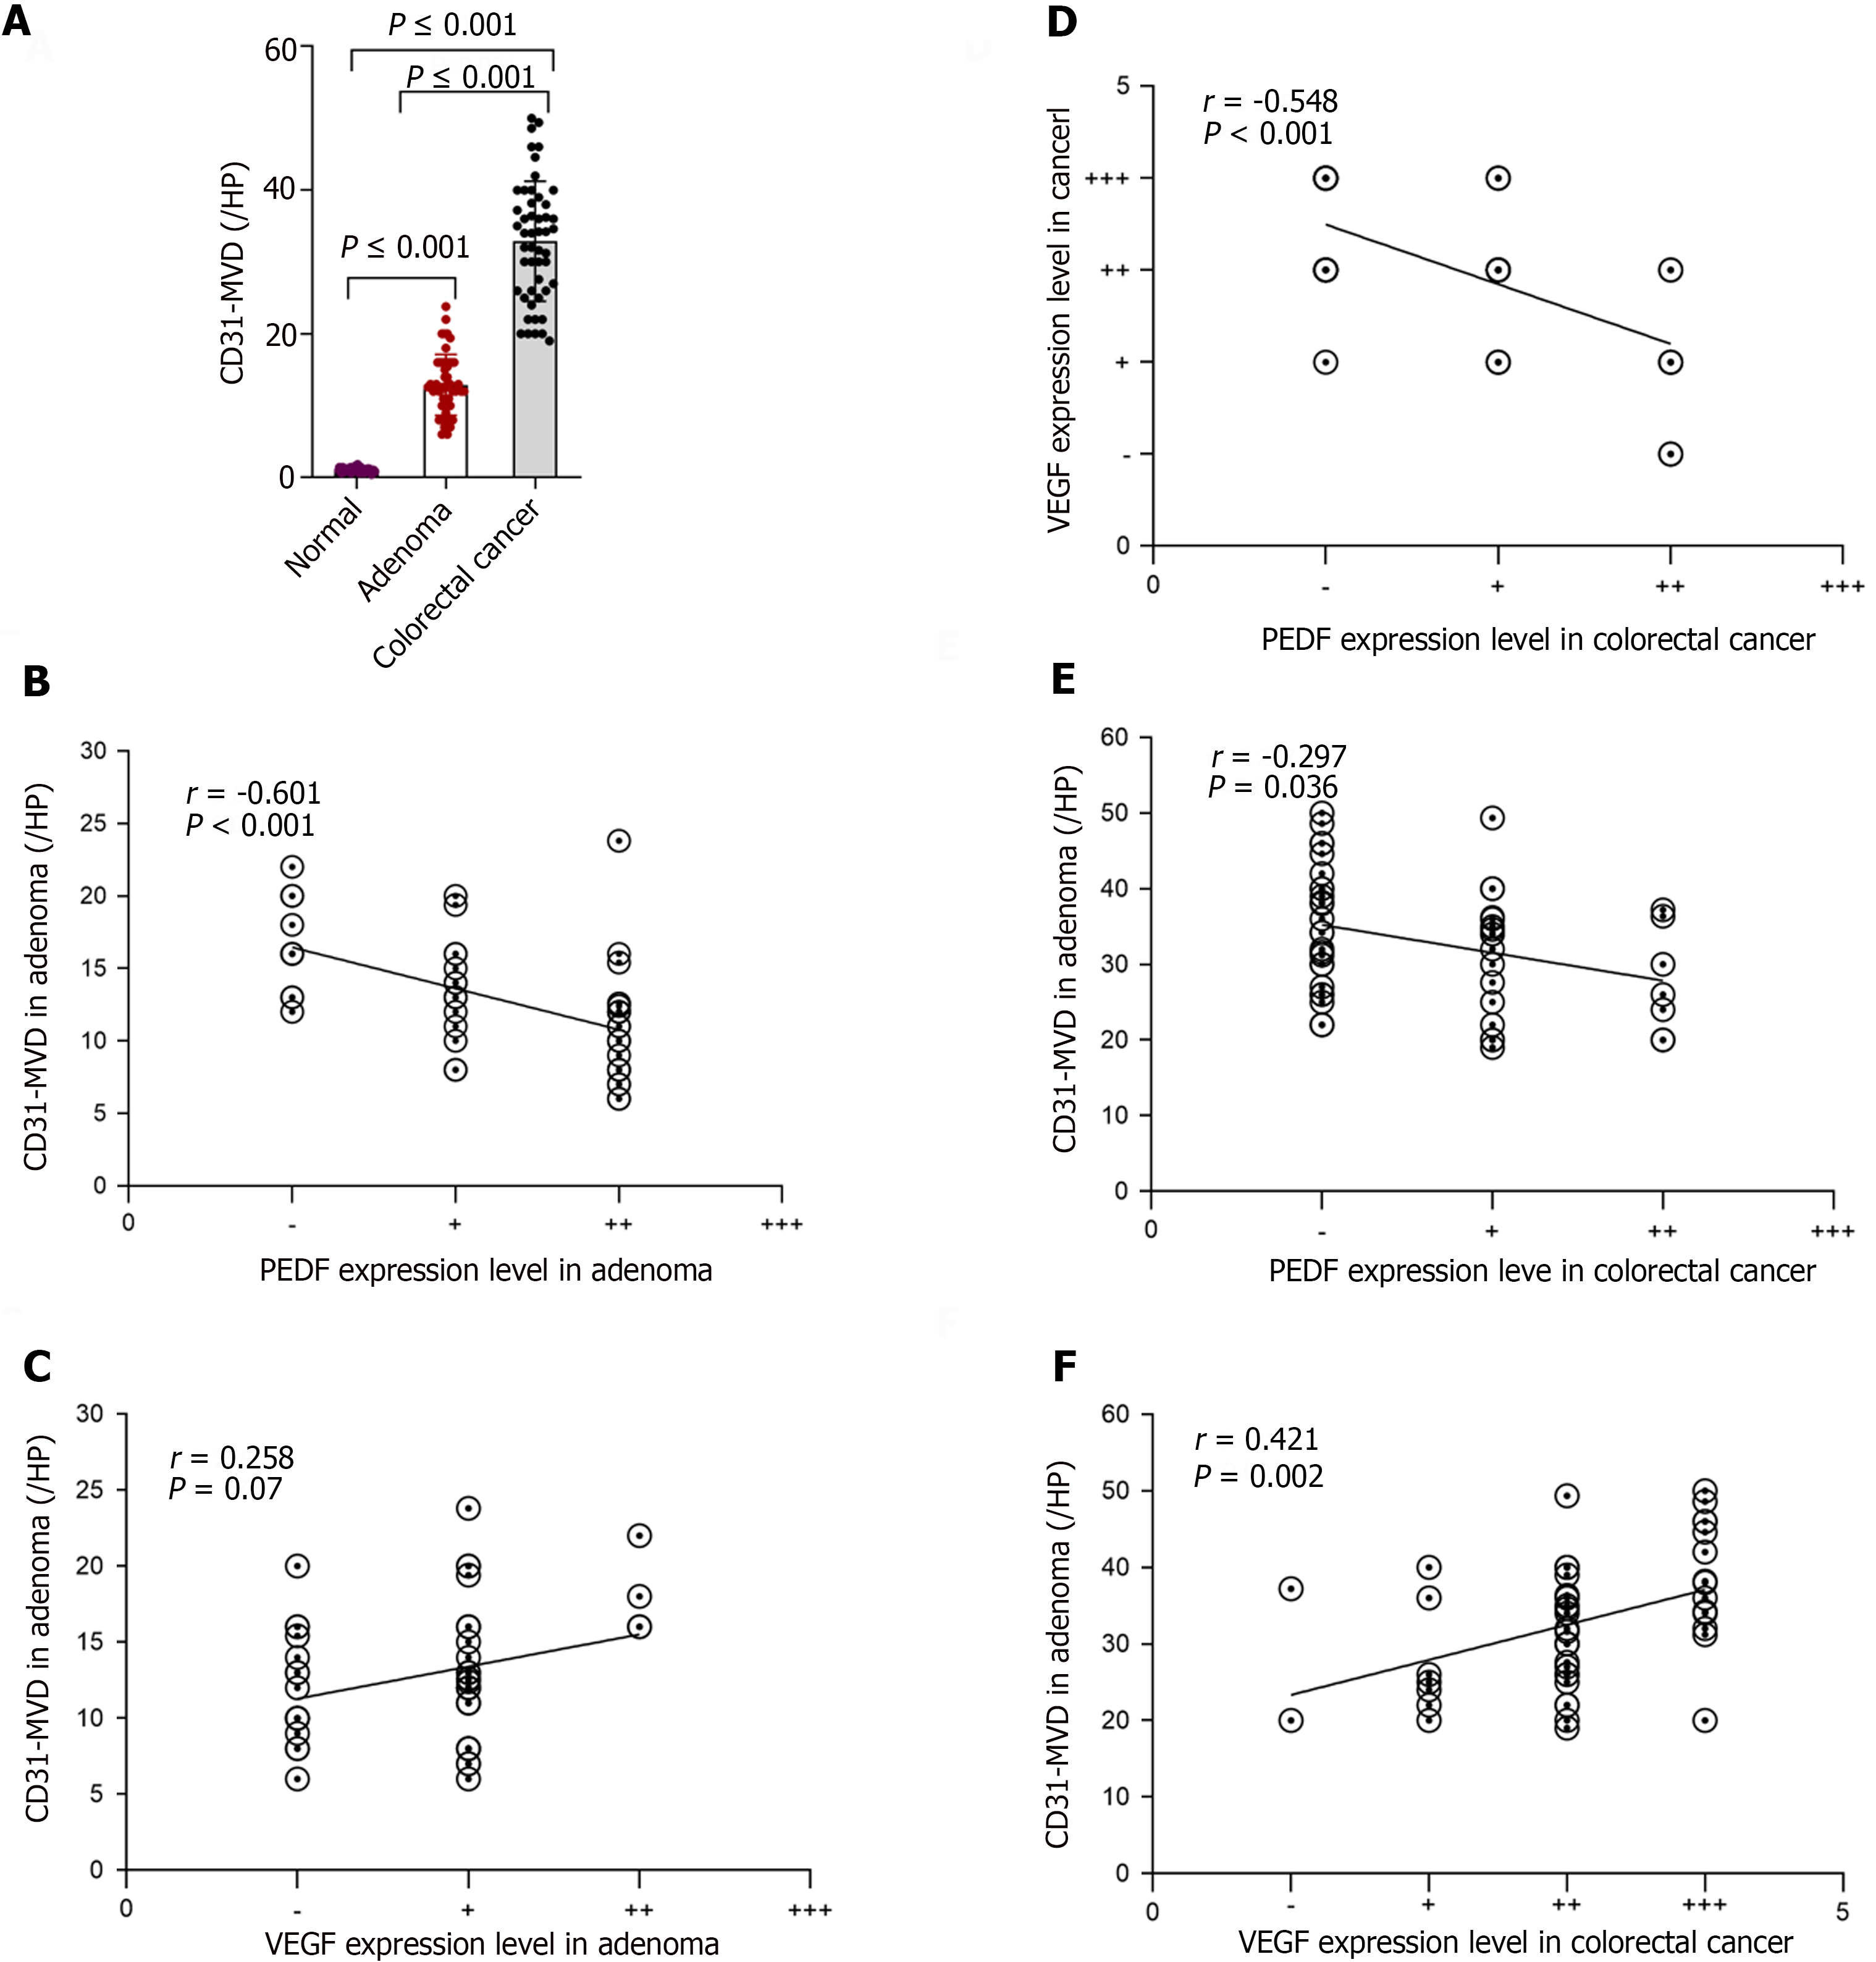
Figure 6 CD31-stained microvessel density values and correlation analysis.
A: Difference of CD31-stained microvessel density values (CD31-MVD) value in normal group, adenoma group, and colorectal cancer (CRC) group; B: Correlation between pigment epithelium-derived factors (PEDF) and CD31-MVD value in adenoma group; C: Correlation between vascular endothelial growth factors (VEGF) and CD31-MVD value in adenoma group; D: Correlation between PEDF and VEGF in CRC group; E: CRC group Association between PEDF and CD31-MVD value in CRC; F: Association between VEGF and CD31-MVD value in CRC. CD31-MVD: CD31-stained microvessel density values; PEDF: Pigment epithelium-derived factors; VEGF: Vascular endothelial growth factors.
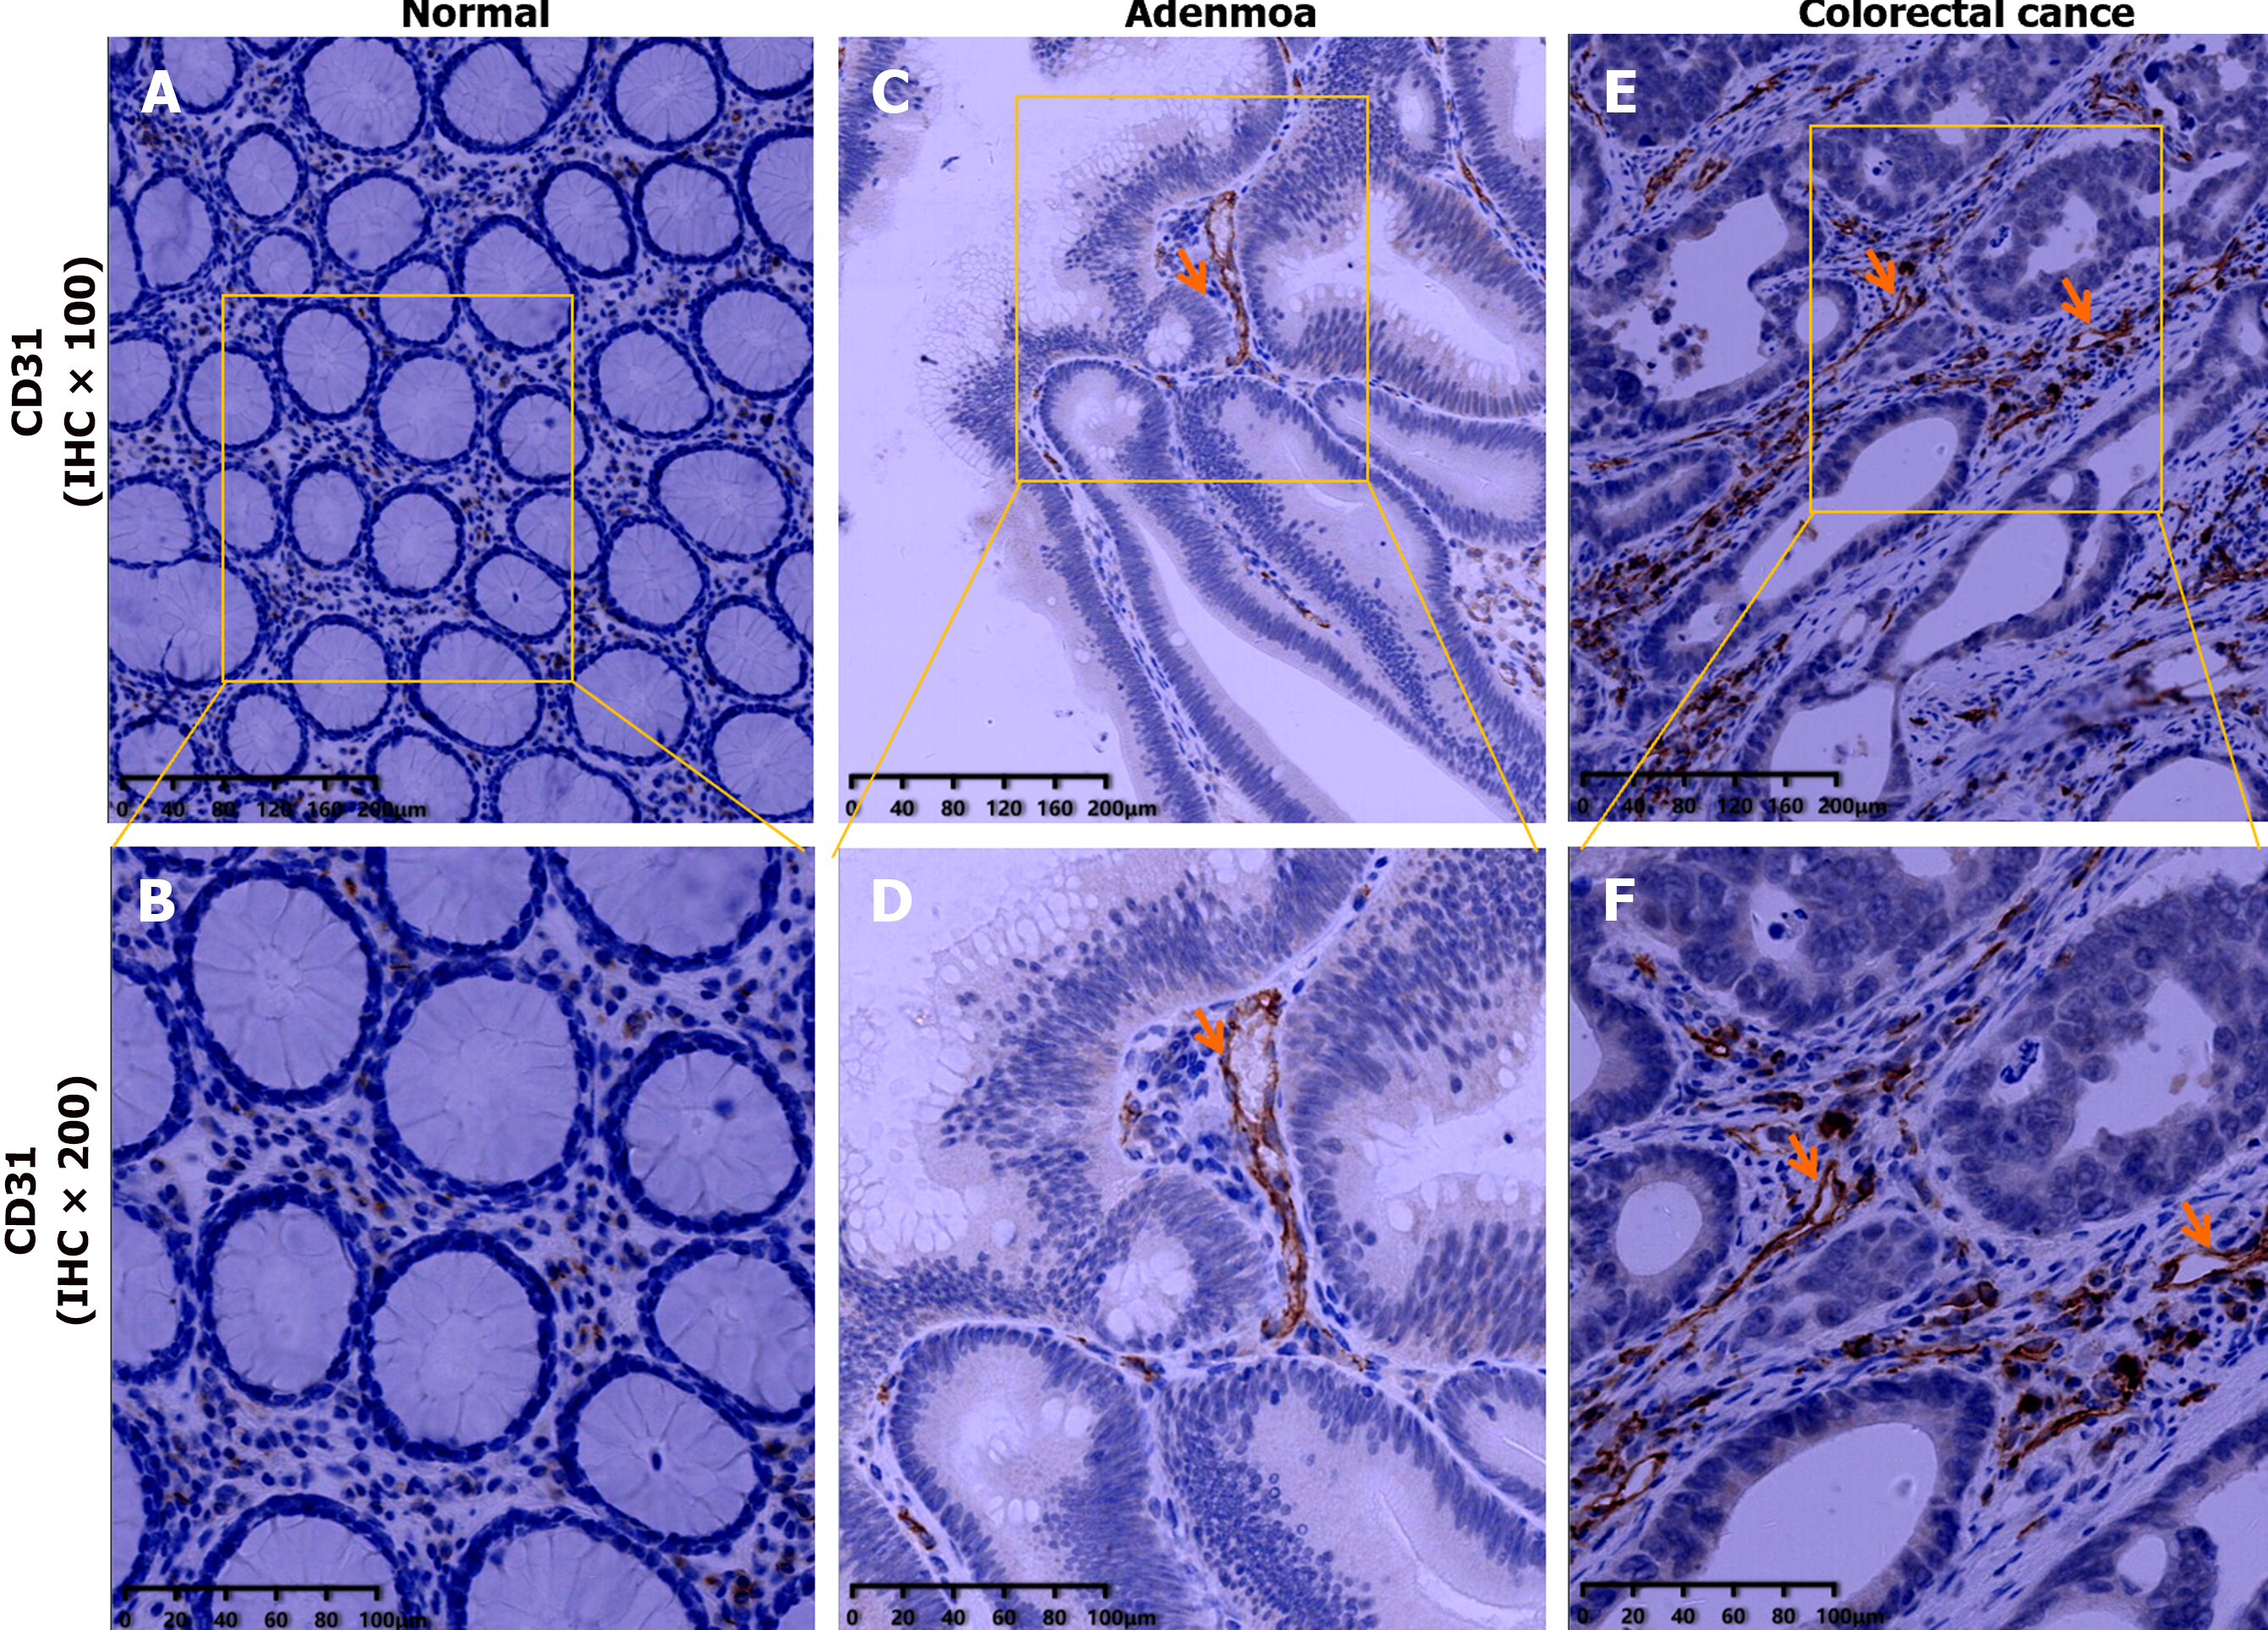
Figure 7 Immunohistochemistry of CD31 in three groups.
A: CD31 immunohistochemistry plot in normal group (IHC × 100); B: CD31 immuno
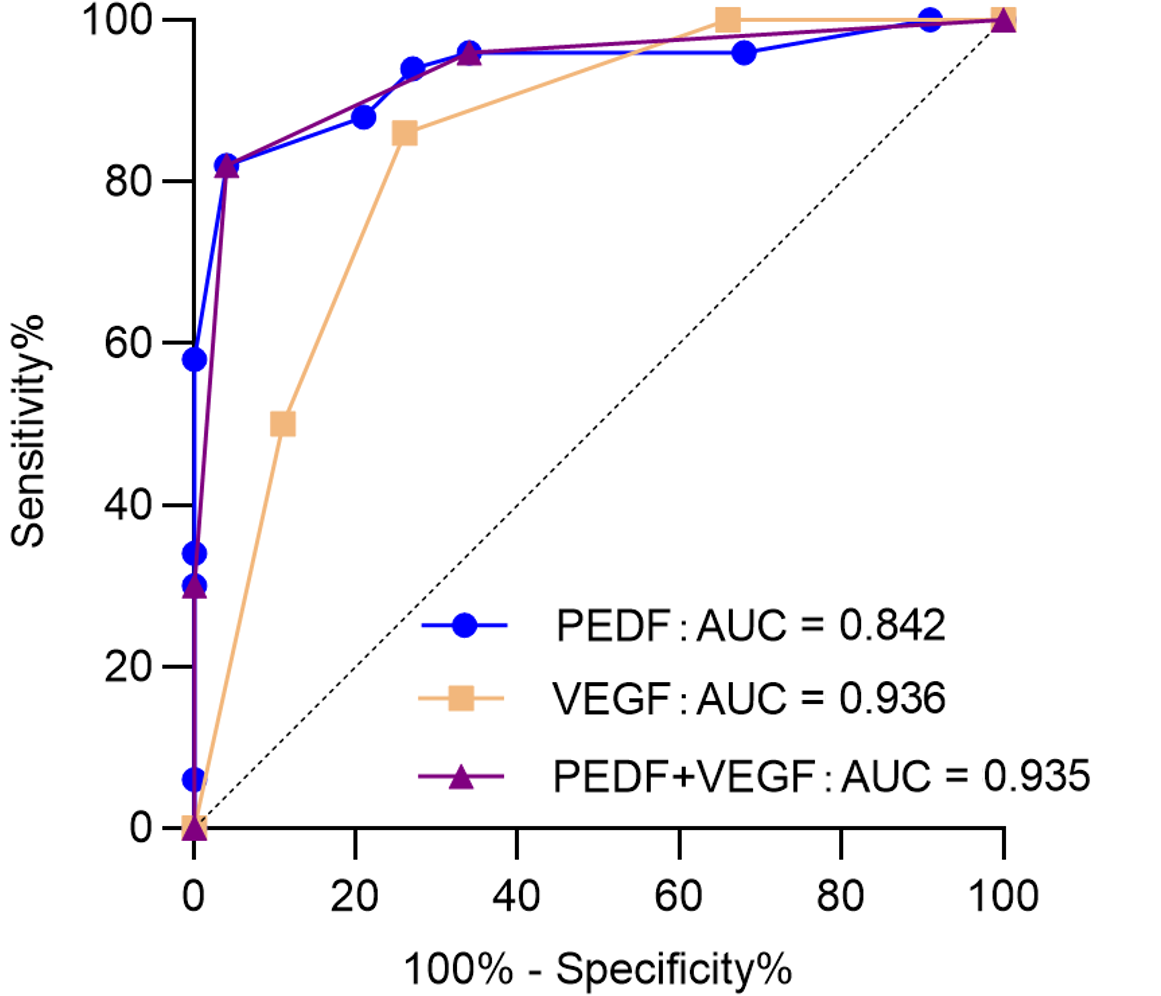
Figure 8 receiver operating characteristic curve of pigment epithelium-derived factors and vascular endothelial growth factors in the diagnosis of colorectal cancer.
AUC: Area under the curve; PEDF: Pigment epithelium-derived factors; VEGF: Vascular endothelial growth factors.
- Citation: Yang Y, Wen W, Chen FL, Zhang YJ, Liu XC, Yang XY, Hu SS, Jiang Y, Yuan J. Expression and significance of pigment epithelium-derived factor and vascular endothelial growth factor in colorectal adenoma and cancer. World J Gastrointest Oncol 2024; 16(3): 670-686
- URL: https://www.wjgnet.com/1948-5204/full/v16/i3/670.htm
- DOI: https://dx.doi.org/10.4251/wjgo.v16.i3.670


