Copyright
©The Author(s) 2021.
World J Gastrointest Oncol. Oct 15, 2021; 13(10): 1302-1316
Published online Oct 15, 2021. doi: 10.4251/wjgo.v13.i10.1302
Published online Oct 15, 2021. doi: 10.4251/wjgo.v13.i10.1302
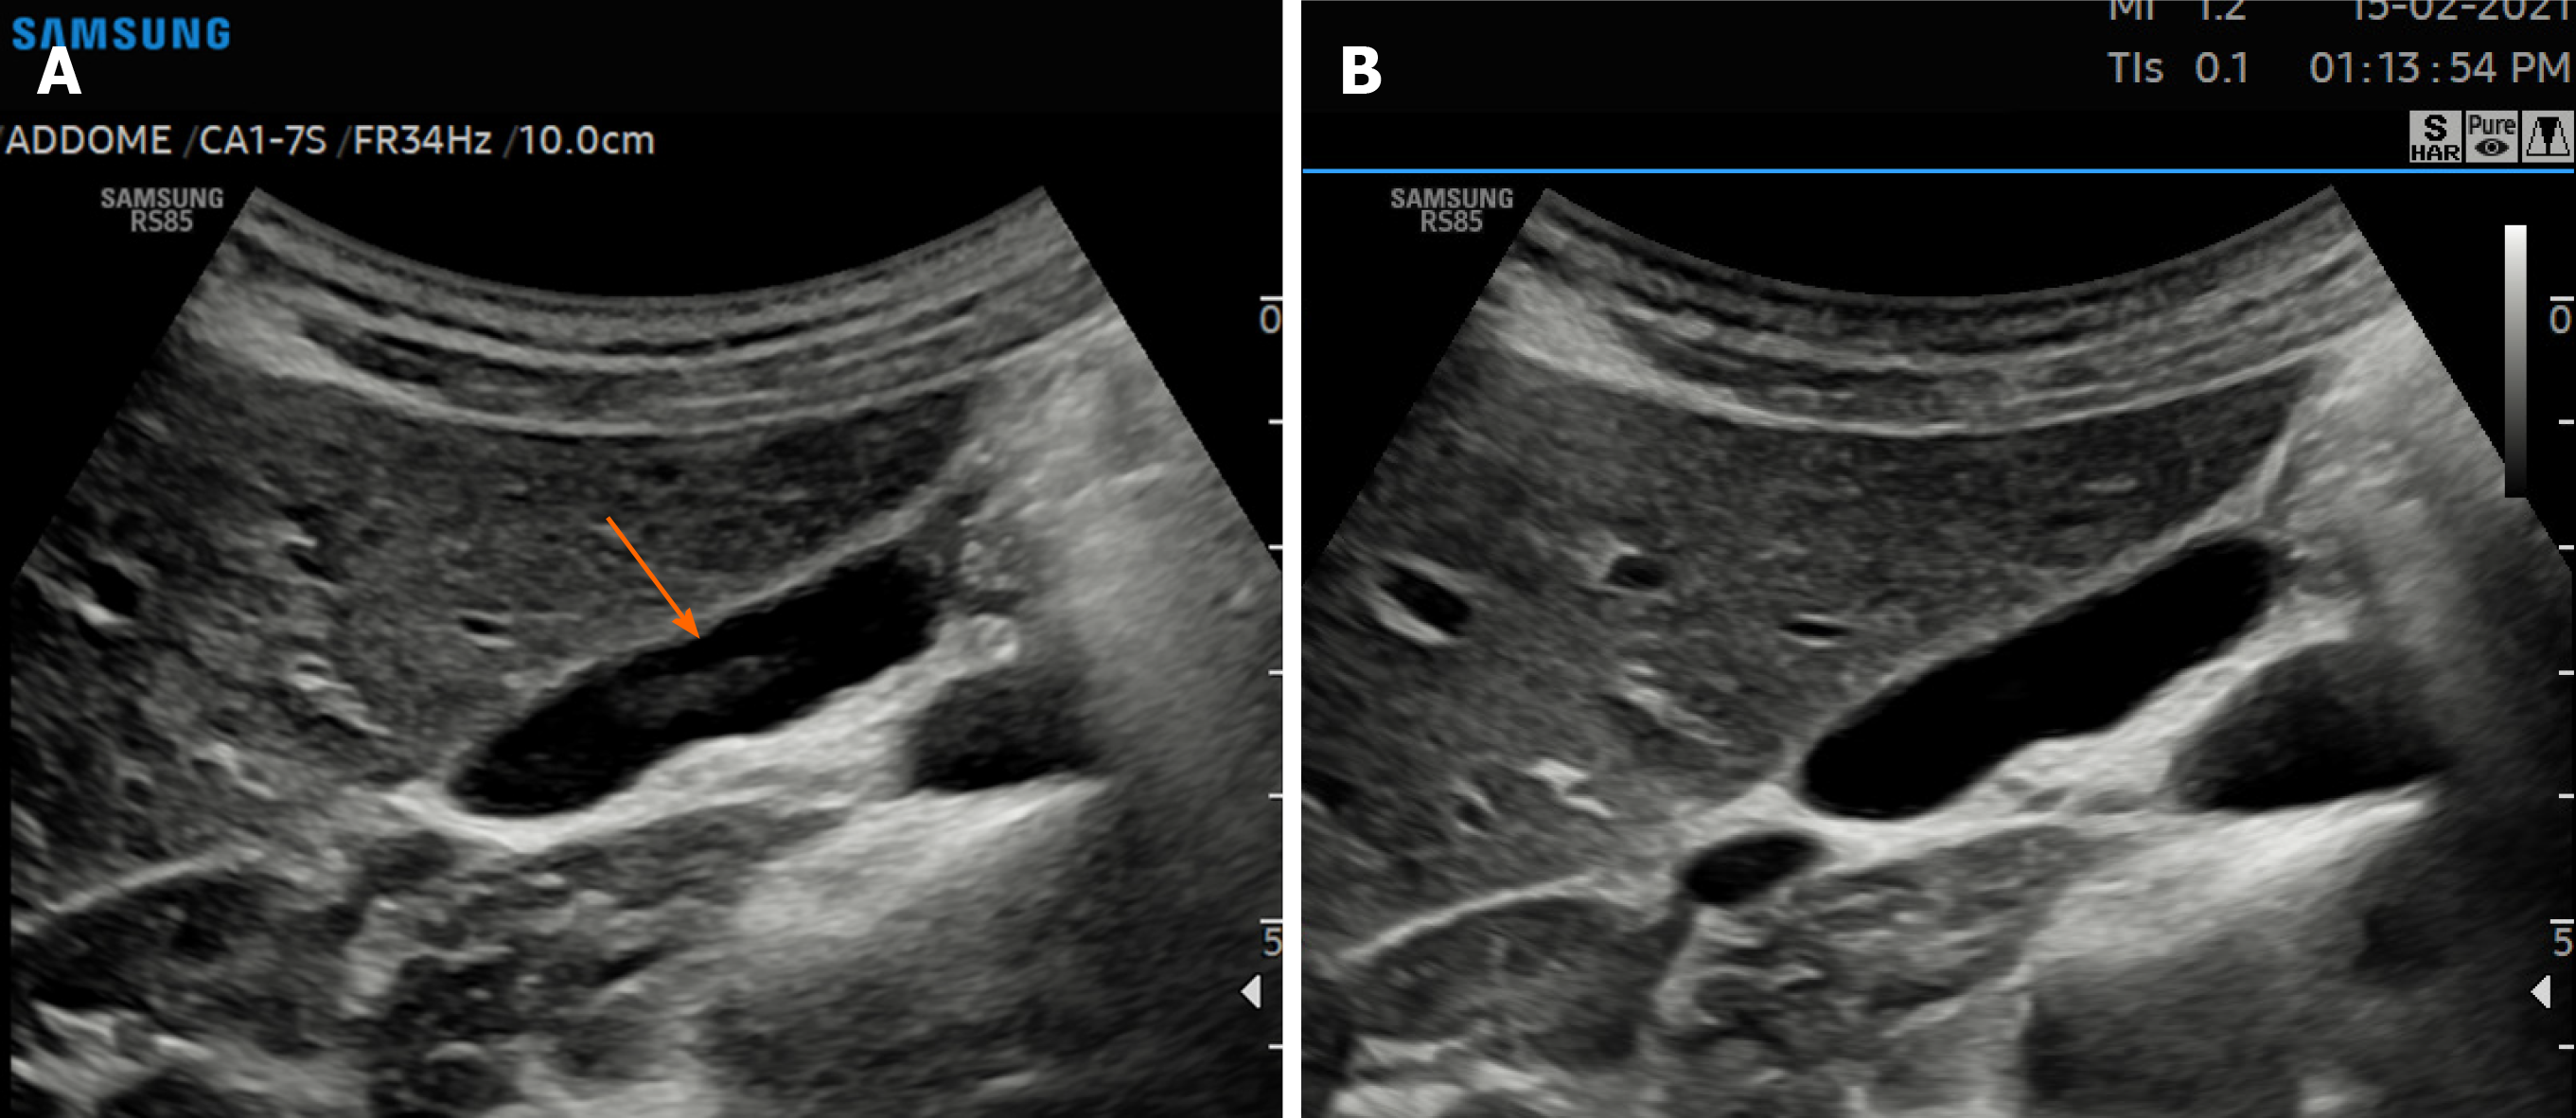
Figure 1 Gallbladder images acquired with fundamental imaging (A), and Harmonic Imaging (B).
Note the marked reduction in reverberation artifact in the gallbladder lumen (arrow).
Figure 2 Liver metastasis: conventional color Doppler shows lack of vascularity (A), at microvascular imaging (MV-FlowTM) both vascularity is clearly depicted at the periphery and within the mass (B).
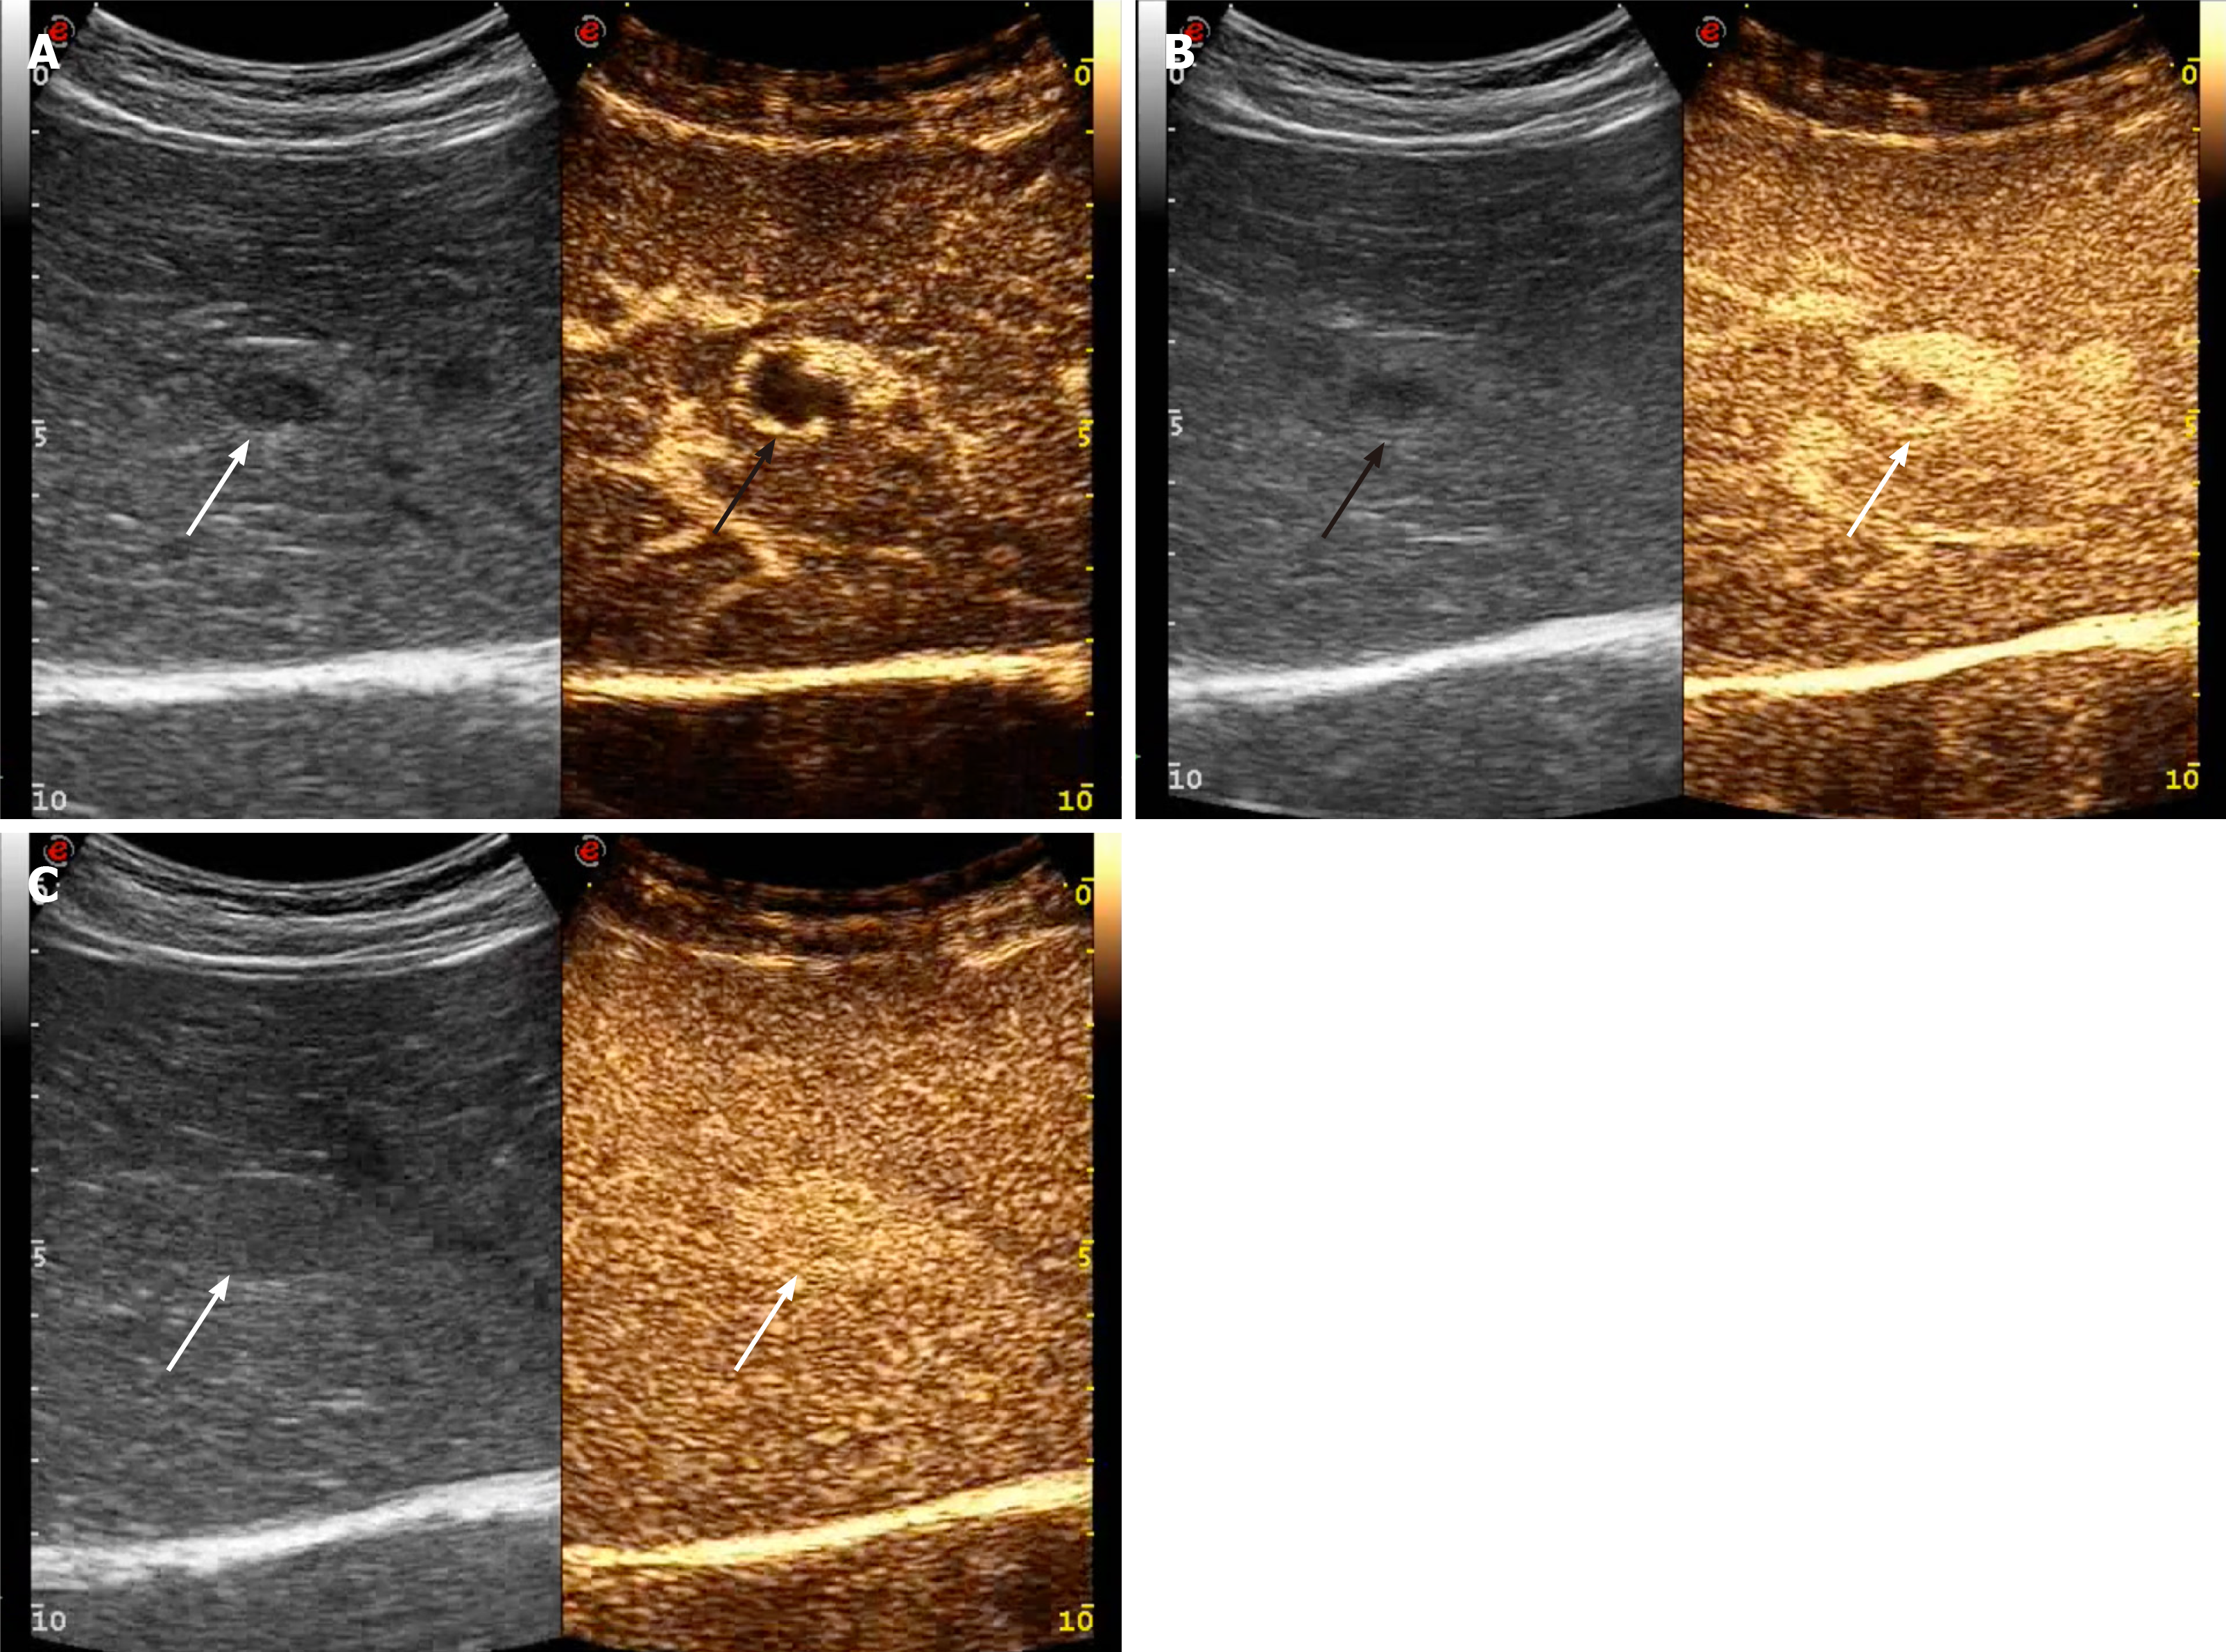
Figure 3 Hemangioma.
A: Contrast enhanced ultrasound examination in the arterial phase (20 s after the i.v. injection of contrast agent) shows a peripheral globular contrast enhancement pattern (arrows); B: In the portal phase (67 s after the injection) a centripetal but still incomplete fill-in is occurring (arrows); C: In the extended portal phase (3 minutes after the injection) the fill-in is now complete and the lesion is still hyperechoic in comparison with adjacent liver parenchyma (arrows).
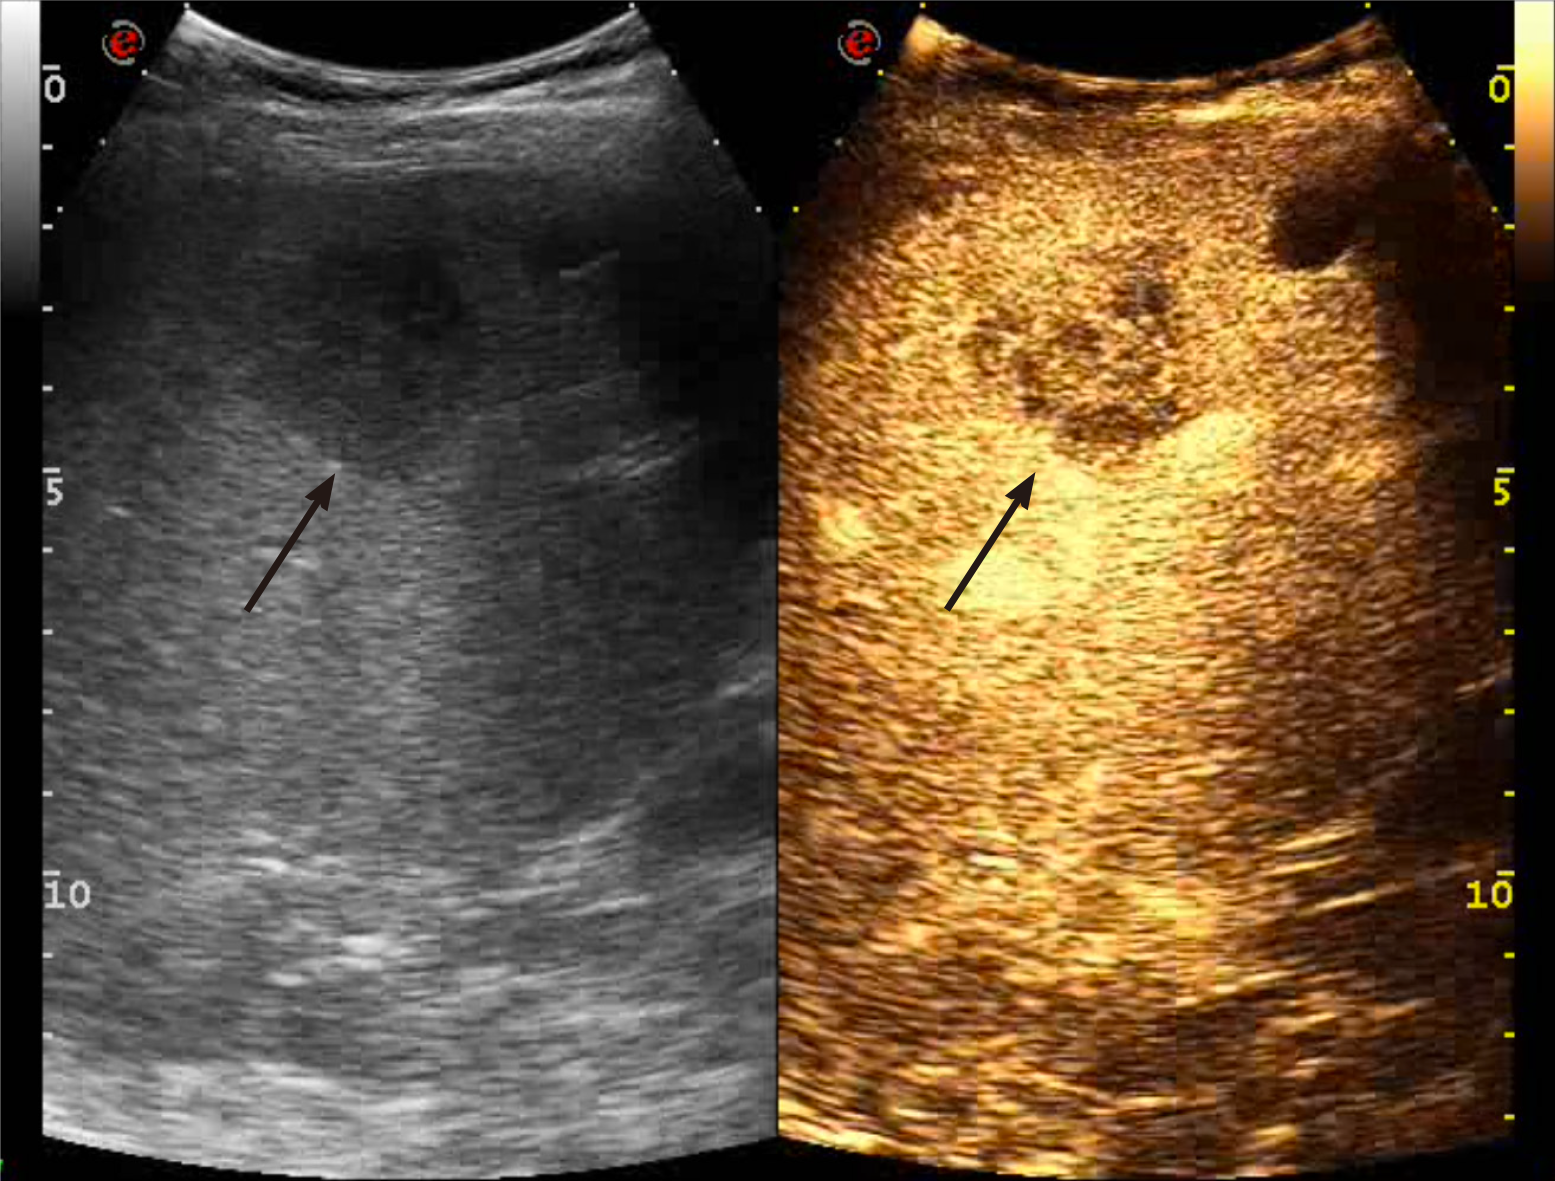
Figure 4 Liver metastasis.
Contrast enhanced ultrasound examination in the early portal phase (50 s after the i.v. injection of contrast agent) shows a heterogeneously vascularized mass, hypoechoic to the surrounding liver parenchyma (black arrow). An anechoic simple cyst is located nearby (black arrow).
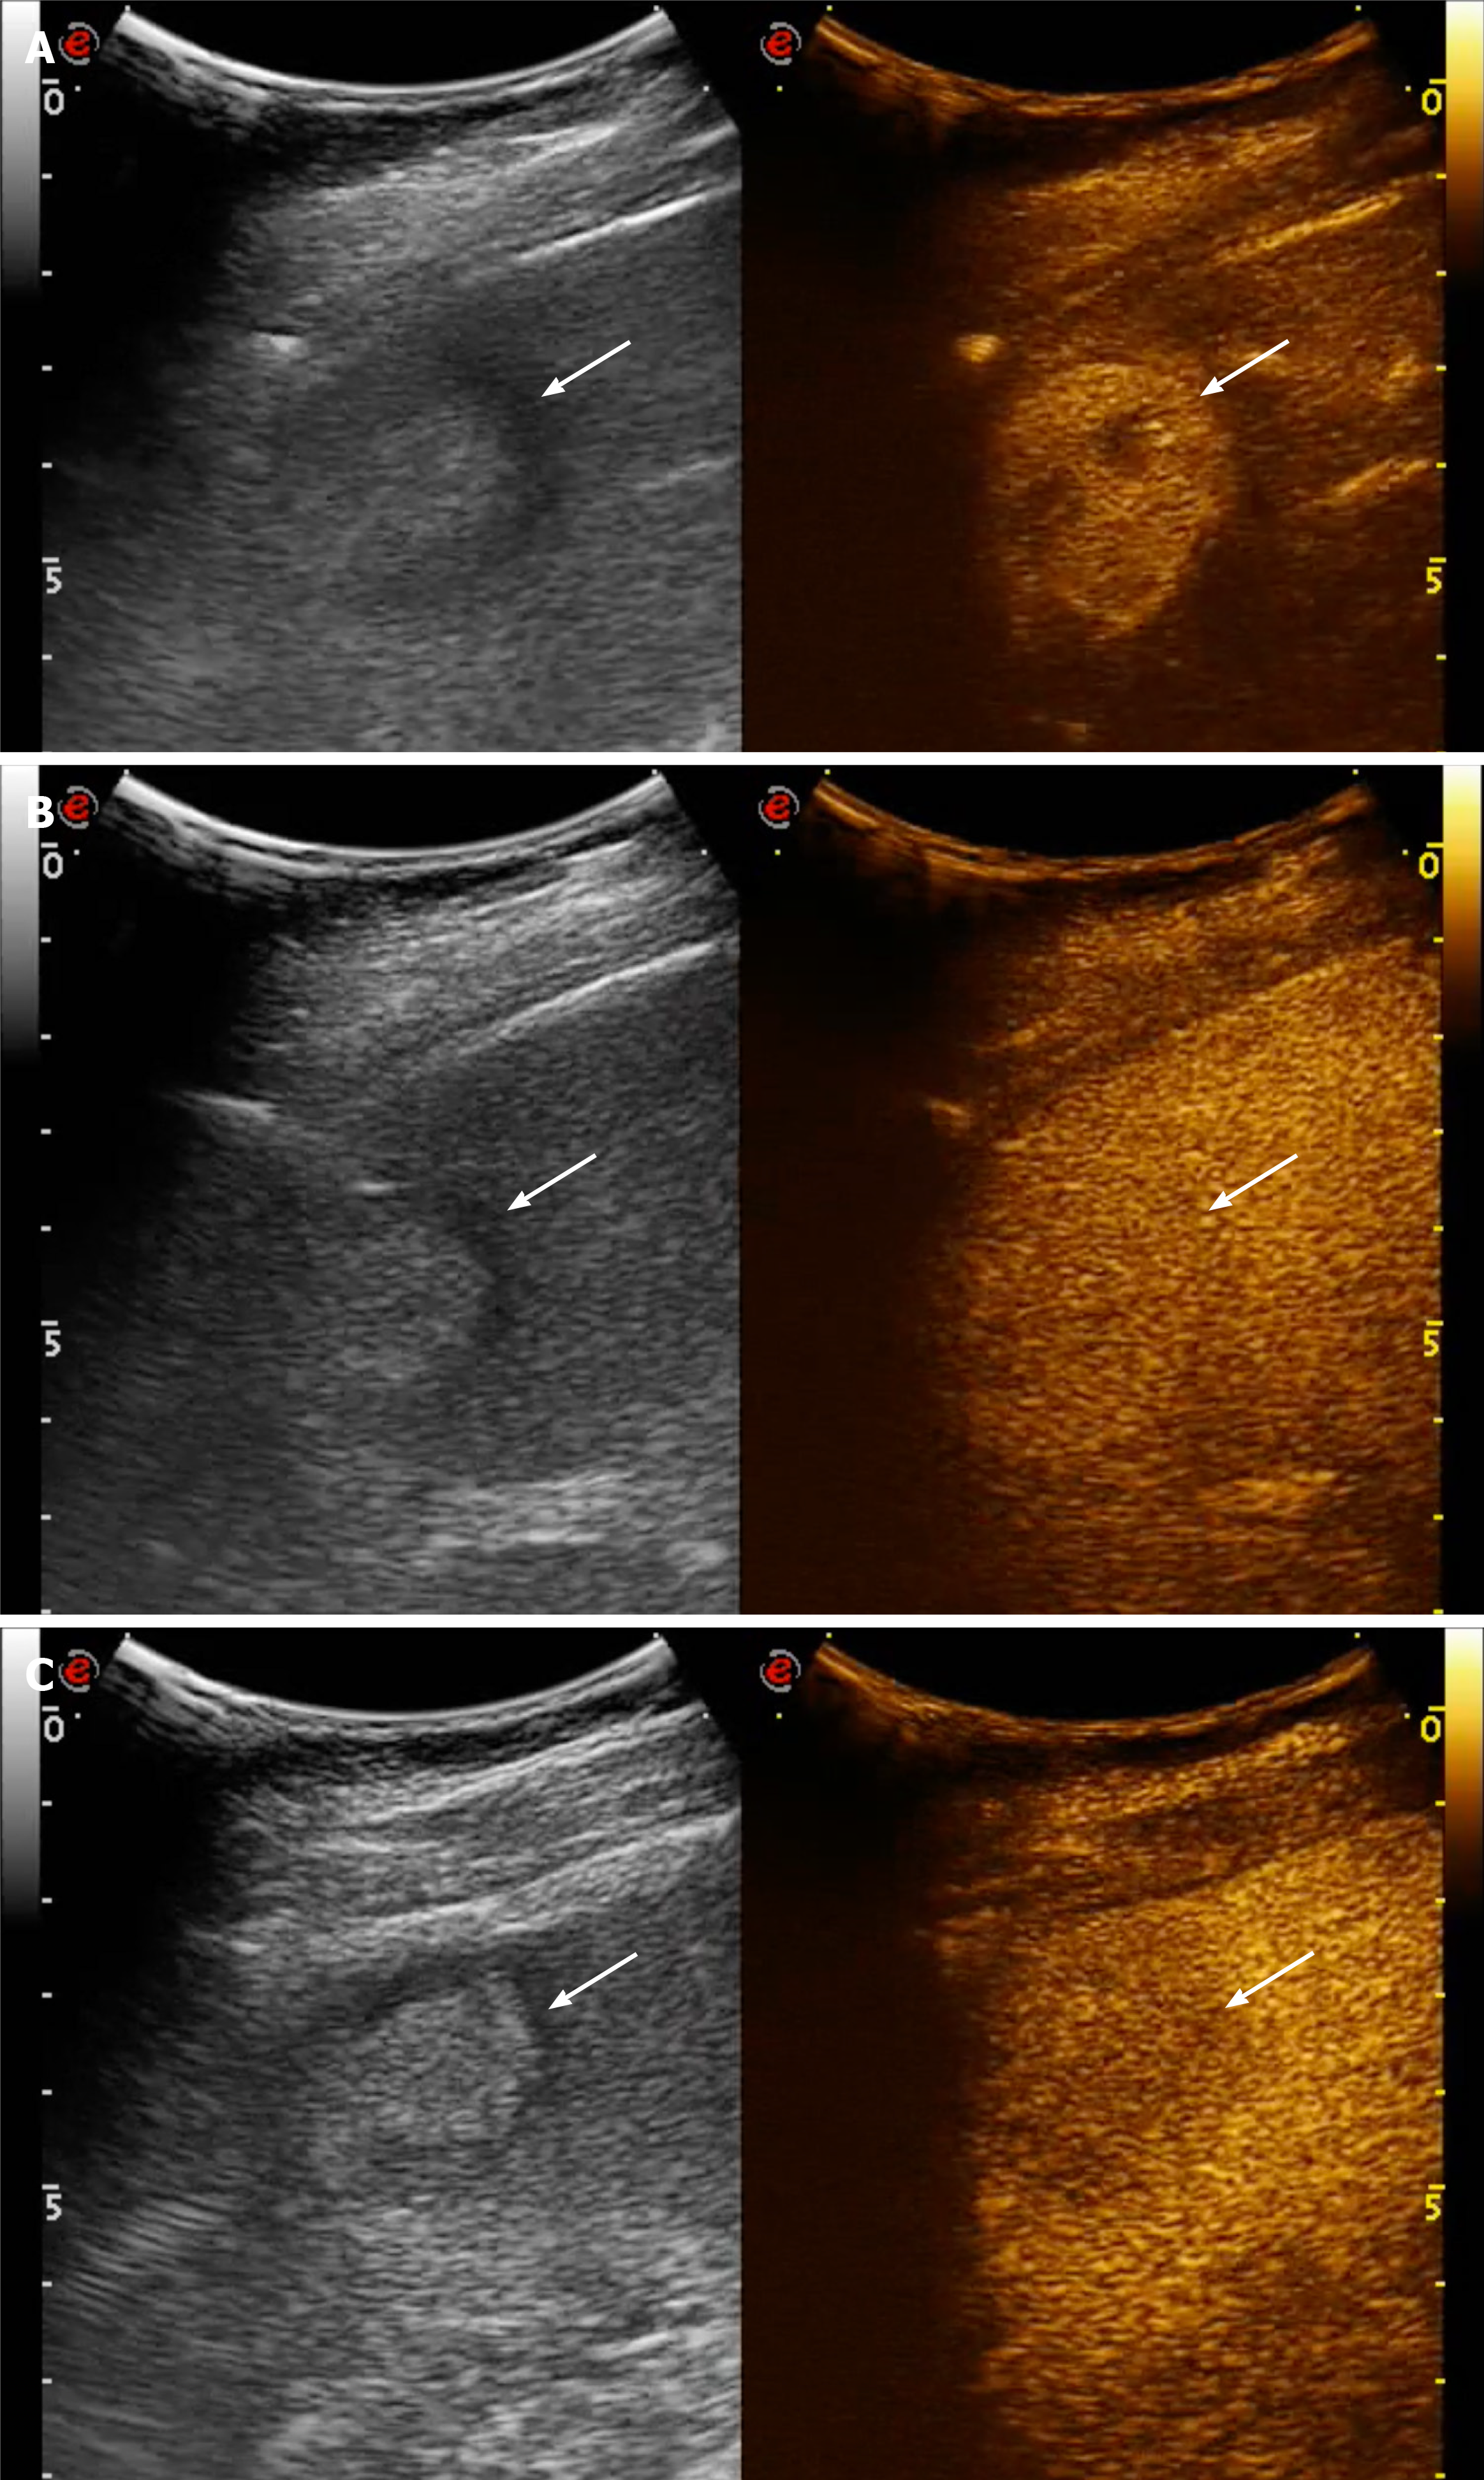
Figure 5 Hepatocellular carcinoma.
A: Contrast enhanced ultrasound examination in the arterial phase (15 s after the i.v. injection of contrast agent) shows a vivid heterogeneous contrast enhancement (arrows); B: In the portal phase (78 s after the injection) the hepatocellular carcinoma (HCC) is isoechoic in comparison to adjacent liver parenchyma (arrows); C: In the extended portal phase (3 min after the injection) the HCC shows a mild wash-out, being hypoechoic in comparison to adjacent liver parenchyma (arrows).
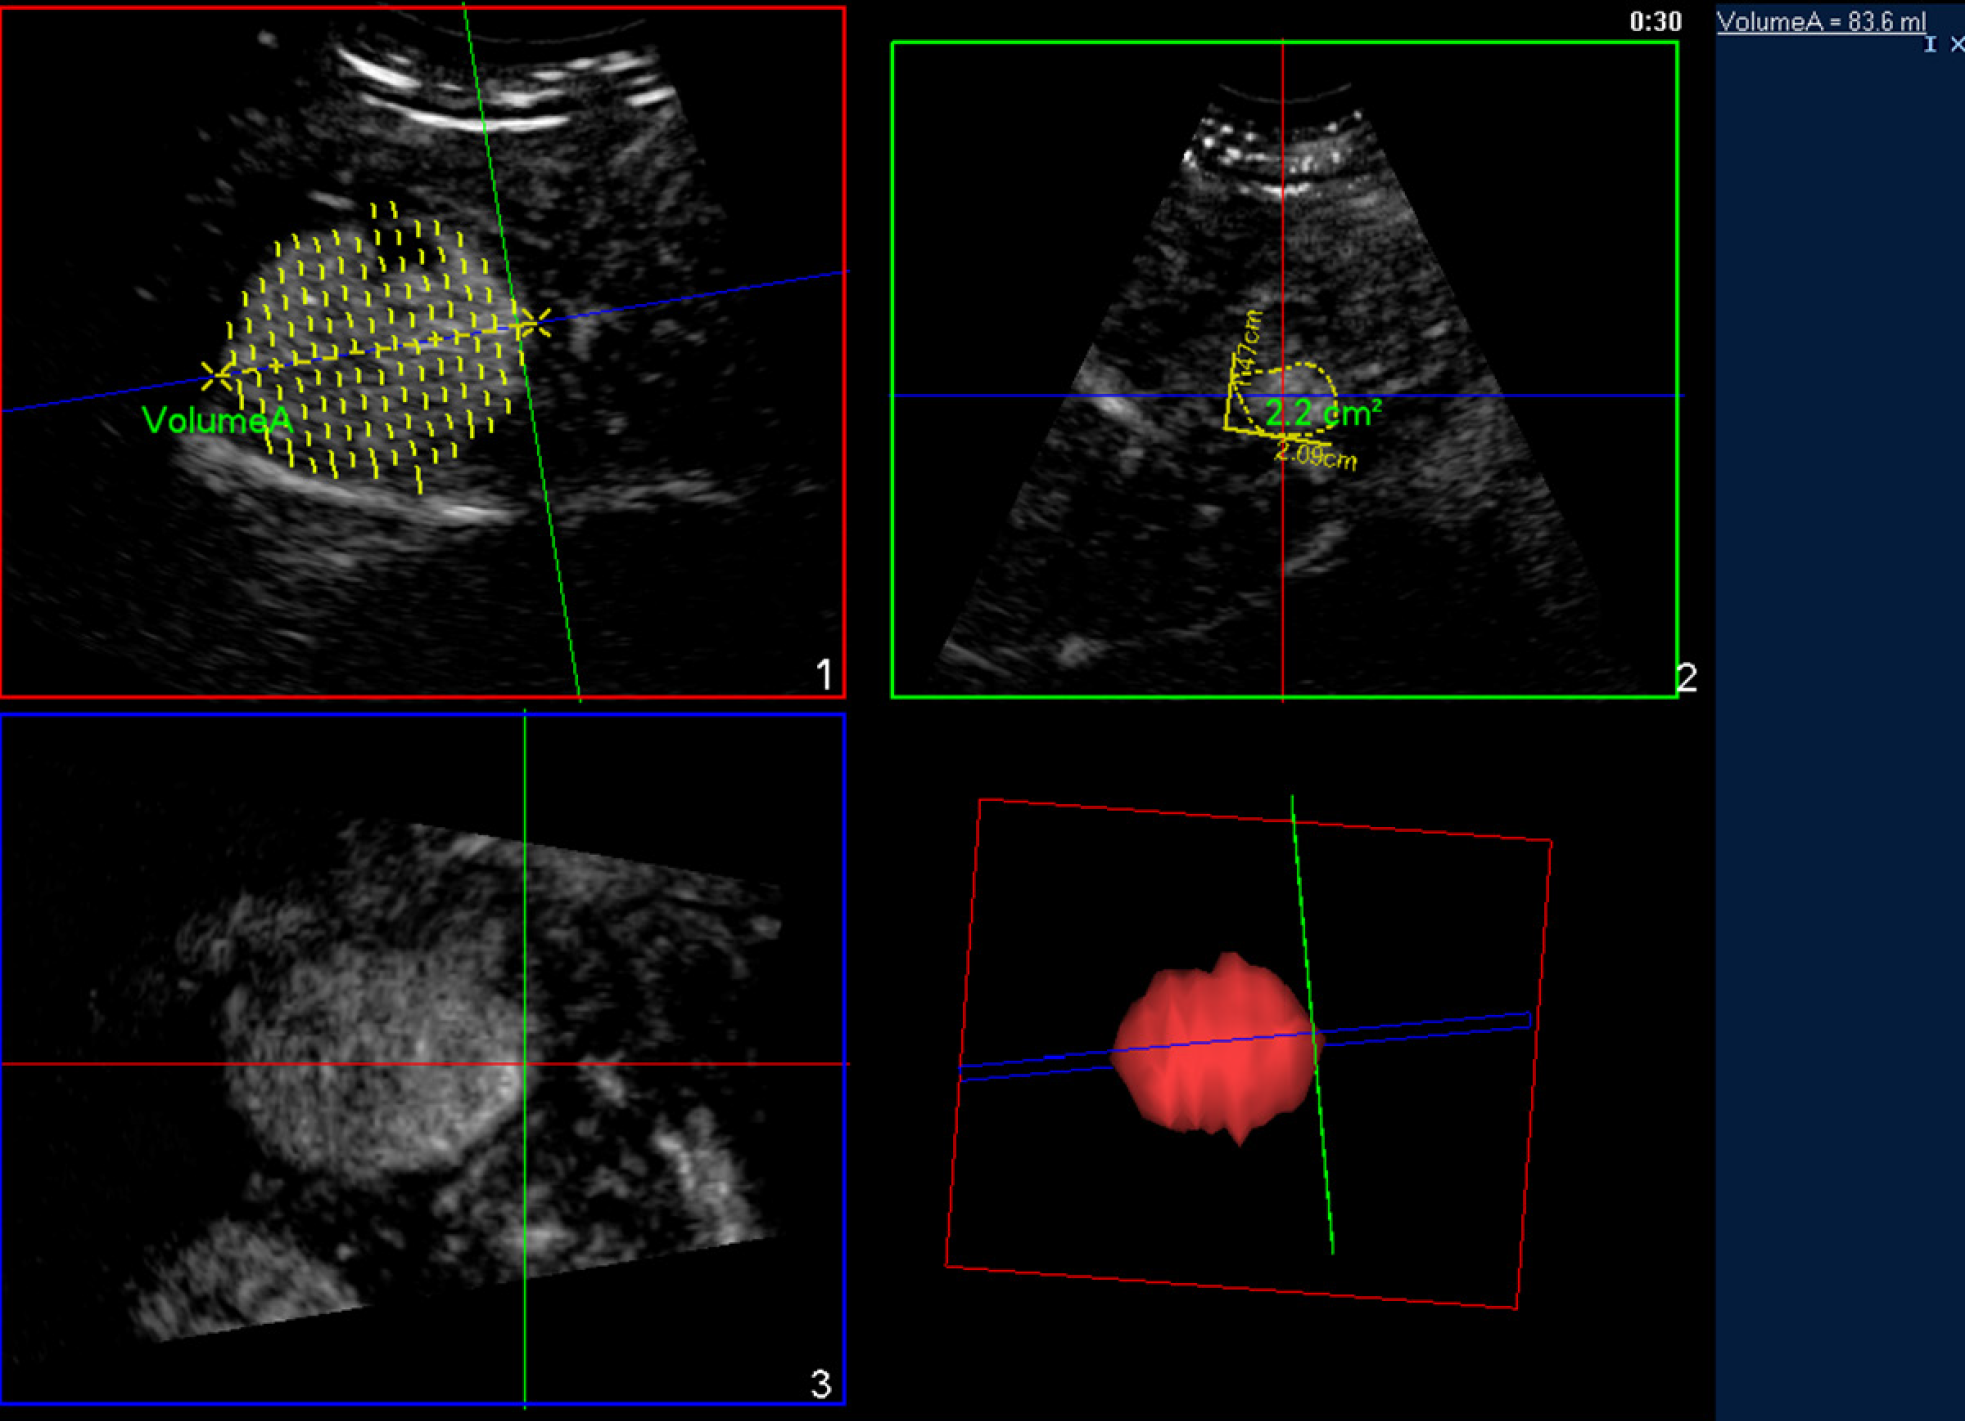
Figure 6 Contrast enhanced ultrasound 3D.
Contrast-enhanced ultrasound of a hepatocellular carcinoma in the arterial phase: three-dimensional rendering and volume calculation.
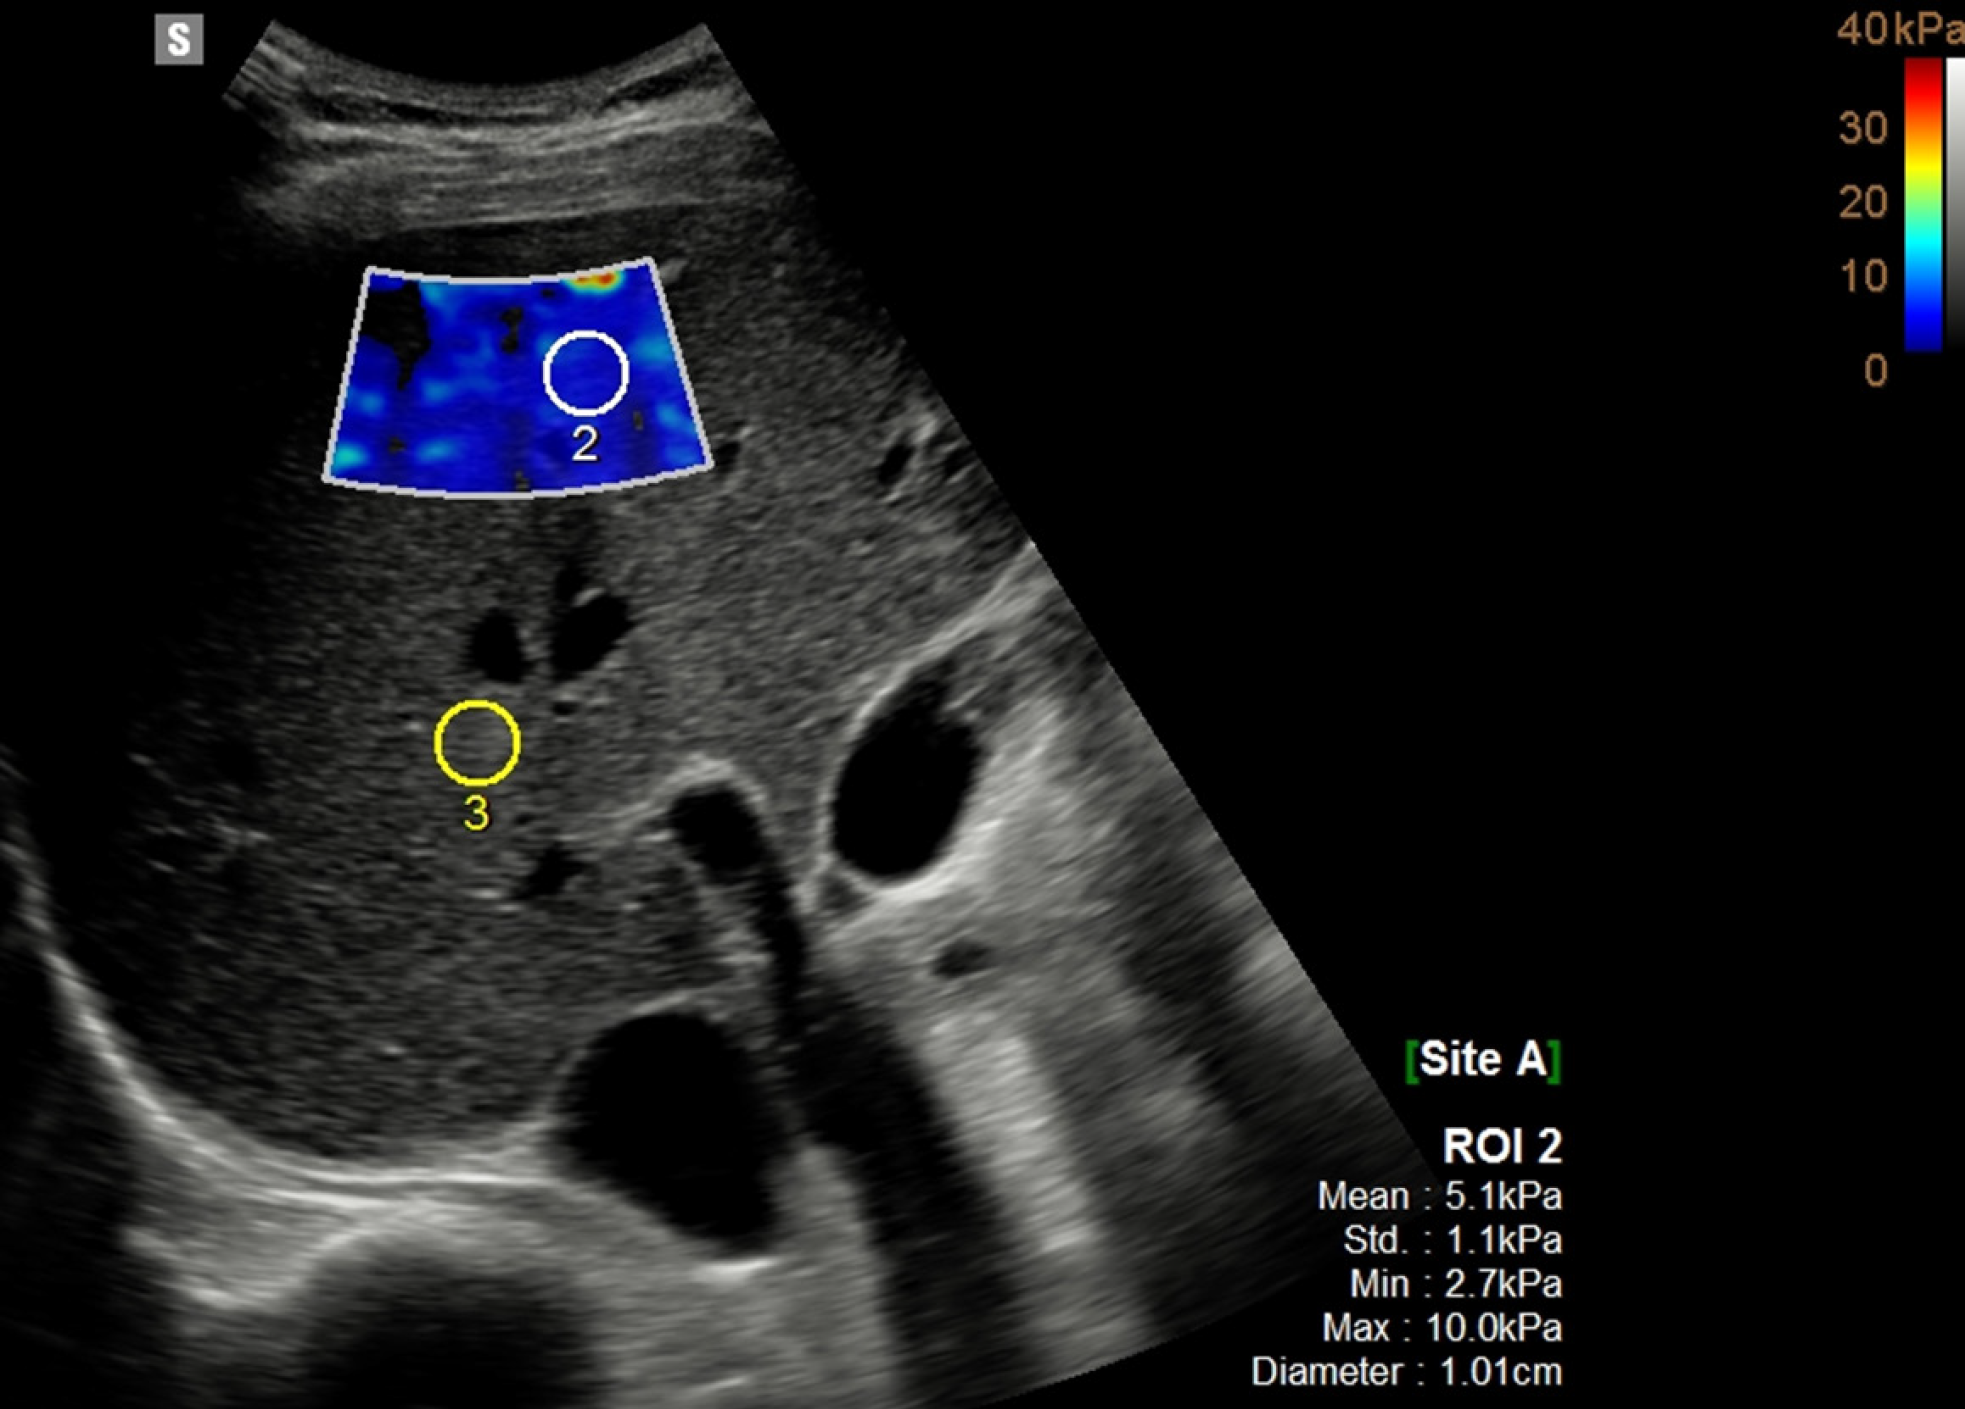
Figure 7 Shearwave.
2D shearwave assessment of a normal liver: both qualitative (blue coloured box) and quantitative information (ROI measurement: 5.1 kPa) are available.
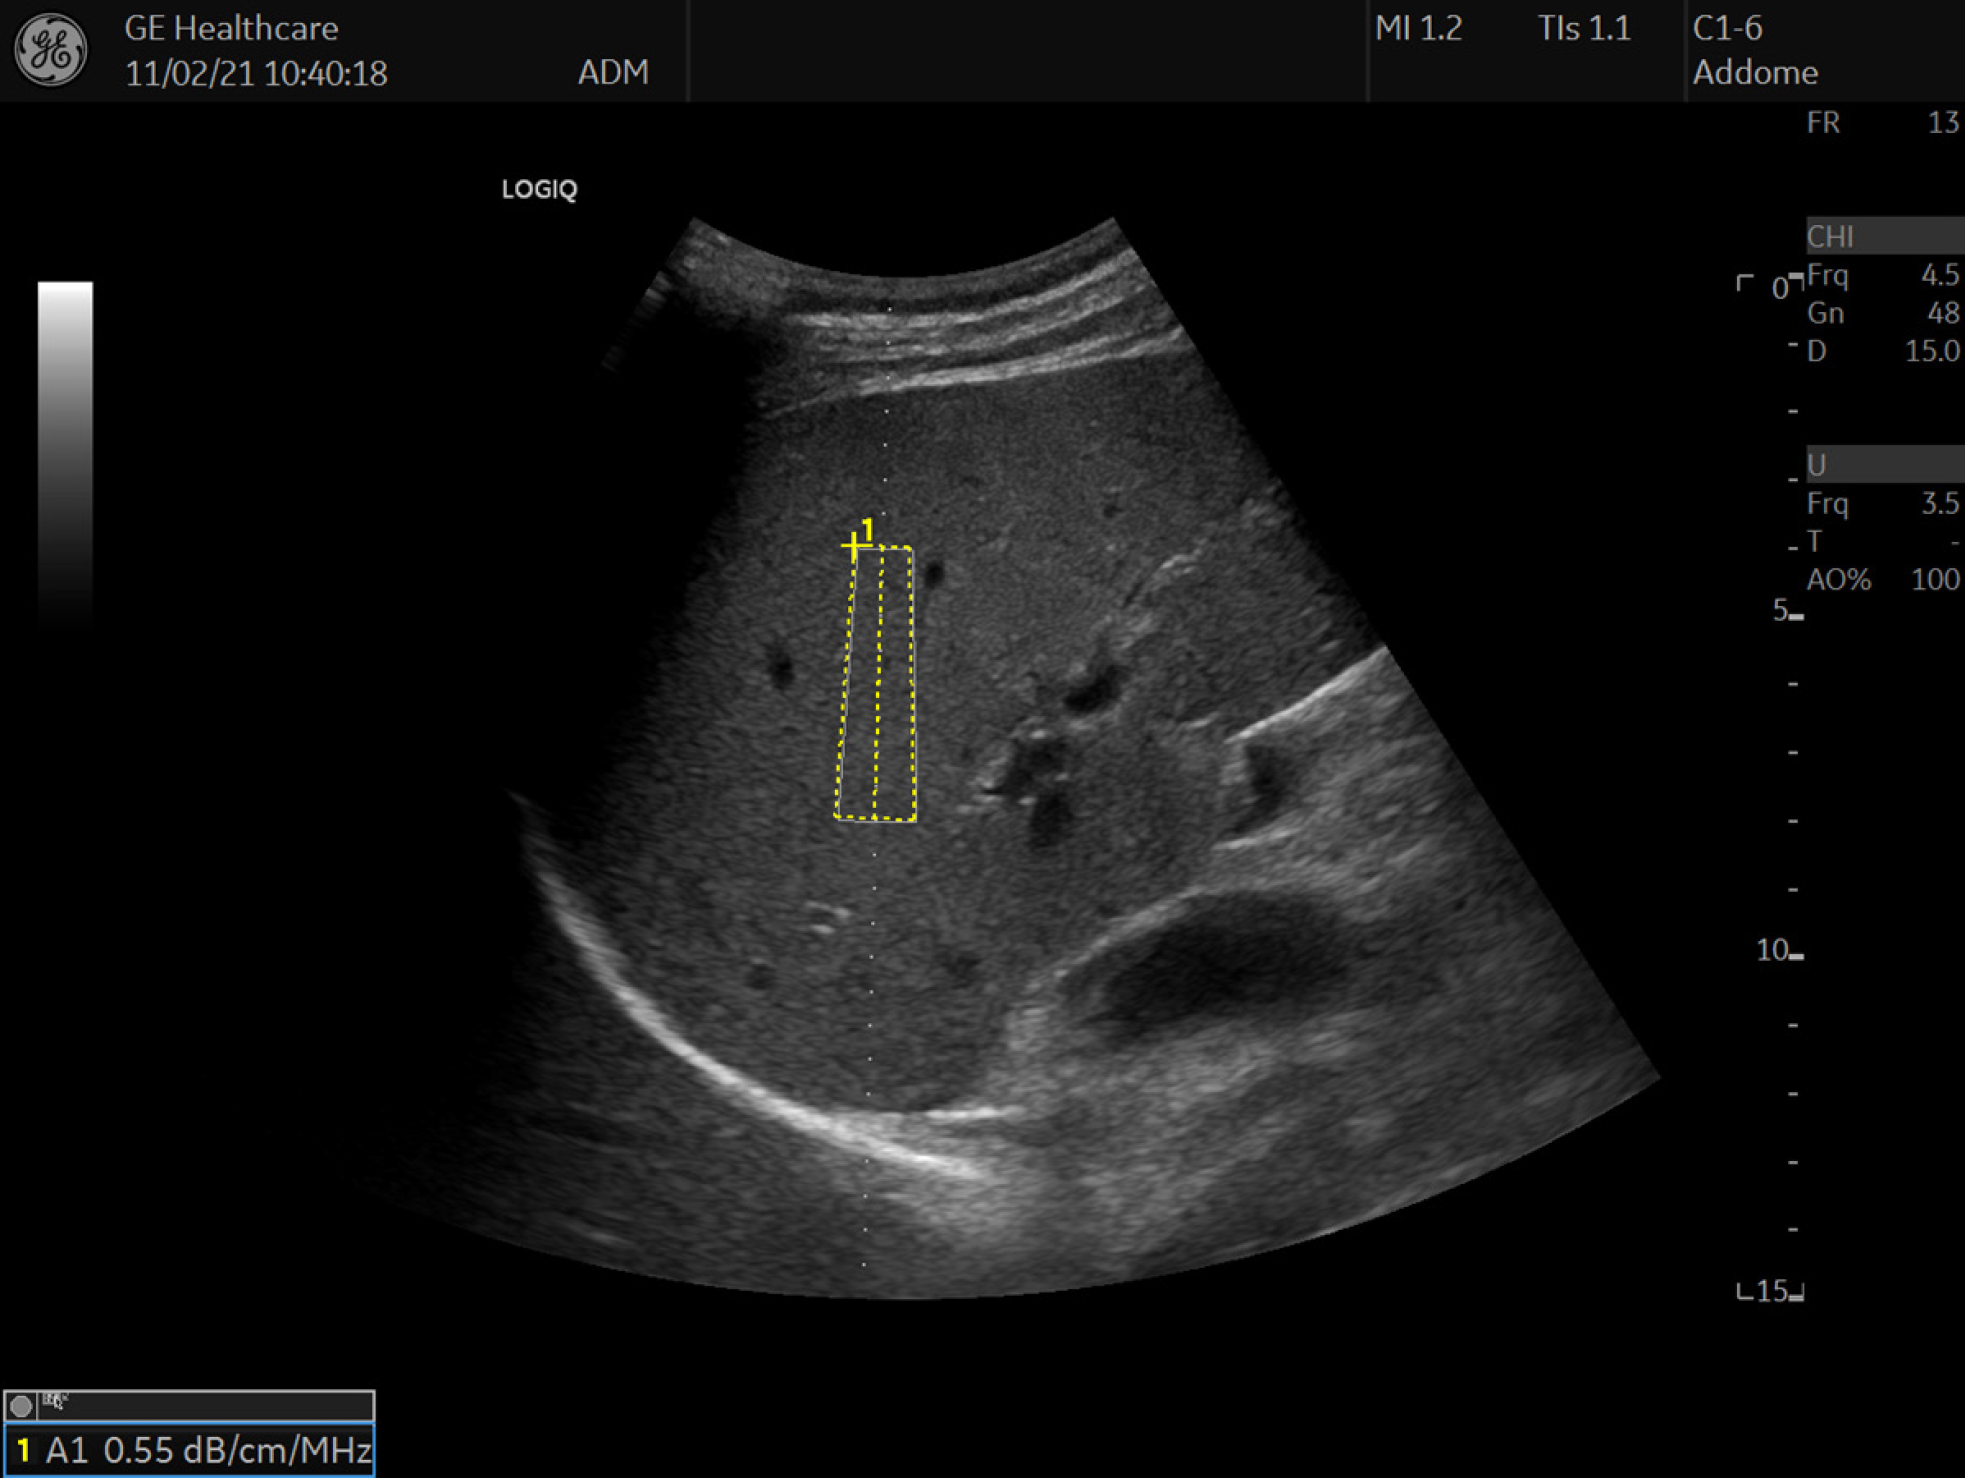
Figure 8 Attenuation calculation in a normal liver: Software provides quantitative assessment in a defined ROI: 0.
55 dB/cm/MHz.
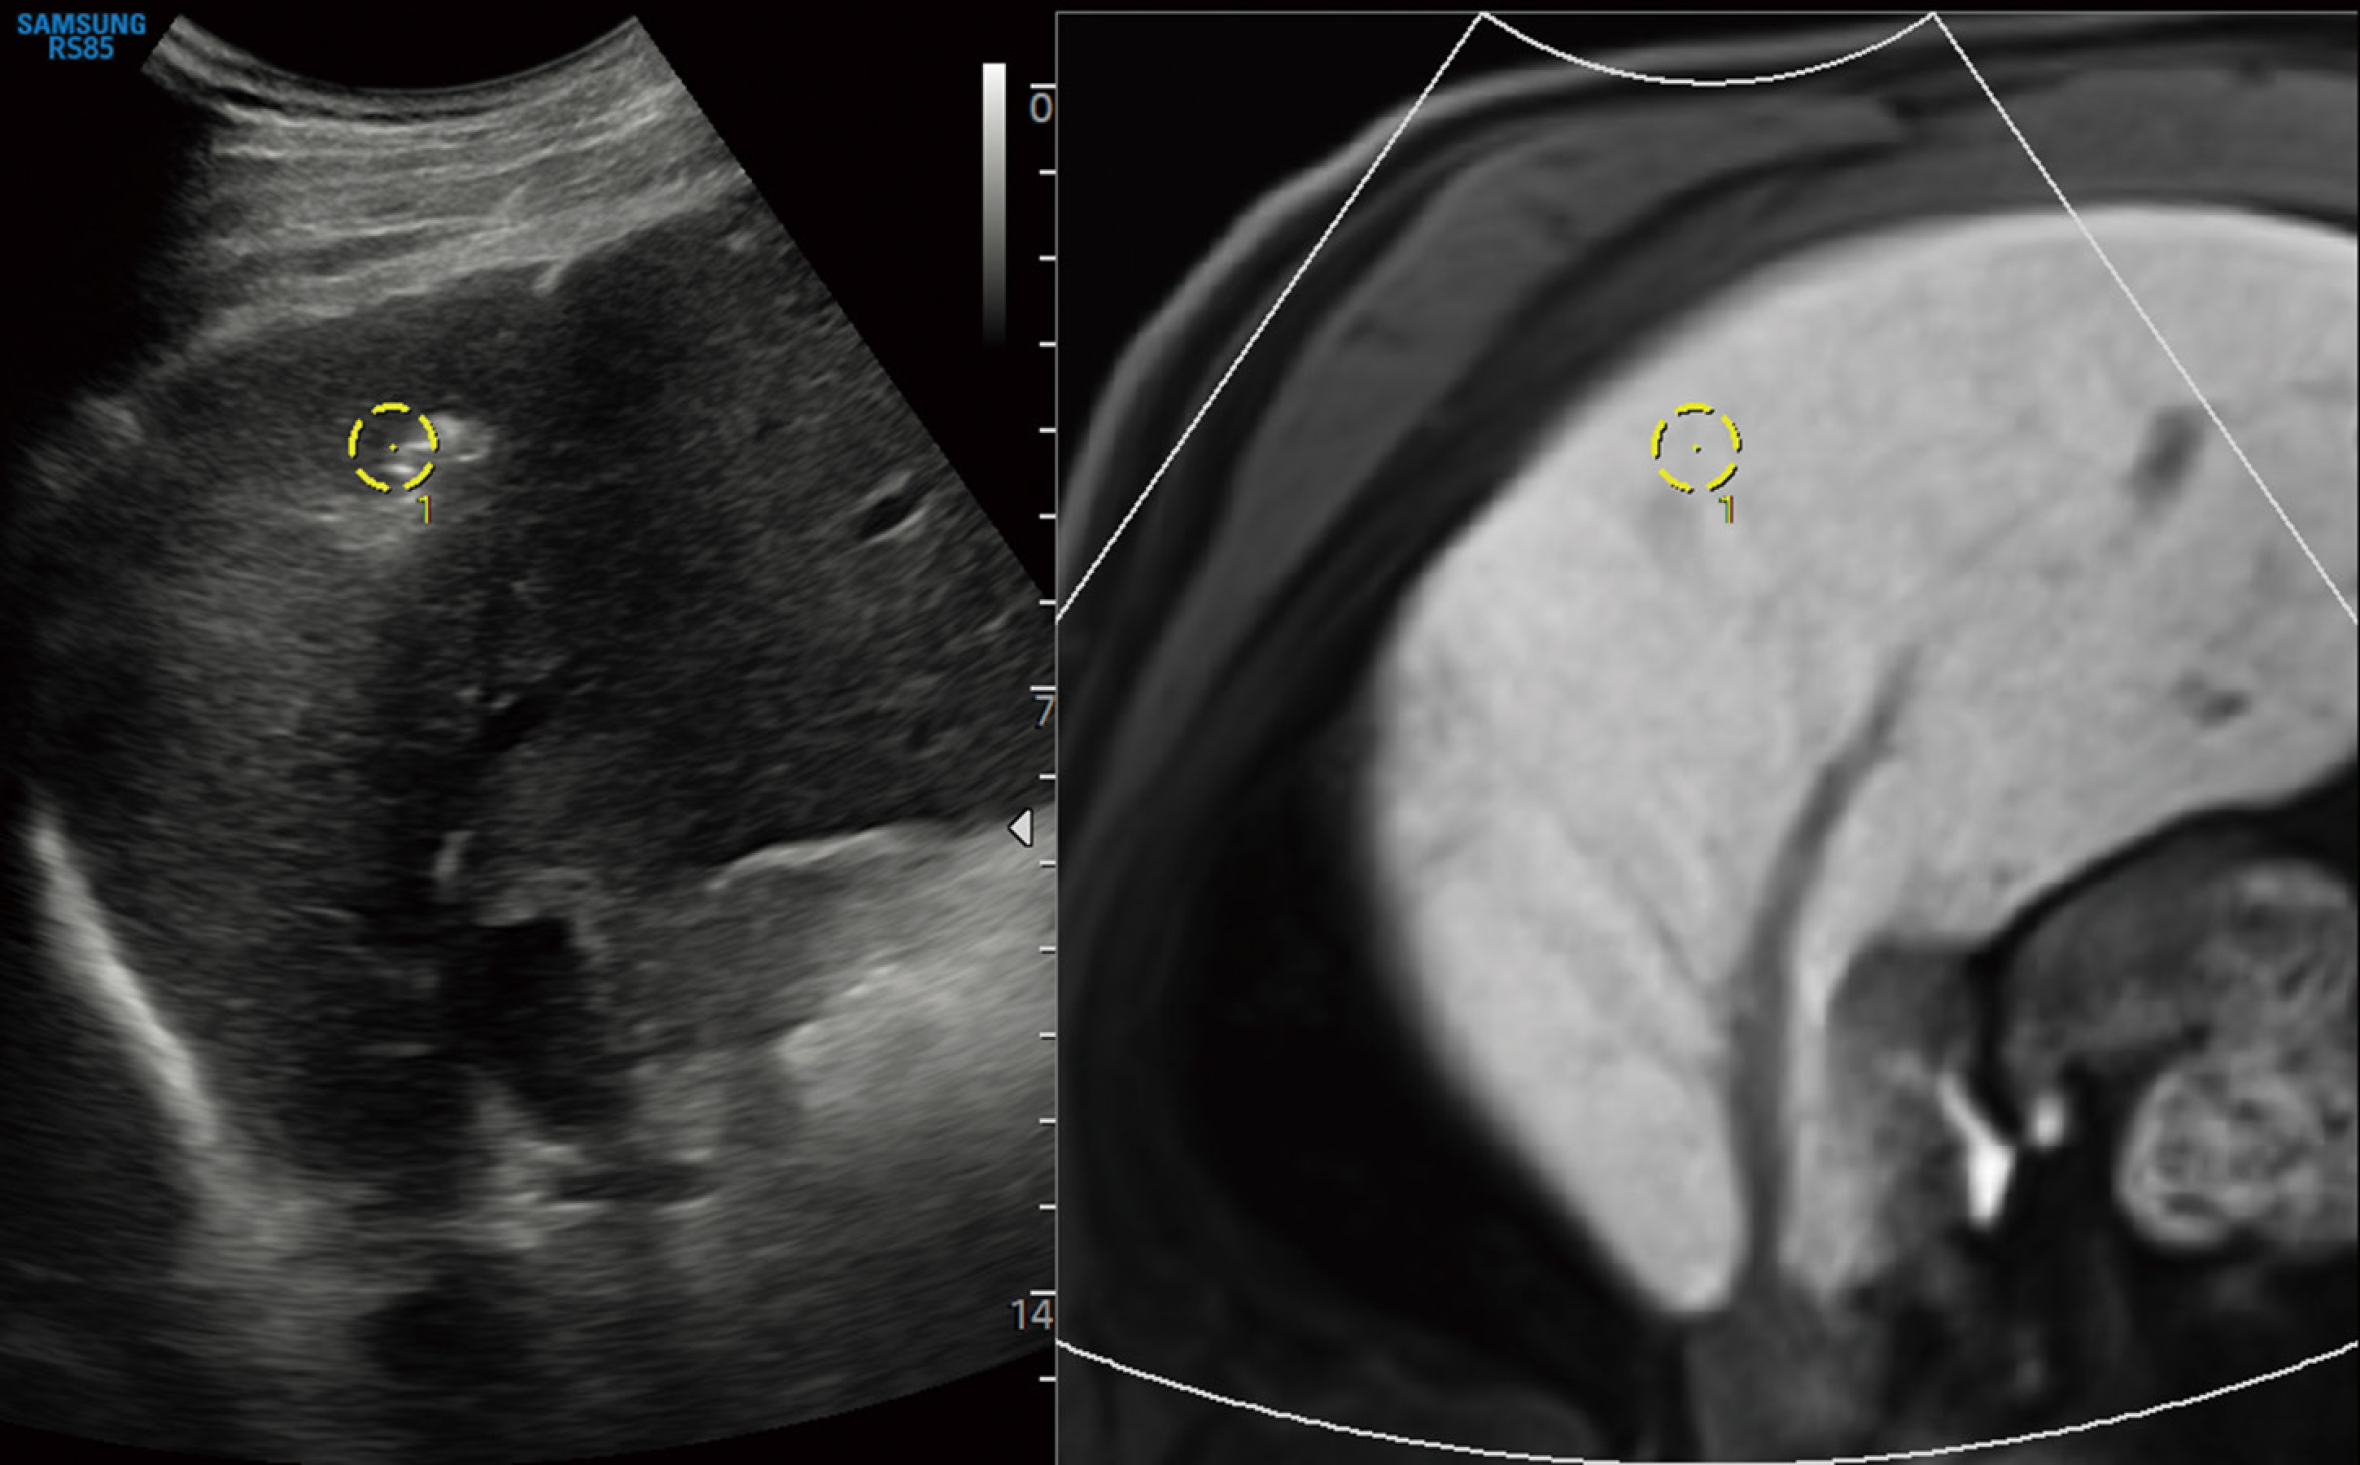
Figure 9 Fusion imaging.
Image shows ultrasound scan of the liver (A) consistently fused in real time with a magnetic resonance study of the same patient (B).
- Citation: Bartolotta TV, Taibbi A, Randazzo A, Gagliardo C. New frontiers in liver ultrasound: From mono to multi parametricity. World J Gastrointest Oncol 2021; 13(10): 1302-1316
- URL: https://www.wjgnet.com/1948-5204/full/v13/i10/1302.htm
- DOI: https://dx.doi.org/10.4251/wjgo.v13.i10.1302


