Copyright
©The Author(s) 2019.
World J Gastrointest Oncol. Nov 15, 2019; 11(11): 983-997
Published online Nov 15, 2019. doi: 10.4251/wjgo.v11.i11.983
Published online Nov 15, 2019. doi: 10.4251/wjgo.v11.i11.983
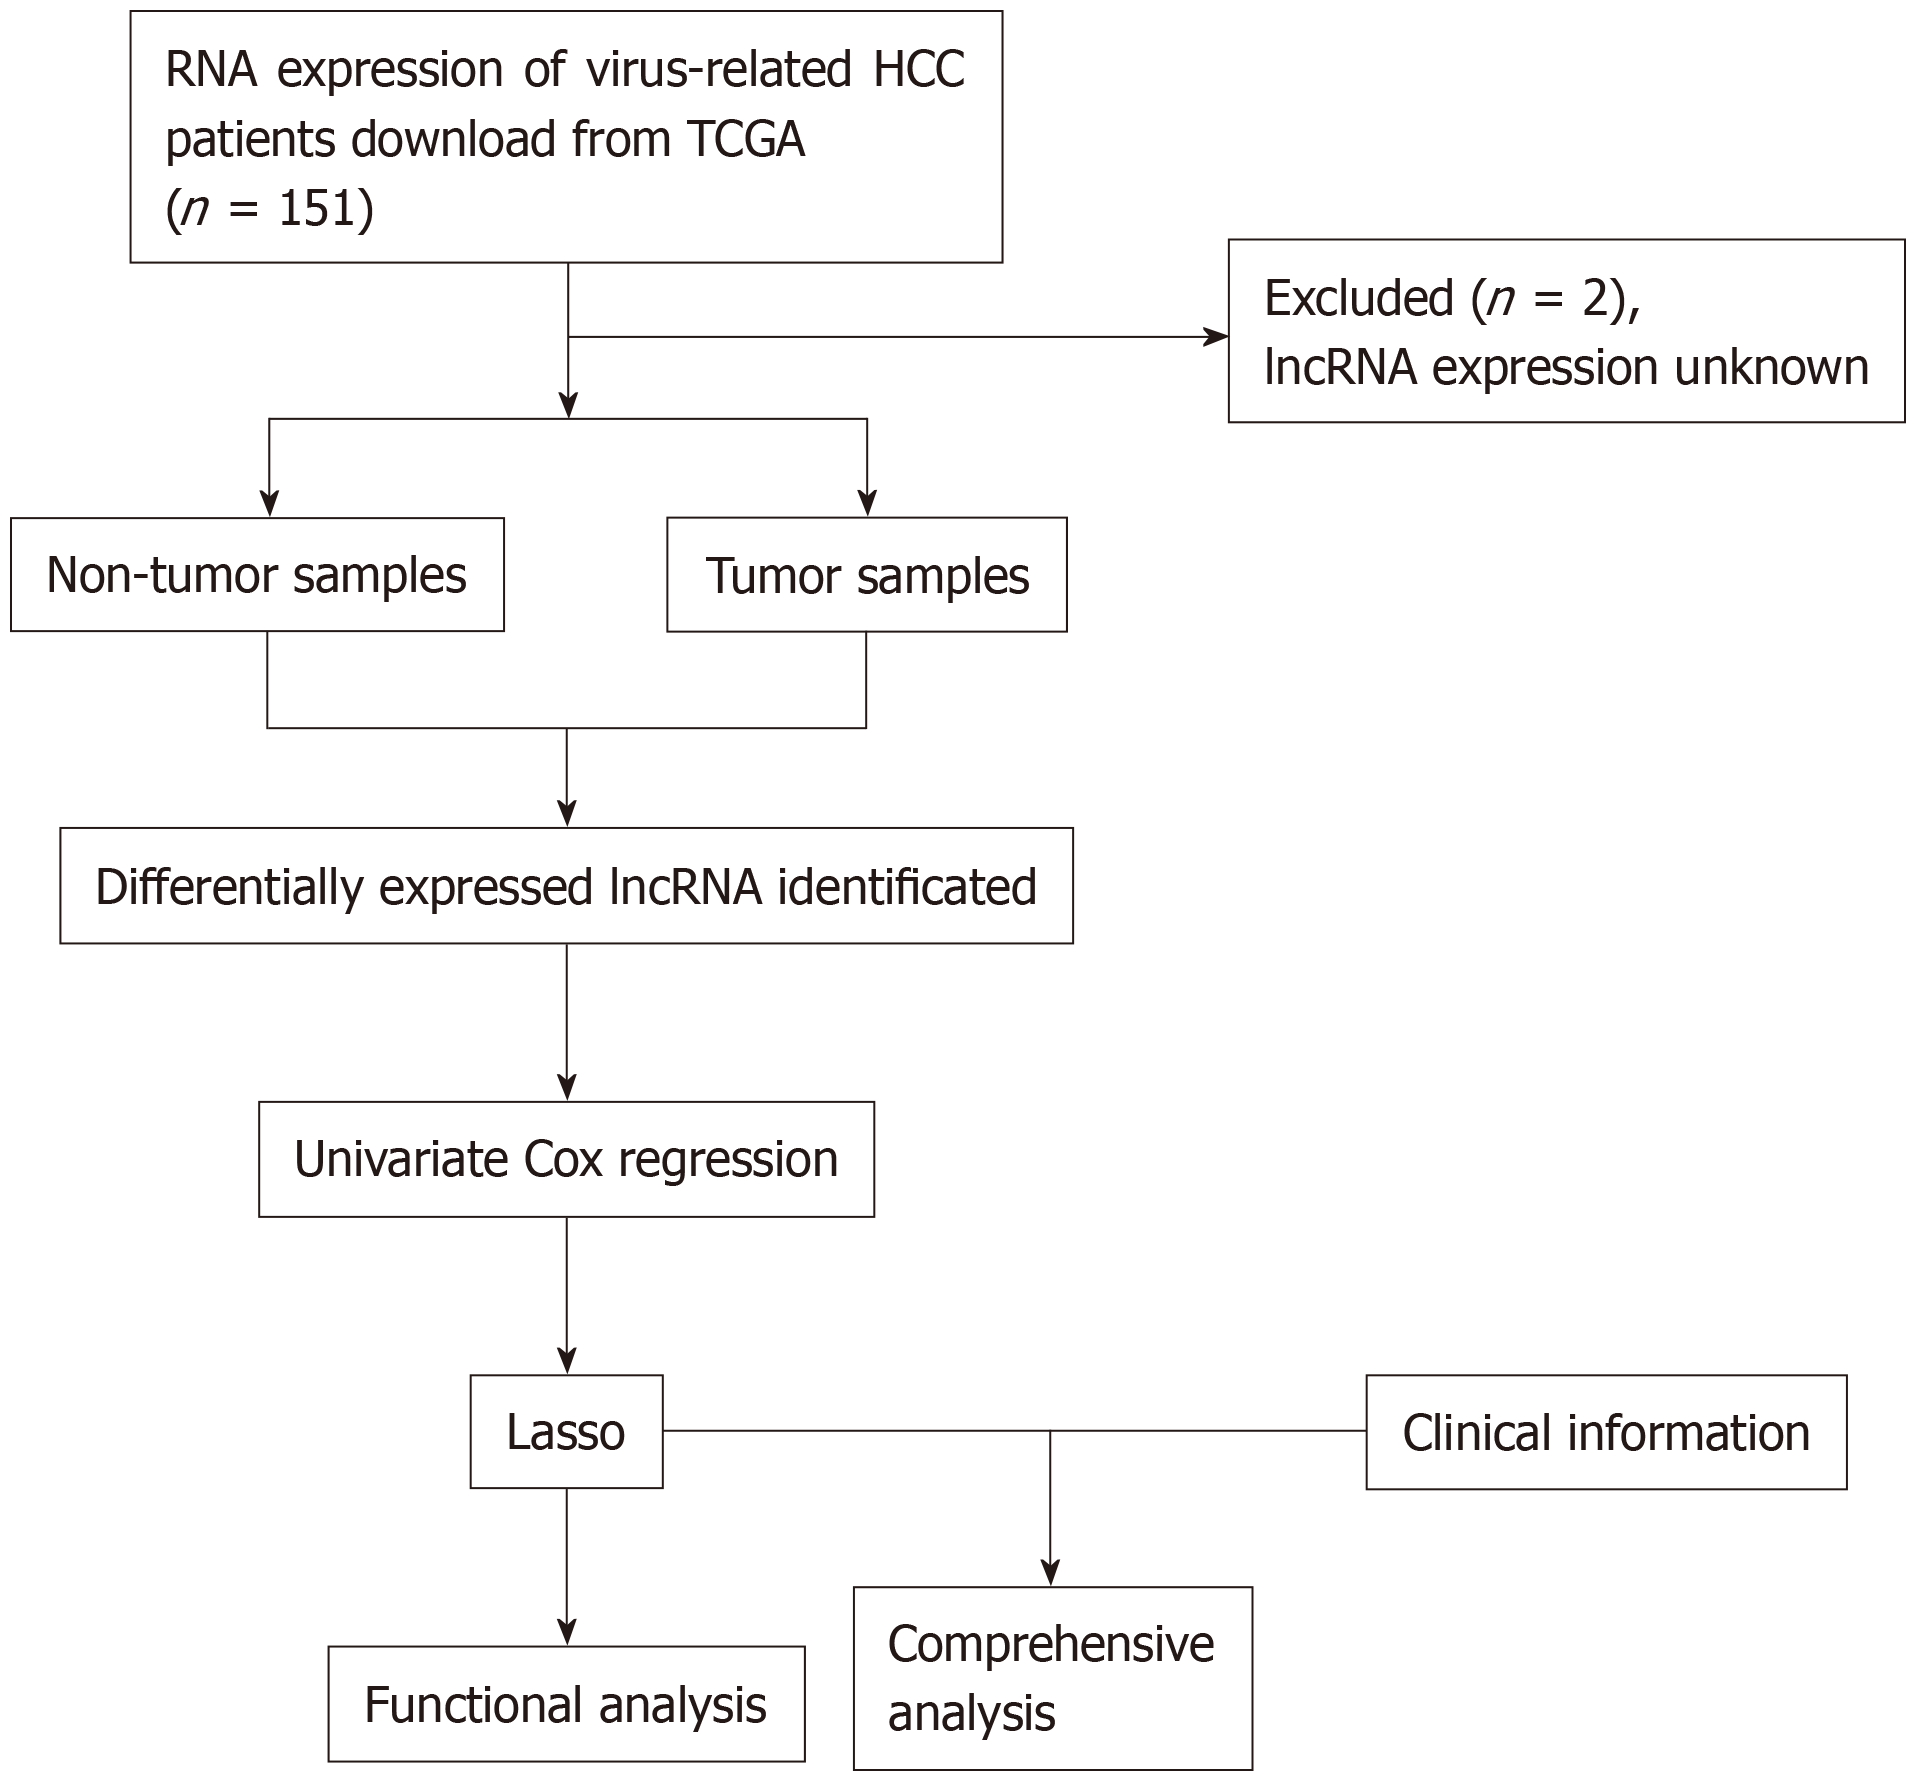
Figure 1 Flowchart of study design.
HCC: Hepatocellular carcinoma; TCGA: The Cancer Genome Atlas; lncRNA: Long non-coding RNAs.
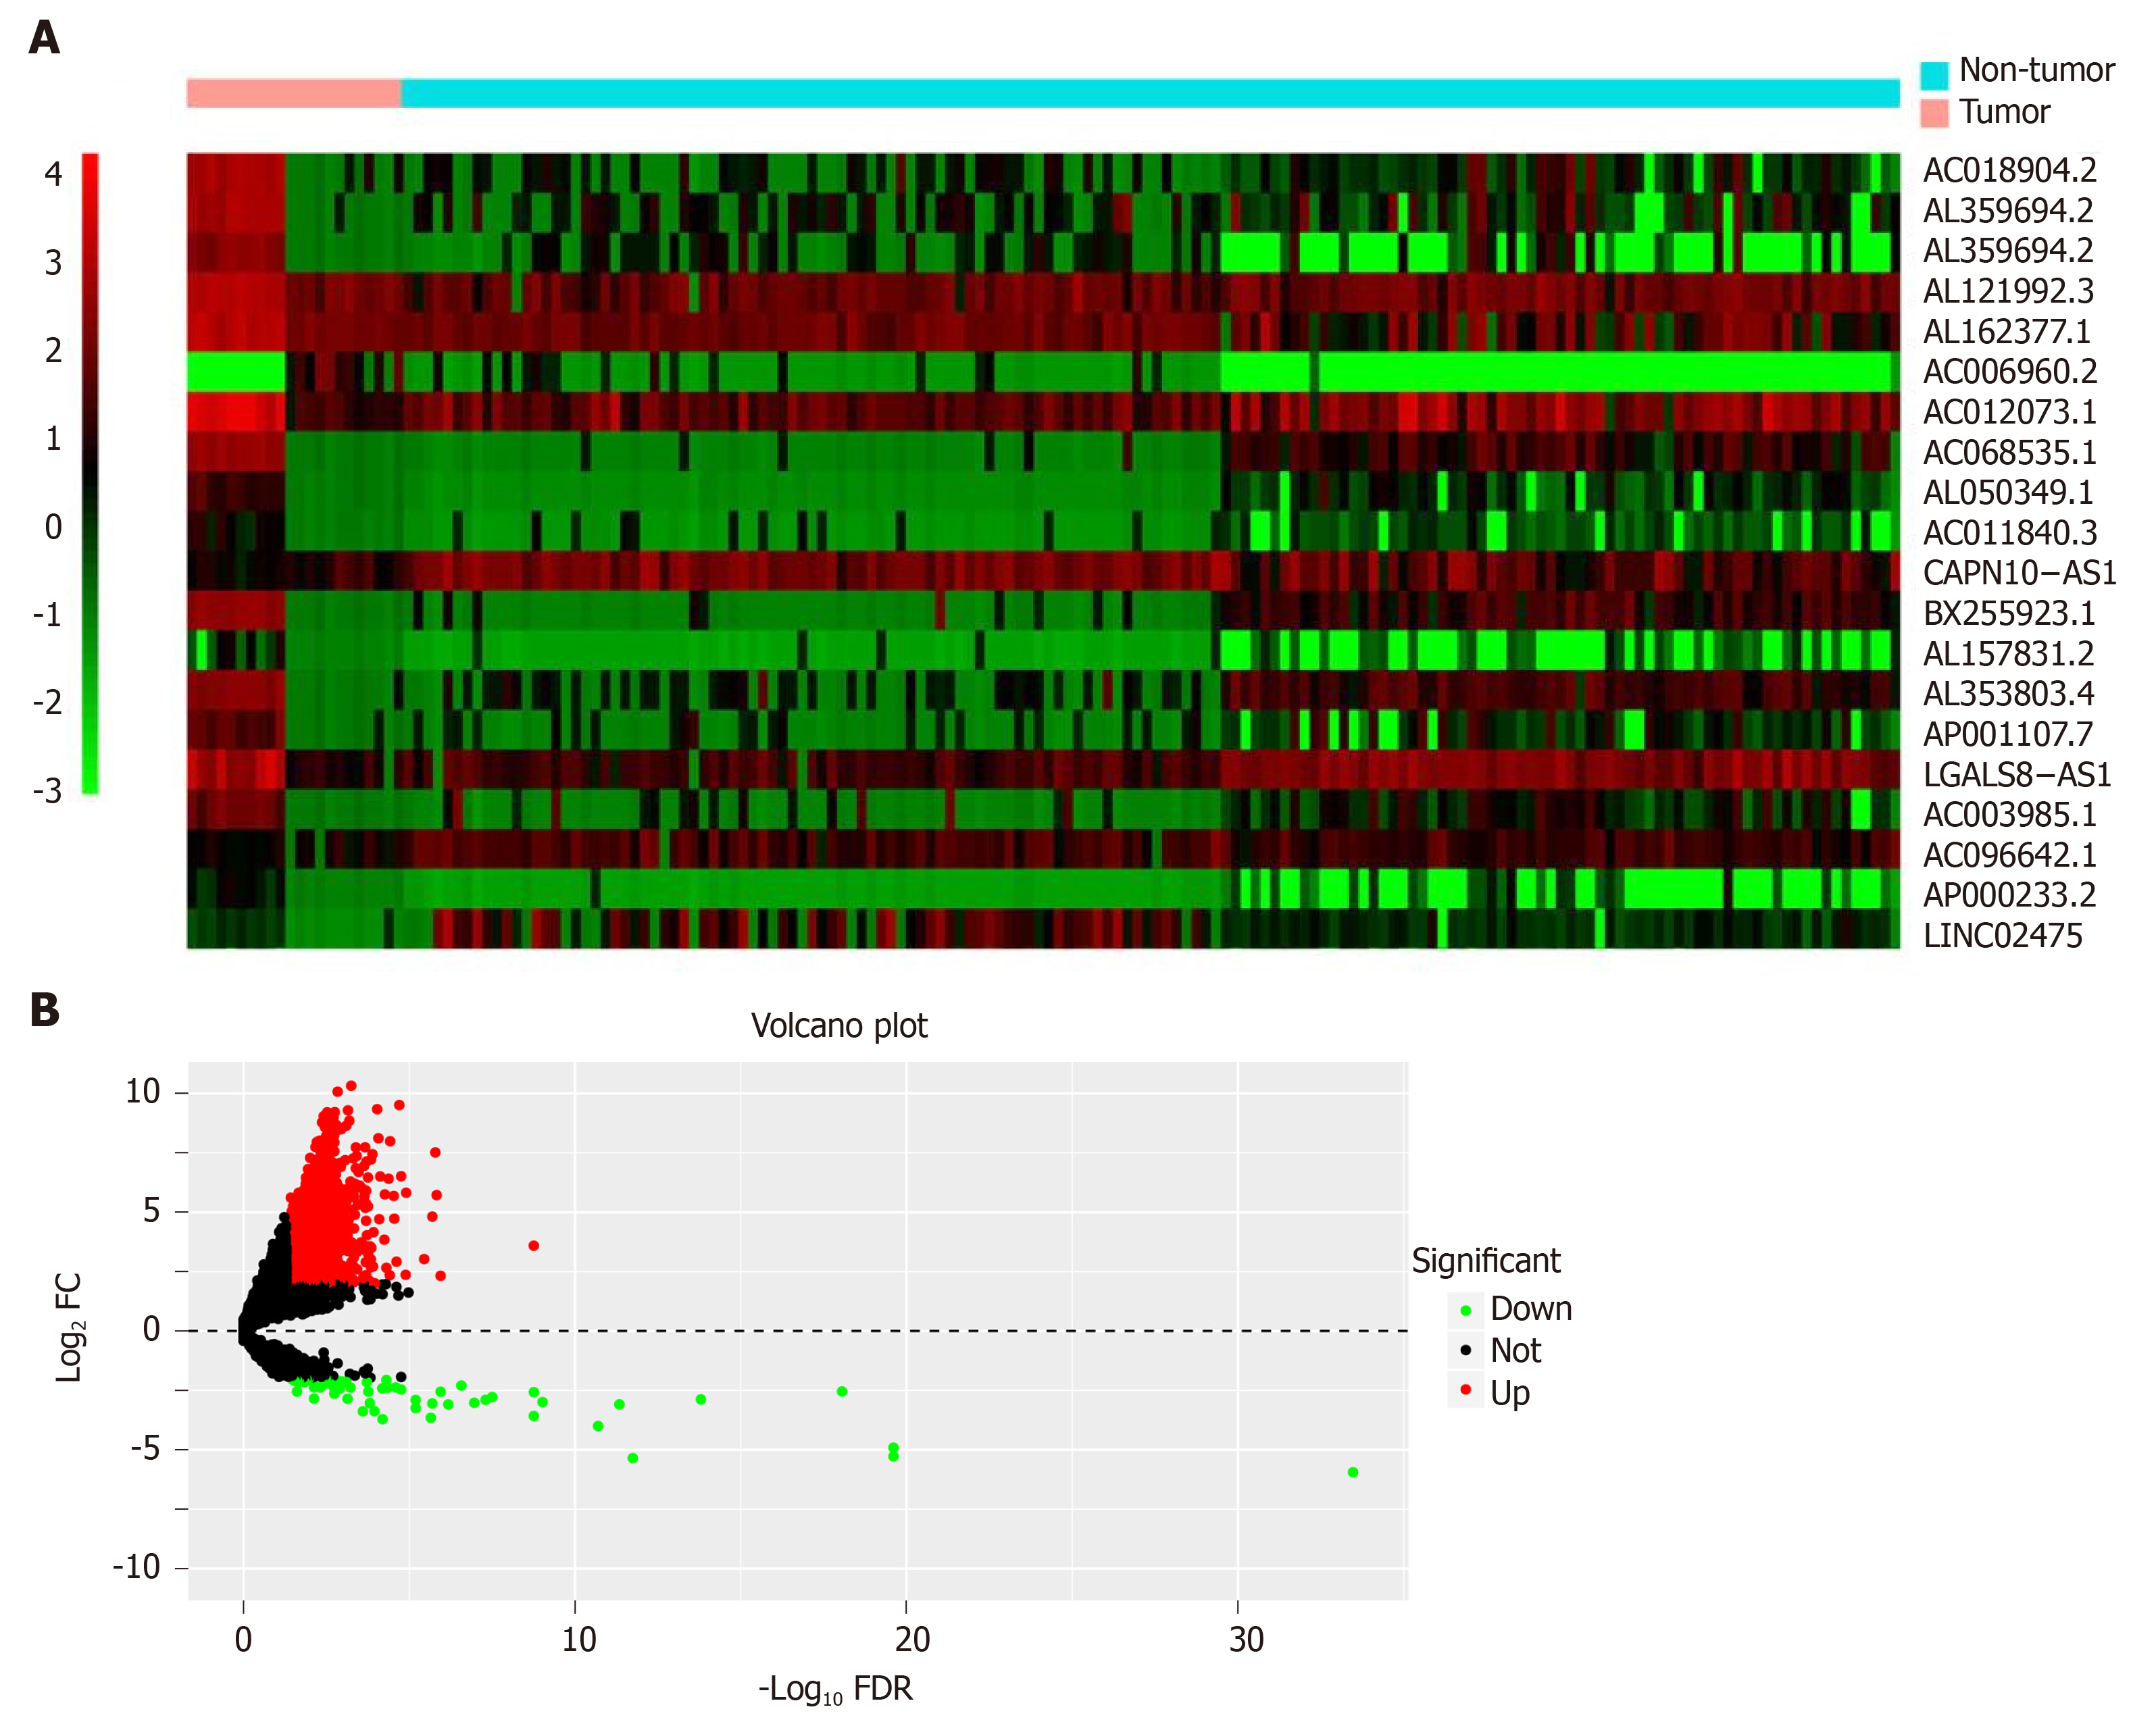
Figure 2 Heat map and volcano plot.
A: Heat map demonstrating the differential expression of long non-coding RNAs (lncRNAs). The X-axis represents the samples, while the Y-axis denotes the differentially expressed lncRNAs. Green color is indicative of the down-regulated genes, while the red color stands for the up-regulated genes; B: Volcano plot showing the differential expression of lncRNAs. The X-axis indicates the false discovery rate values after log transformation, whereas the Y-axis suggests the log2 (fold change) values for lncRNA expression. FDR: False discovery rate; FC: Fold change.
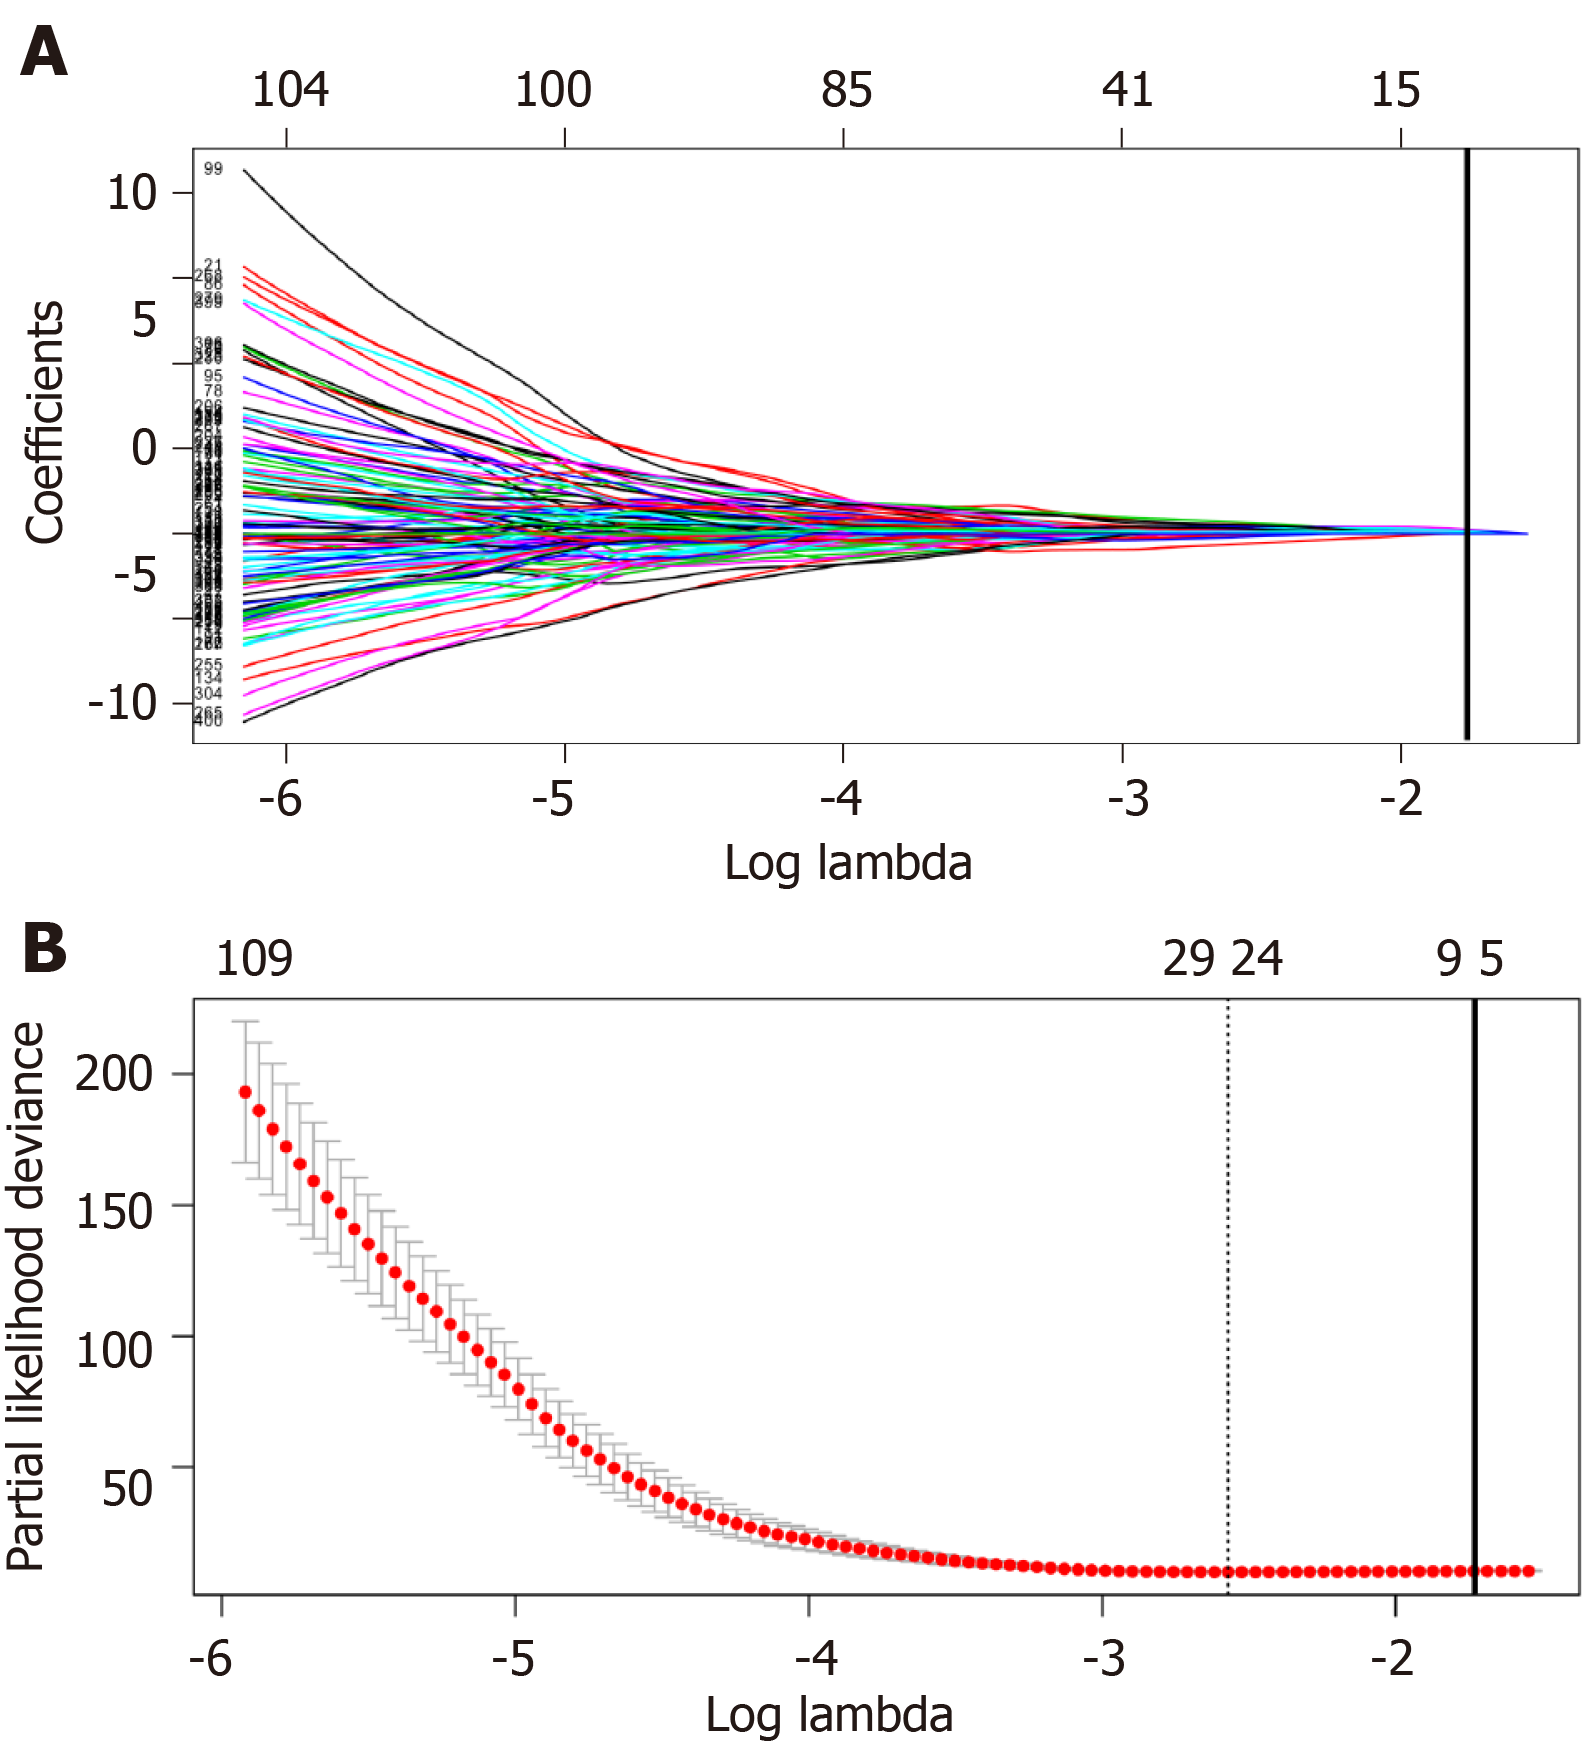
Figure 3 Plots of regression coefficient based on least absolute shrinkage and selection operator regression.
A: Least absolute shrinkage and selection operator (LASSO) coefficient profiles of the fractions of the 406 significant long non-coding RNAs (lncRNAs) in univariate Cox regression analysis. The solid vertical line implies the optimal lambda value determined by cross-validation; B: Cross-validation for tuning parameter selection in the LASSO model. The vertical lines are drawn at the optimal values by minimum criteria and 1-standard error criteria. And the solid vertical line represents that eight lncRNAs were finally determined.
Figure 4 Establishment and verification of a long non-coding RNA signature for predicting the prognosis of hepatitis virus positive hepatocellular carcinoma using the cut-off value 0.
798. A: Distribution of the long non-coding RNA (lncRNA) risk scores; B: Survival status as well as overall survival (OS); C: Kaplan-Meier curve regarding the OS of the high-risk as well as low-risk group classified based on median risk score; D: Receiver operating characteristic curves regarding the 1-, 3-, and 5-year survival discriminated by the lncRNA signature. AUC: Area under the curve.
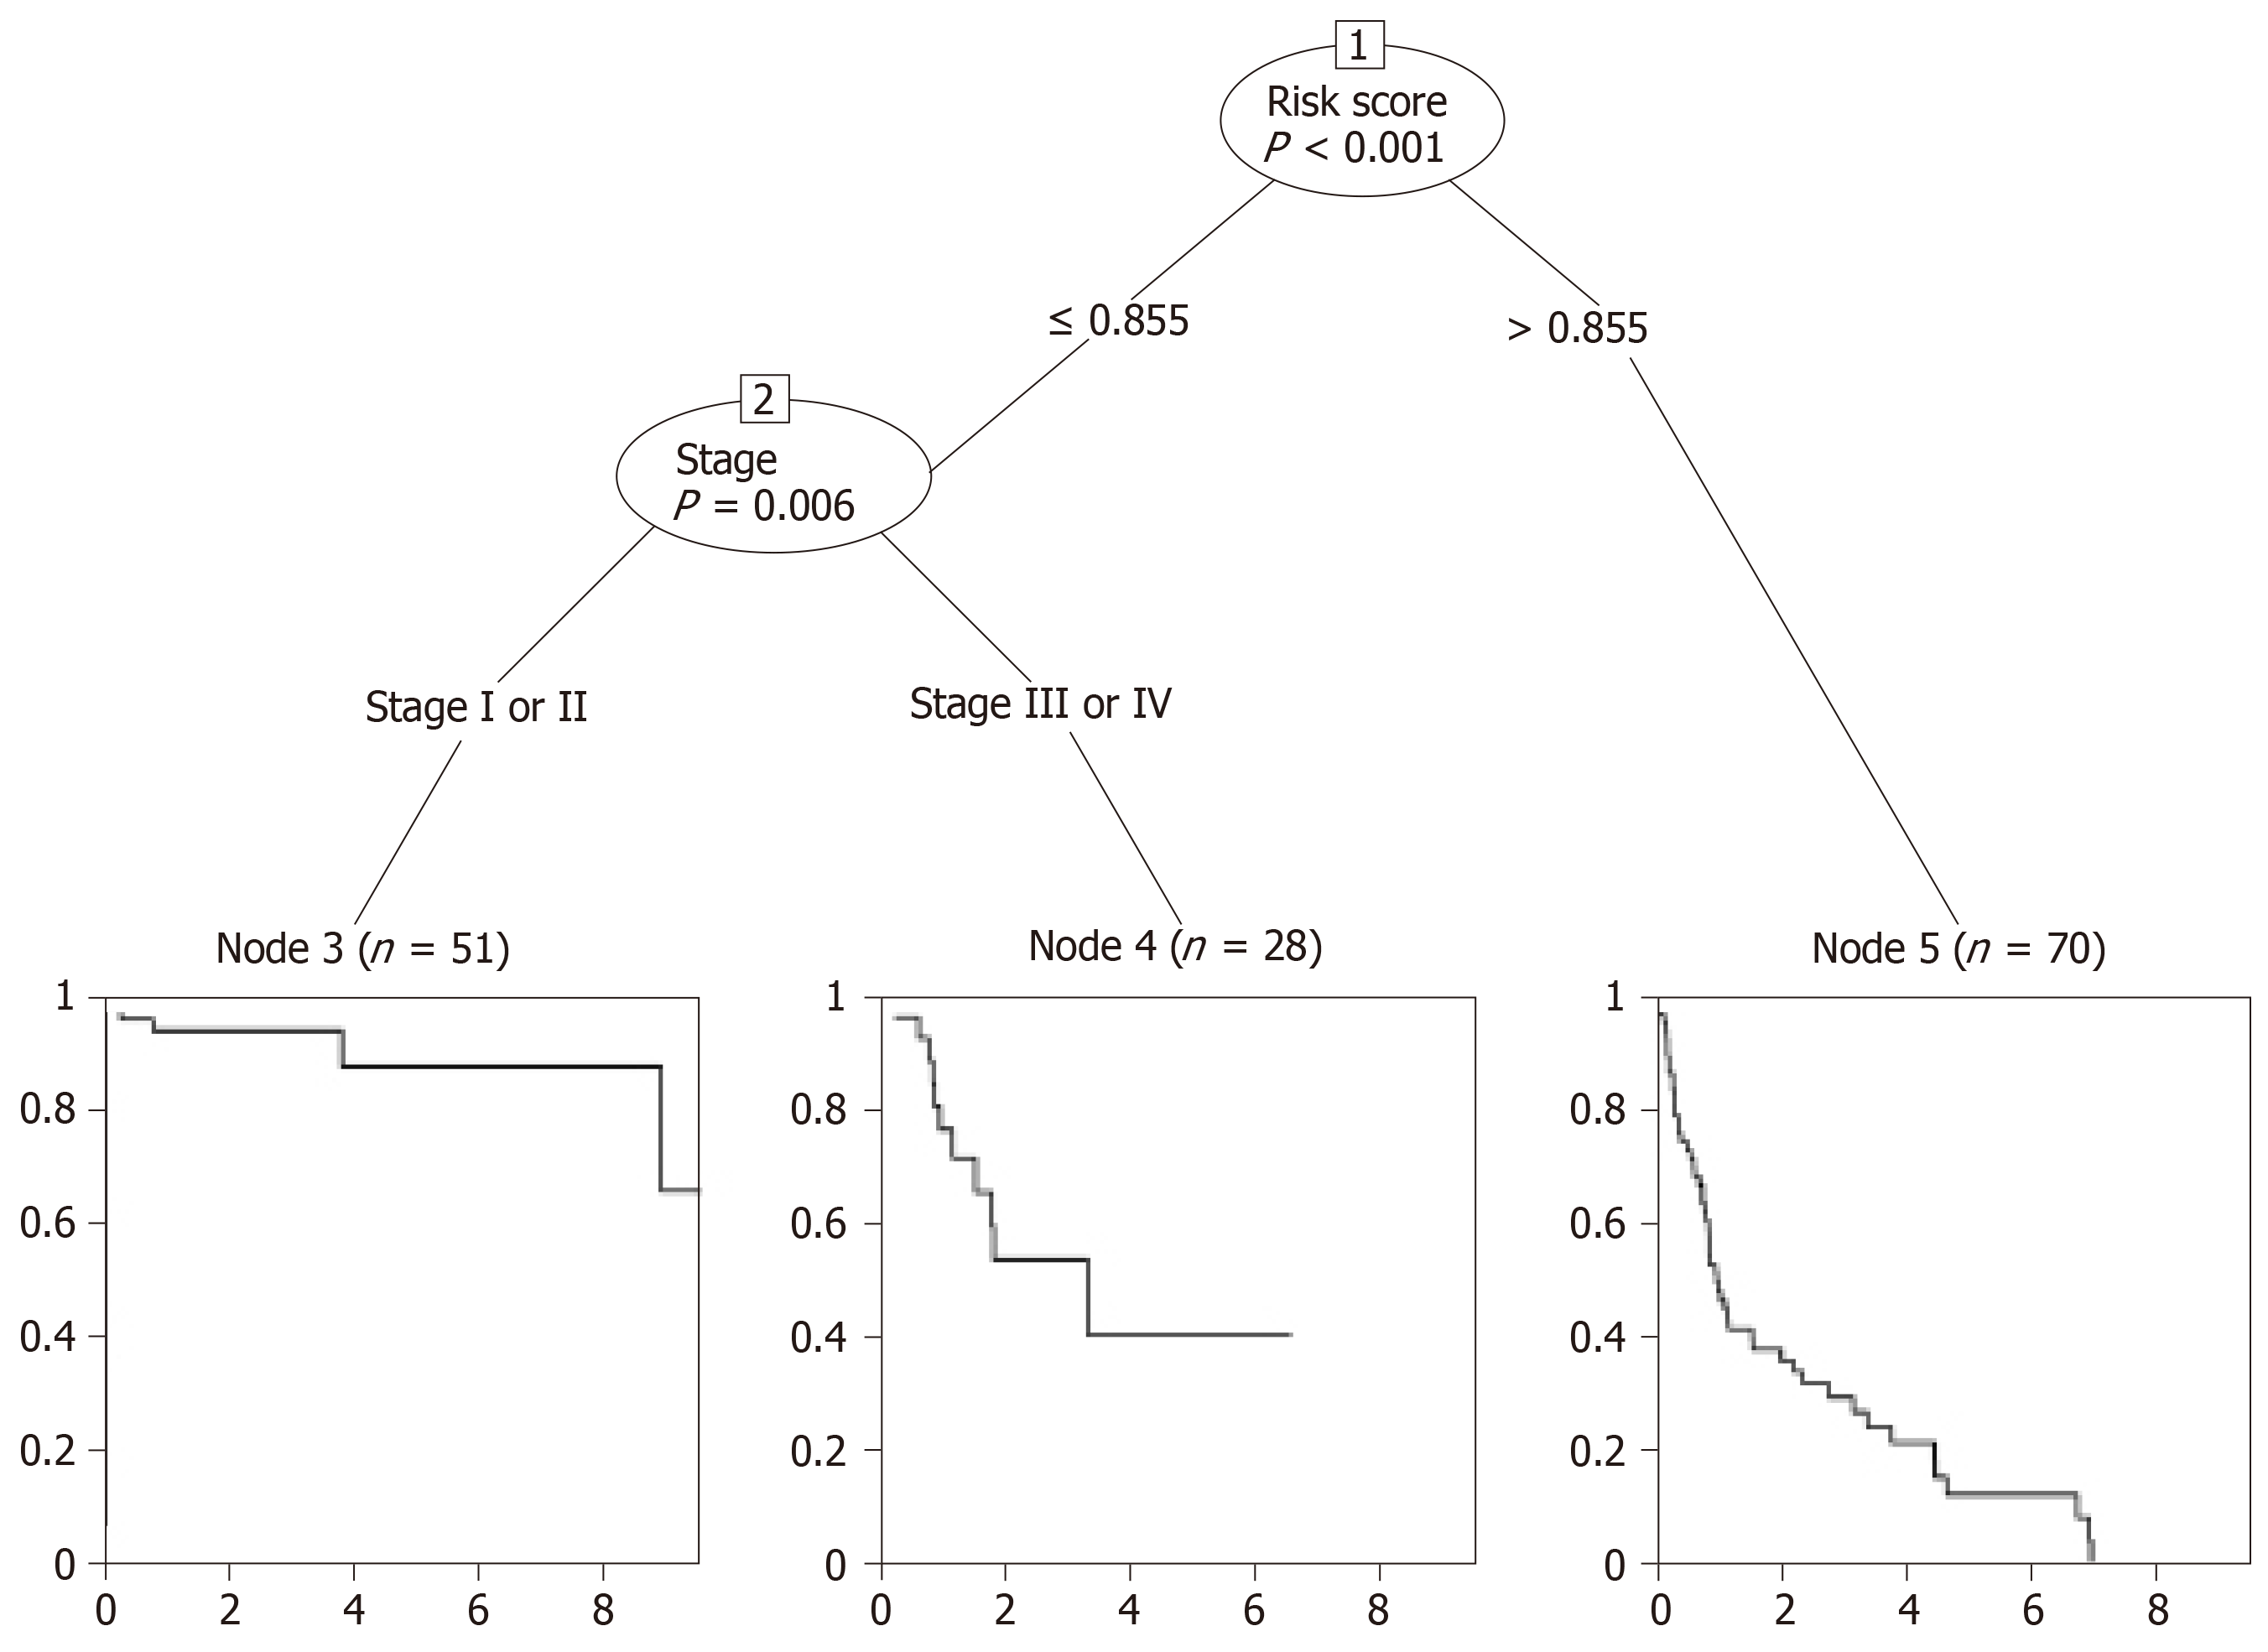
Figure 5 Conditional interference tree for prediction.
The nodes of the conditional inference tree were calculated automatically based on the influence power of variables. The first node of the tree was risk_score, while the second was stage. Node 3, 4, or 5 was the corresponding group a certain patient would be assigned to. For example, a stage I patient with a risk_score ≤ 0.855 would be divided into group node 3, which was related to the best overall survival.
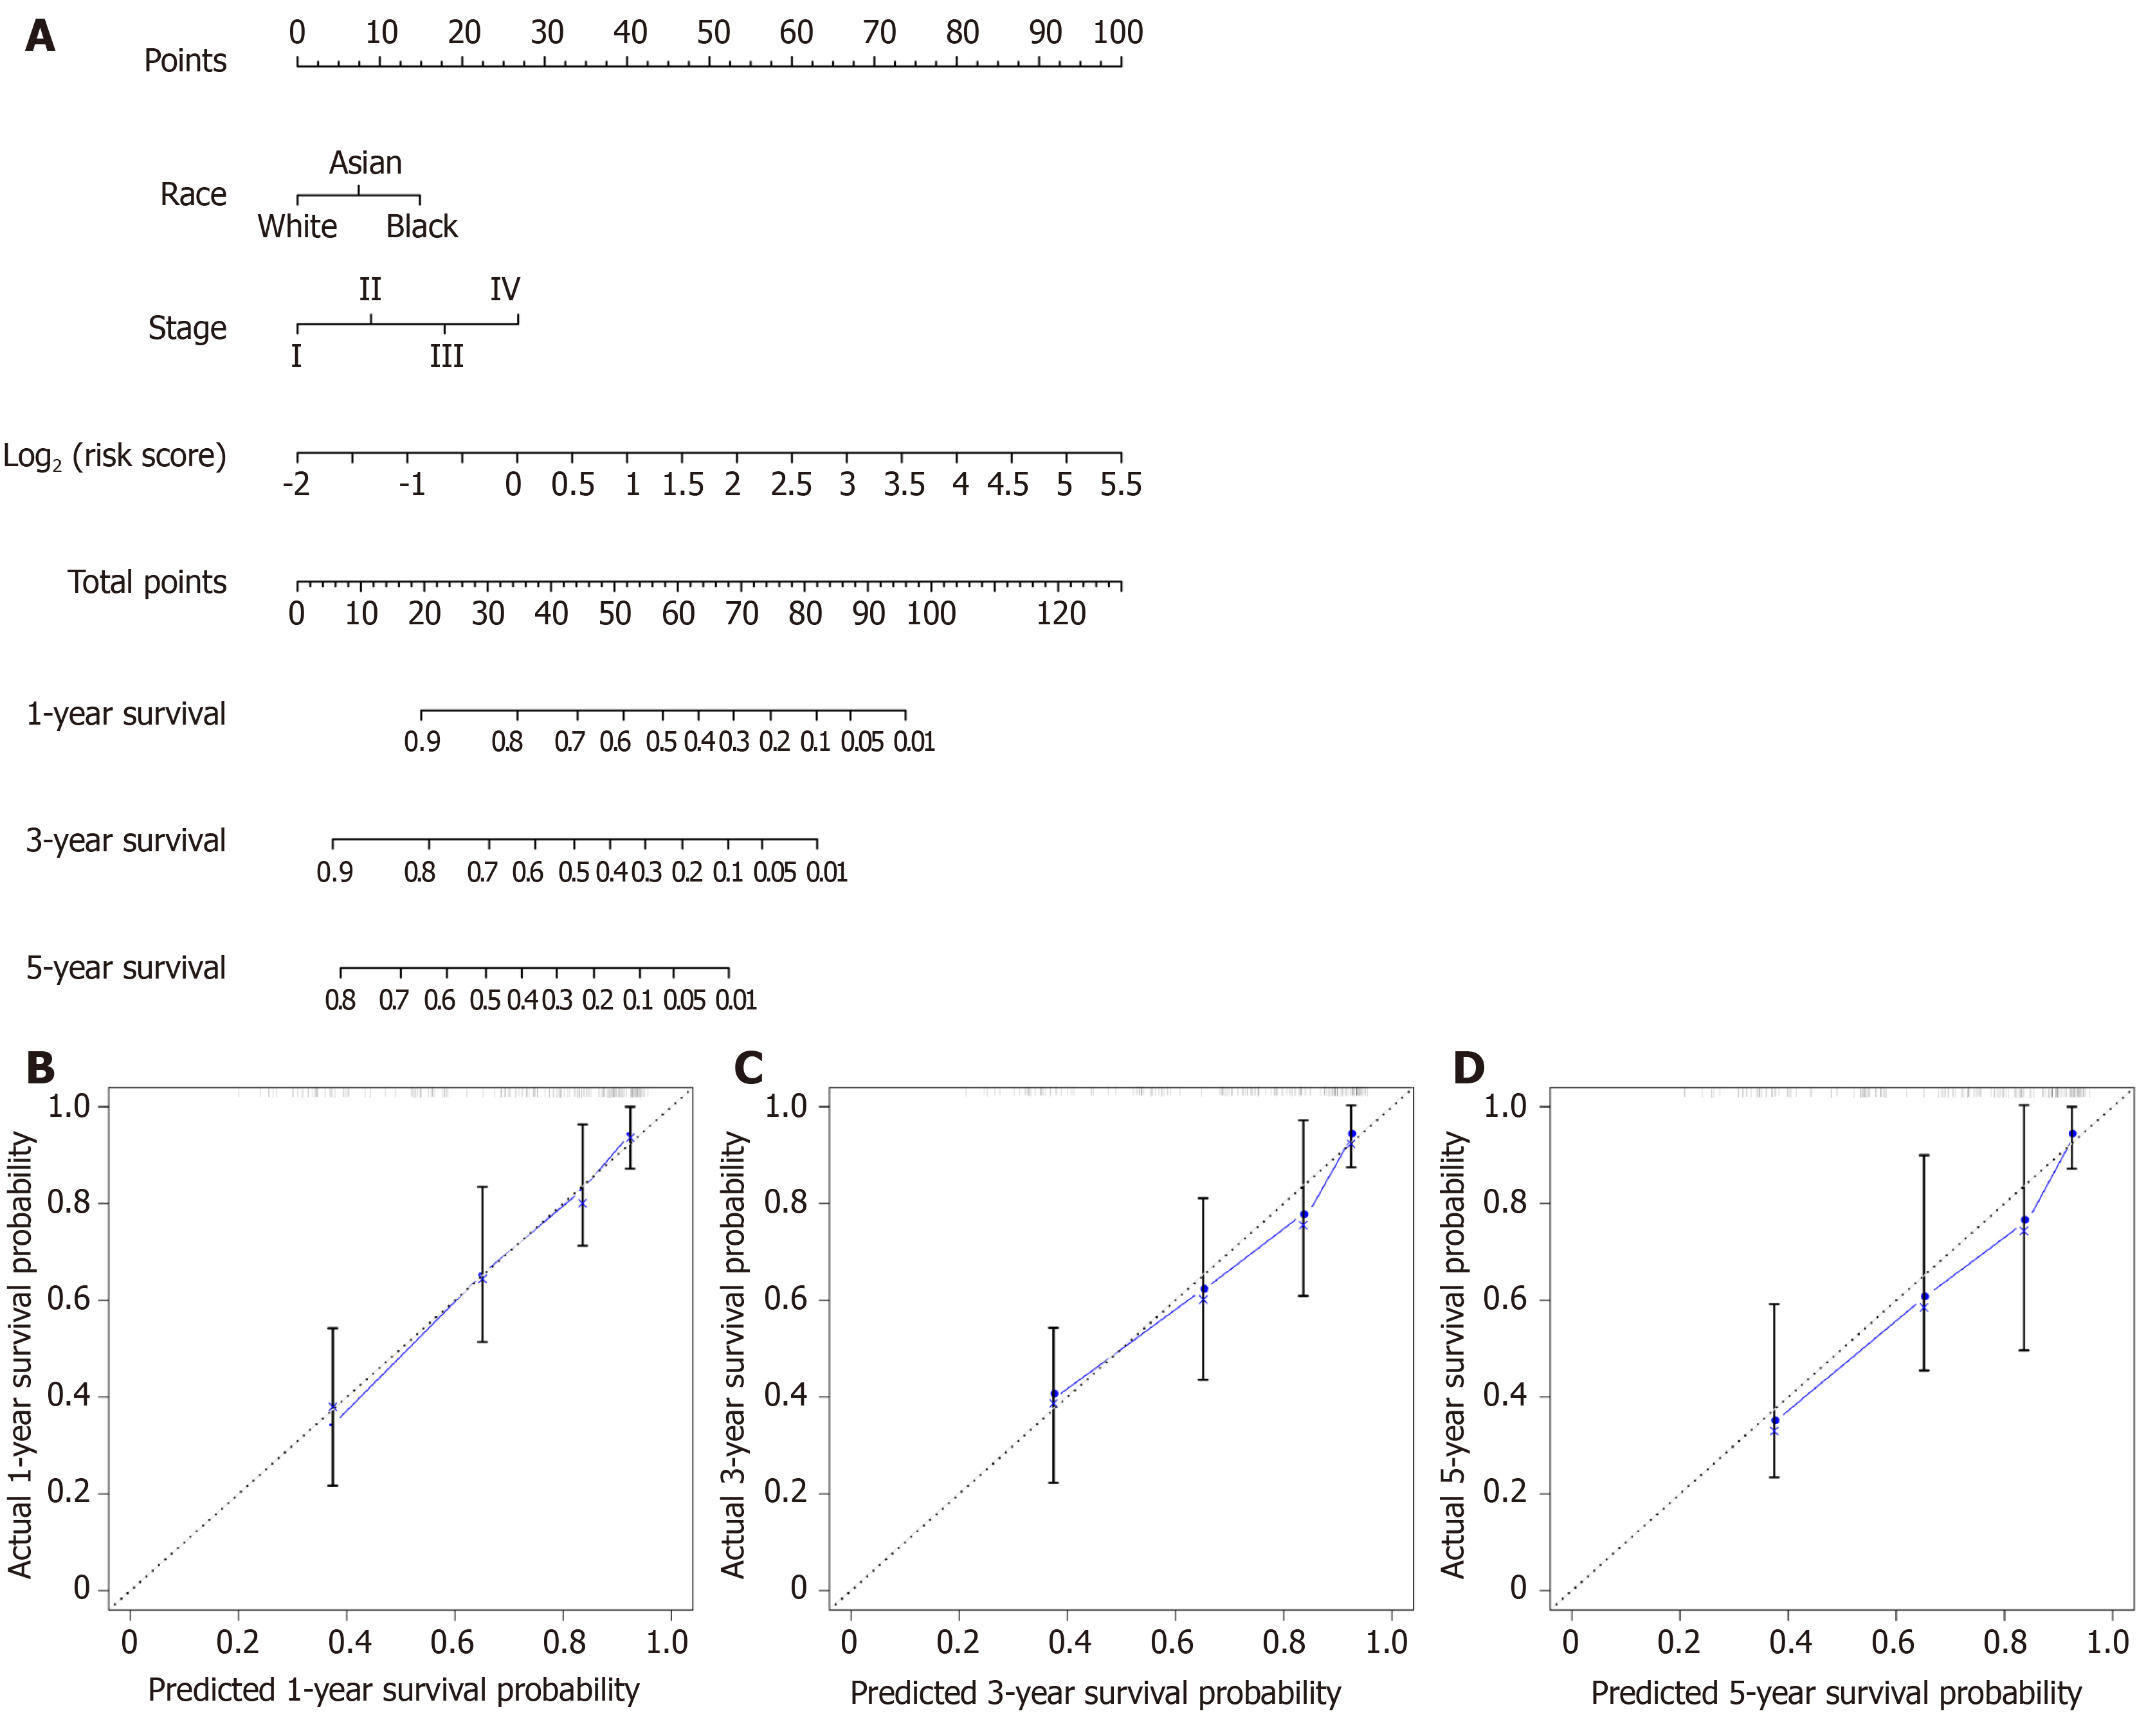
Figure 6 Overall survival nomogram predicting 1-, 3-, and 5-year survival of hepatocellular carcinoma, and calibrated curves to predict the 1-year, 3-years, and 5-year patient survival.
A: Overall survival nomogram predicting 1-, 3-, and 5-year survival of hepatocellular carcinoma; B: Calibrated curve to predict the 1-year patient survival; C: Calibrated curve to predict the 3-years patient survival; D: Calibrated curve to predict the 5-years patient survival. In calibrated curves, the X-axis represents the survival prediction by nomogram, and the Y-axis represents the actual observation which showed a good agreement with prediction.
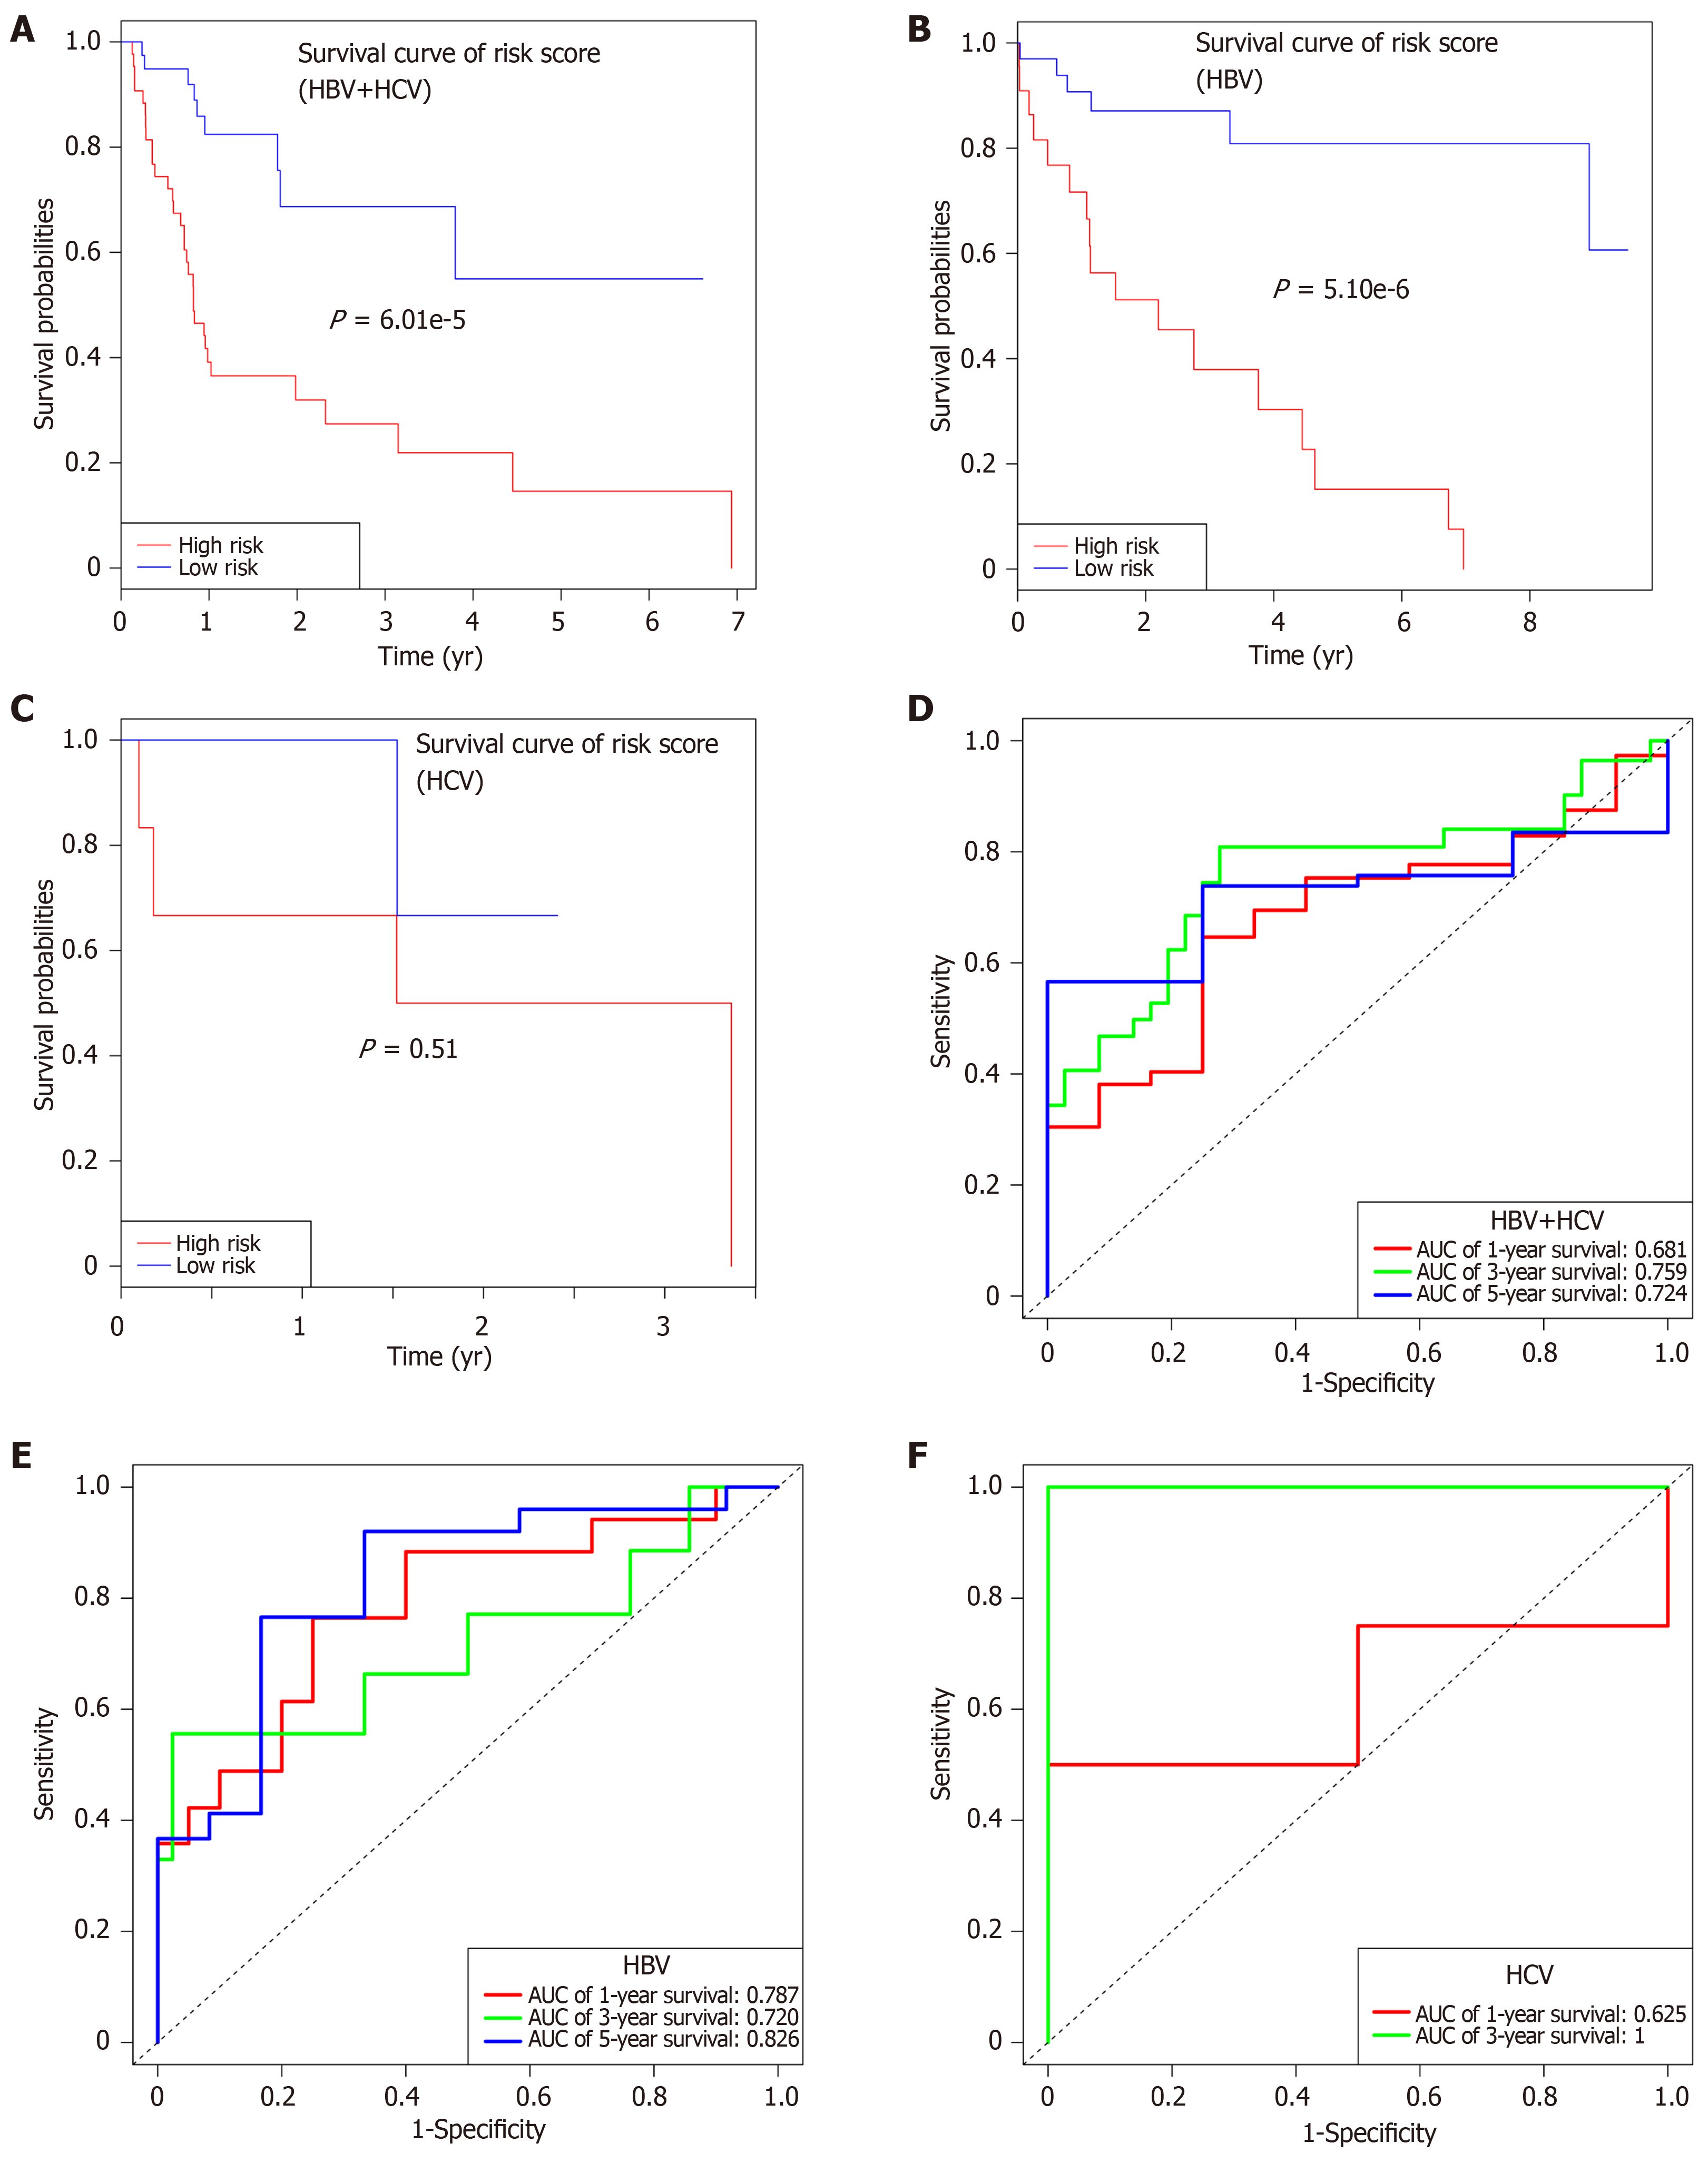
Figure 7 Subgroup analysis regarding the etiology.
A-C: Survival curves of risk_score for hepatitis B virus + hepatitis C virus (HBV + HCV) (A), HBV alone (B), and HCV alone (C) infected patients with HCC; D-F: Receiver operating characteristic curves for HBV + HCV (D), HBV alone (E), and HCV alone (F) infected patients with HCC. HBV: Hepatitis B virus; HCV: Hepatitis C virus.
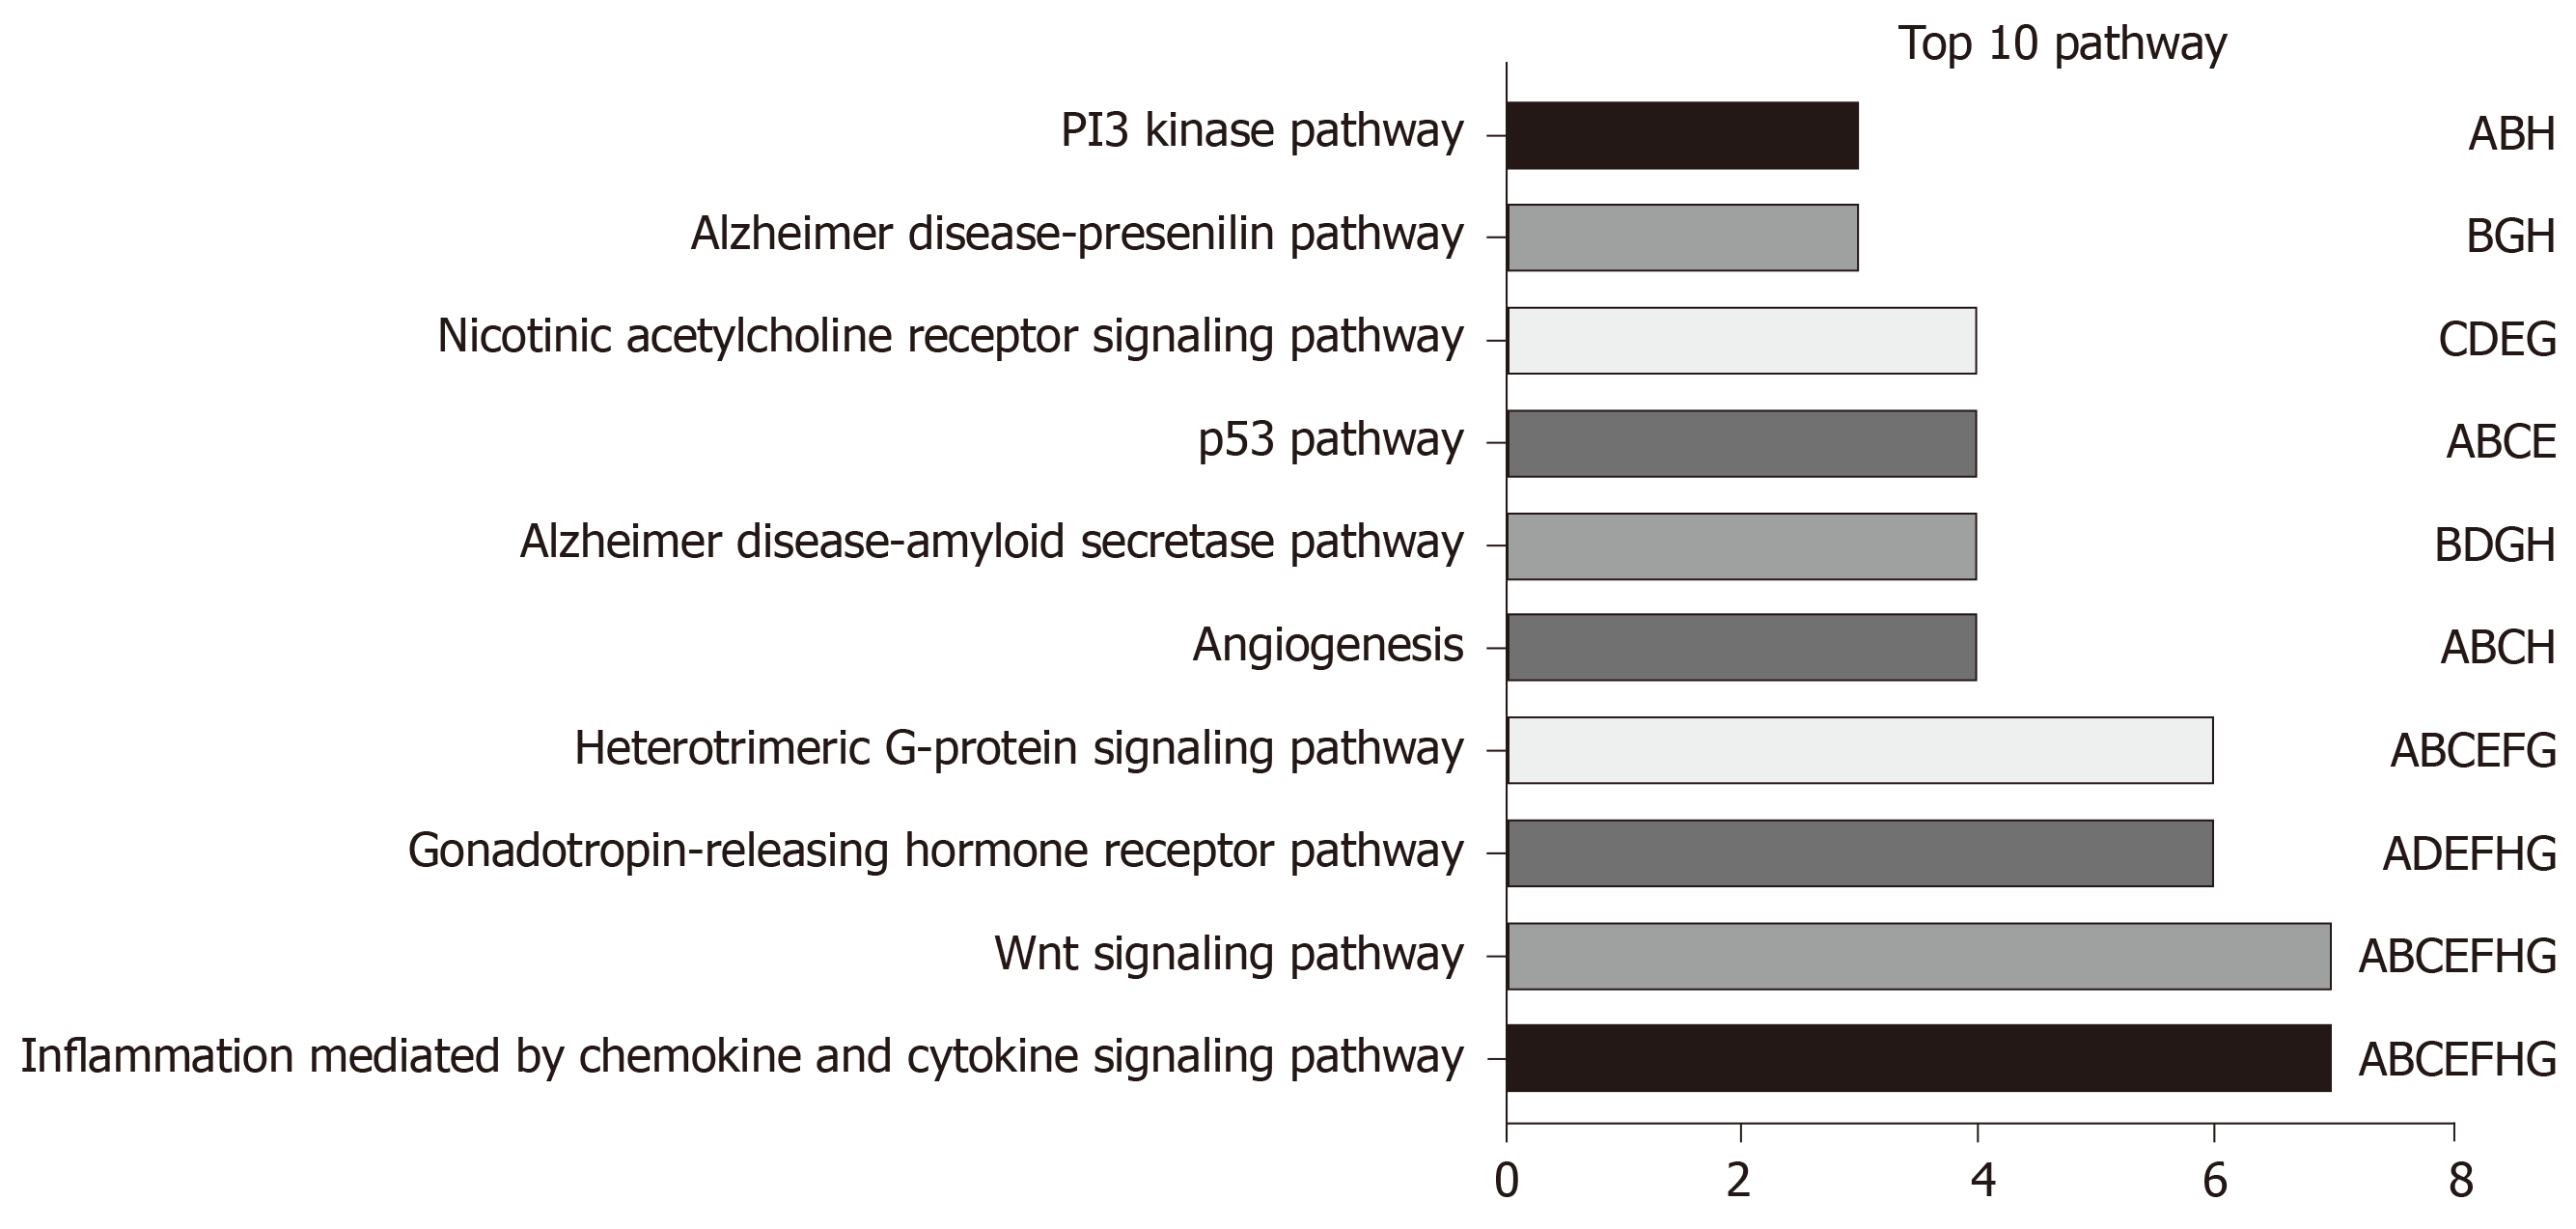
Figure 8 Functional annotations for the eight long non-coding RNAs.
The 10 most remarkable pathways enriched based on the co-expressed mRNAs of eight long non-coding RNAs (lncRNAs). Corresponding lncRNAs involved in the deregulated pathways are also presented. A: AC005722.2; B: AC107959.3; C: AL353803.1; D: AL589182.1; E: AP000844.2; F: AP002478.1; G: FLJ36000; H: NPSR1-AS1.
- Citation: Huang ZL, Li W, Chen QF, Wu PH, Shen LJ. Eight key long non-coding RNAs predict hepatitis virus positive hepatocellular carcinoma as prognostic targets. World J Gastrointest Oncol 2019; 11(11): 983-997
- URL: https://www.wjgnet.com/1948-5204/full/v11/i11/983.htm
- DOI: https://dx.doi.org/10.4251/wjgo.v11.i11.983


