Copyright
©The Author(s) 2019.
World J Gastrointest Oncol. Nov 15, 2019; 11(11): 983-997
Published online Nov 15, 2019. doi: 10.4251/wjgo.v11.i11.983
Published online Nov 15, 2019. doi: 10.4251/wjgo.v11.i11.983
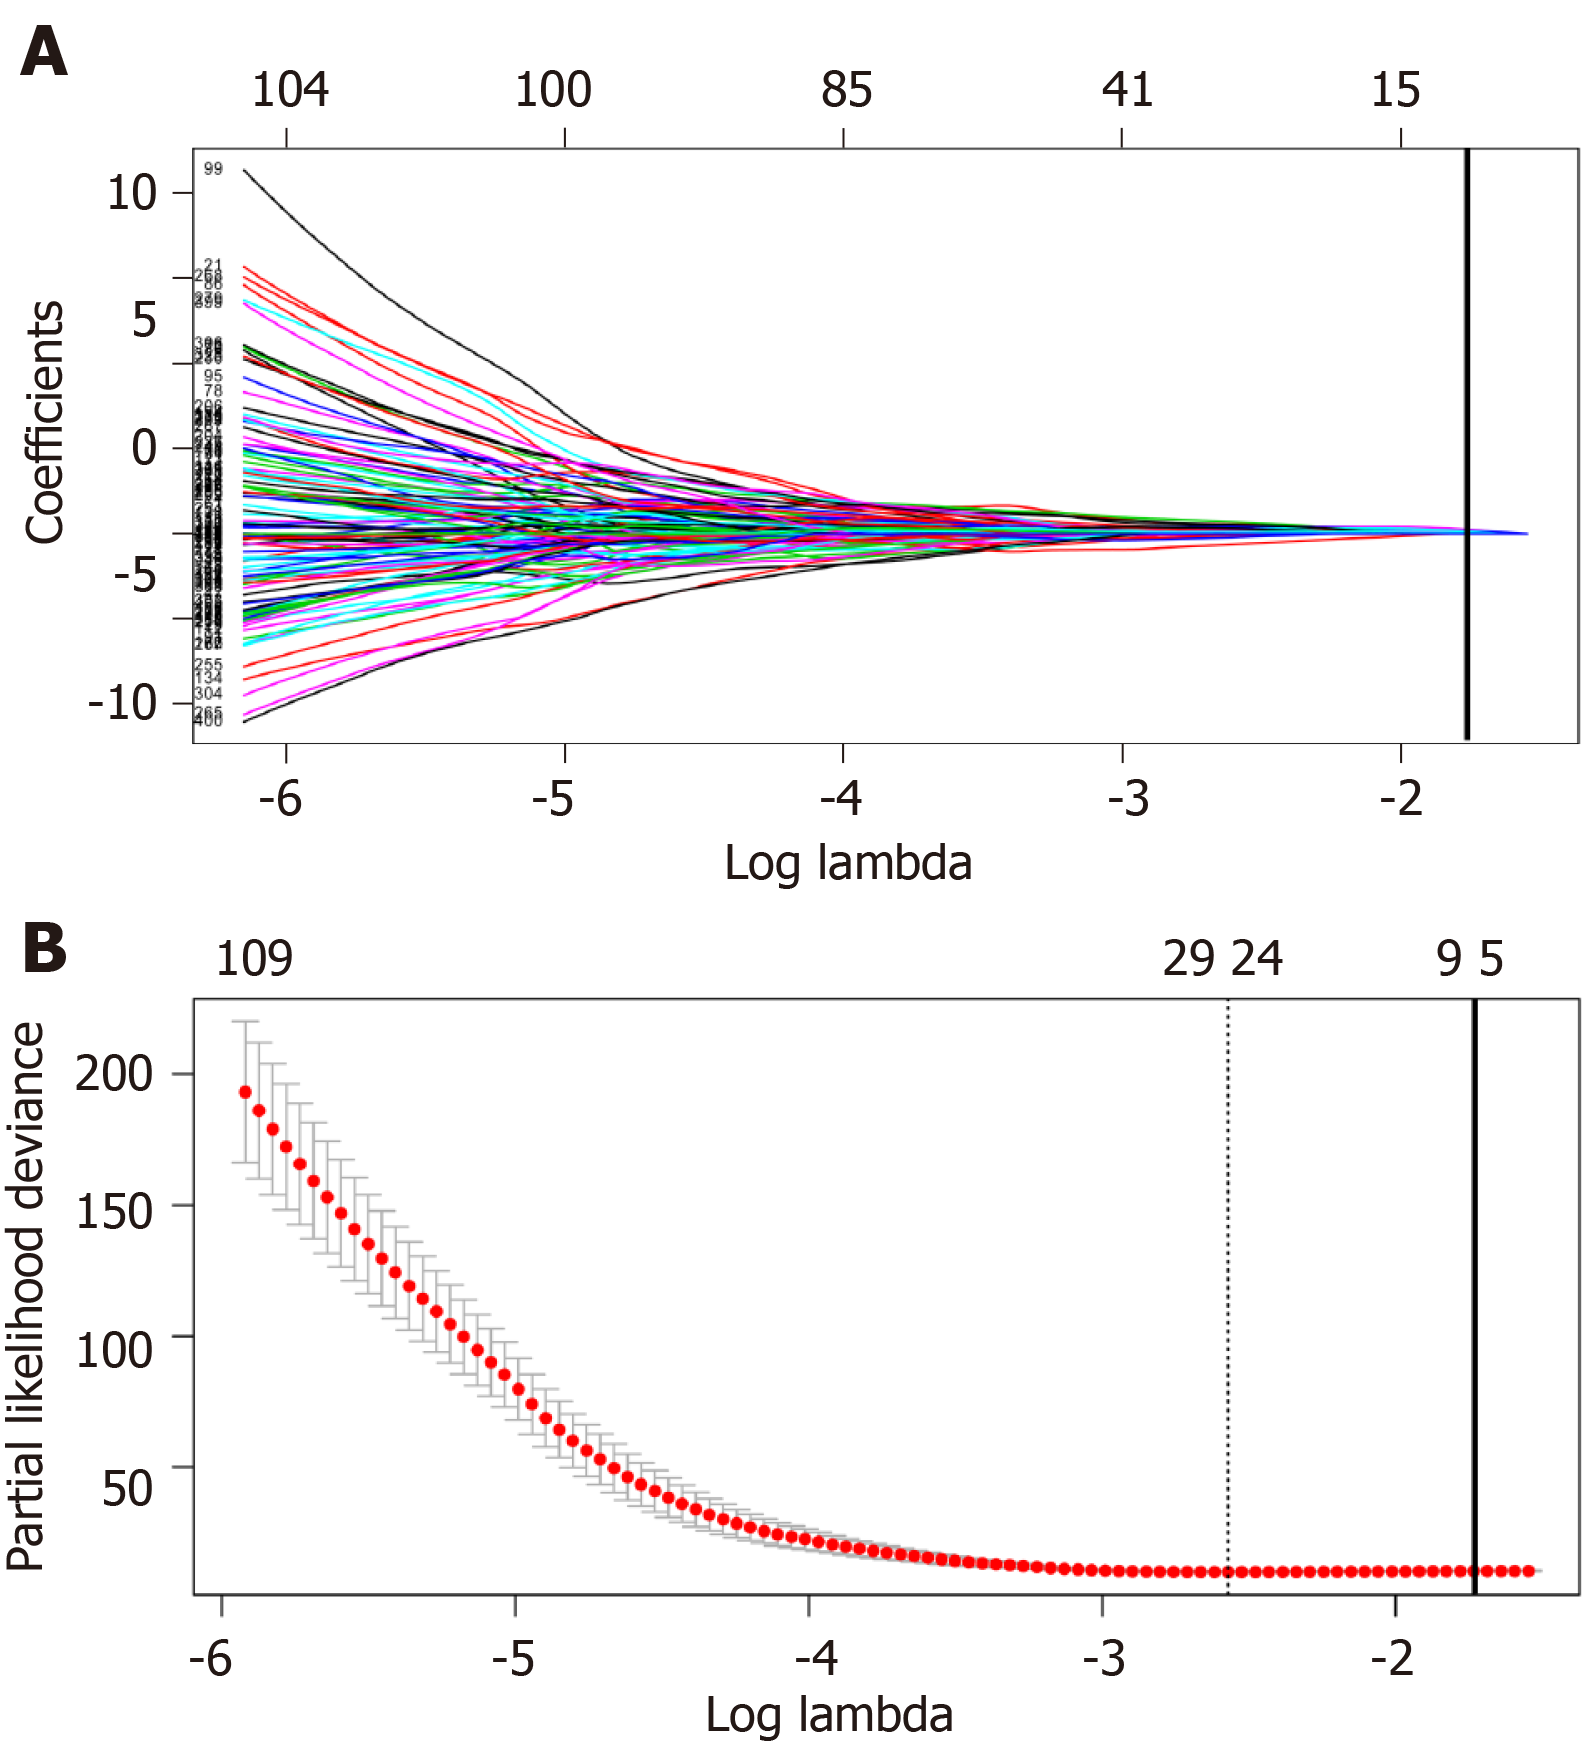
Figure 3 Plots of regression coefficient based on least absolute shrinkage and selection operator regression.
A: Least absolute shrinkage and selection operator (LASSO) coefficient profiles of the fractions of the 406 significant long non-coding RNAs (lncRNAs) in univariate Cox regression analysis. The solid vertical line implies the optimal lambda value determined by cross-validation; B: Cross-validation for tuning parameter selection in the LASSO model. The vertical lines are drawn at the optimal values by minimum criteria and 1-standard error criteria. And the solid vertical line represents that eight lncRNAs were finally determined.
- Citation: Huang ZL, Li W, Chen QF, Wu PH, Shen LJ. Eight key long non-coding RNAs predict hepatitis virus positive hepatocellular carcinoma as prognostic targets. World J Gastrointest Oncol 2019; 11(11): 983-997
- URL: https://www.wjgnet.com/1948-5204/full/v11/i11/983.htm
- DOI: https://dx.doi.org/10.4251/wjgo.v11.i11.983


