Copyright
©The Author(s) 2017.
World J Hepatol. Sep 8, 2017; 9(25): 1064-1072
Published online Sep 8, 2017. doi: 10.4254/wjh.v9.i25.1064
Published online Sep 8, 2017. doi: 10.4254/wjh.v9.i25.1064
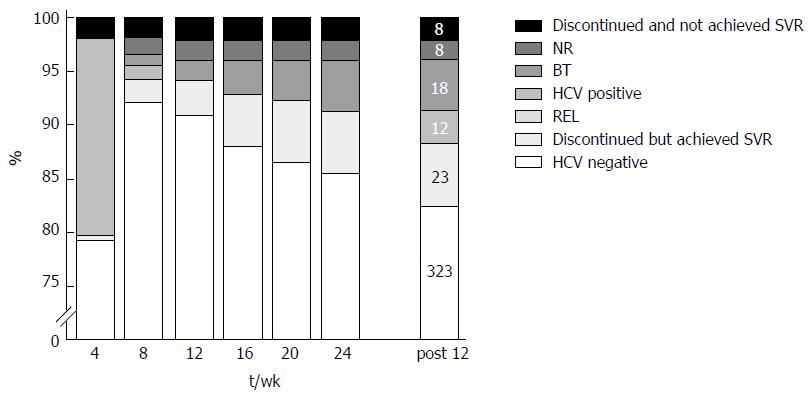
Figure 1 Virological response and treatment outcomes.
Black closed squares indicate the proportion of patients who discontinued treatment because of adverse events and unachieved SVR12. Non-response (NR), where HCV RNA remained detectable during treatment, prompting treatment discontinuation. Breakthrough (BT), where HCV RNA was undetectable but reappeared during treatment. Relapse (REL), where HCV RNA was undetectable at the end of the treatment but became quantifiable again during follow-up. Gray closed squares indicate the proportion of patients with HCV RNA detected at the time of measurement. Light gray square indicate the proportion of patients who discontinued treatment because of adverse events but nevertheless achieved SVR12. White closed squares indicate the proportion of patients whose HCV RNA viral loads were undetected at the time of measurement. The Post 12 wk bar indicates the number of patients in each square.
- Citation: Fujii H, Umemura A, Nishikawa T, Yamaguchi K, Moriguchi M, Nakamura H, Yasui K, Minami M, Tanaka S, Ishikawa H, Kimura H, Takami S, Nagao Y, Shima T, Itoh Y. Real-world efficacy of daclatasvir and asunaprevir with respect to resistance-associated substitutions. World J Hepatol 2017; 9(25): 1064-1072
- URL: https://www.wjgnet.com/1948-5182/full/v9/i25/1064.htm
- DOI: https://dx.doi.org/10.4254/wjh.v9.i25.1064


