Copyright
©The Author(s) 2016.
World J Hepatol. Feb 28, 2016; 8(6): 340-344
Published online Feb 28, 2016. doi: 10.4254/wjh.v8.i6.340
Published online Feb 28, 2016. doi: 10.4254/wjh.v8.i6.340
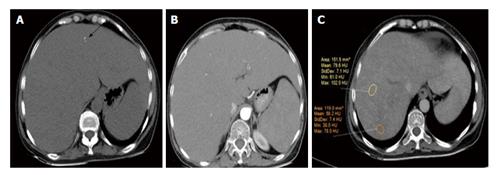
Figure 1 Pre-contrast computed tomography image of abdomen.
A: Gross hepatomegaly with tiny foci of calcification in segment IV of liver (black arrow); arterial phase; B: Diffuse low contrast attenuation; C: Venous show heterogeneous contrast enhancement with diffuse low density areas scattered throughout liver parenchyma (yellow and orange spherical).
- Citation: Sonthalia N, Jain S, Pawar S, Zanwar V, Surude R, Rathi PM. Primary hepatic amyloidosis: A case report and review of literature. World J Hepatol 2016; 8(6): 340-344
- URL: https://www.wjgnet.com/1948-5182/full/v8/i6/340.htm
- DOI: https://dx.doi.org/10.4254/wjh.v8.i6.340


