
















©The Author(s) 2016.
World J Hepatol. Jun 8, 2016; 8(16): 673-684
Published online Jun 8, 2016. doi: 10.4254/wjh.v8.i16.673
Published online Jun 8, 2016. doi: 10.4254/wjh.v8.i16.673
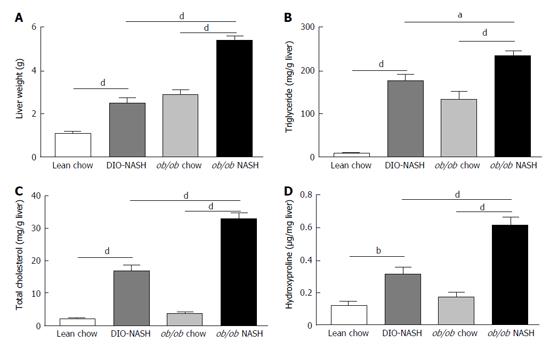
Figure 3 Liver weight and hepatic lipid and collagen content at study end.
Liver weight at termination (A), hepatic triglyceride content (B), hepatic total cholesterol content (C), and hepatic hydroxyproline (collagen) content (D) at study end. aP < 0.05, bP < 0.01, dP < 0.001. The results are presented as mean ± SEM. Lean chow (n = 9), DIO-NASH (n = 12), ob/ob chow (n = 8), ob/ob NASH (n = 10). NASH: Nonalcoholic steatohepatitis; BW: Body weight; SEM: Standard error of the mean.
- Citation: Kristiansen MNB, Veidal SS, Rigbolt KTG, Tølbøl KS, Roth JD, Jelsing J, Vrang N, Feigh M. Obese diet-induced mouse models of nonalcoholic steatohepatitis-tracking disease by liver biopsy. World J Hepatol 2016; 8(16): 673-684
- URL: https://www.wjgnet.com/1948-5182/full/v8/i16/673.htm
- DOI: https://dx.doi.org/10.4254/wjh.v8.i16.673