Copyright
©2010 Baishideng.
World J Hepatol. Jun 27, 2010; 2(6): 221-225
Published online Jun 27, 2010. doi: 10.4254/wjh.v2.i6.221
Published online Jun 27, 2010. doi: 10.4254/wjh.v2.i6.221
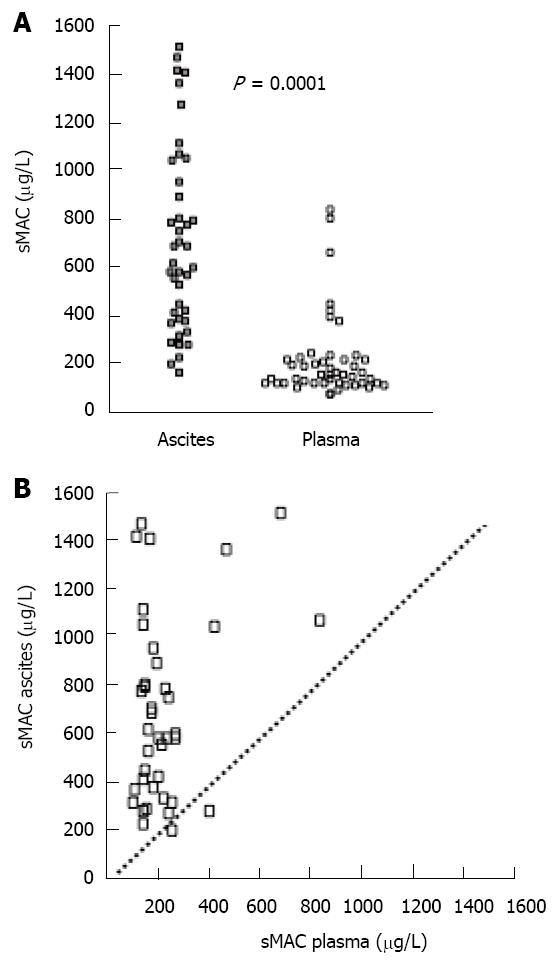
Figure 2 sMAC levels in cirrhotic patients.
A: Levels of sMAC in ascites (Grey Square) compared with plasma (White Square); B: Ascitic sMAC vs plasma sMAC. Each dot represents an individual and the dashed line indicates line of identity.
- Citation: Bjerre M, Holland-Fischer P, Grønbæk H, Frystyk J, Hansen TK, Vilstrup H, Flyvbjerg A. Soluble membrane attack complex in ascites in patients with liver cirrhosis without infections. World J Hepatol 2010; 2(6): 221-225
- URL: https://www.wjgnet.com/1948-5182/full/v2/i6/221.htm
- DOI: https://dx.doi.org/10.4254/wjh.v2.i6.221


