Copyright
©The Author(s) 2024.
World J Hepatol. Mar 27, 2024; 16(3): 439-451
Published online Mar 27, 2024. doi: 10.4254/wjh.v16.i3.439
Published online Mar 27, 2024. doi: 10.4254/wjh.v16.i3.439
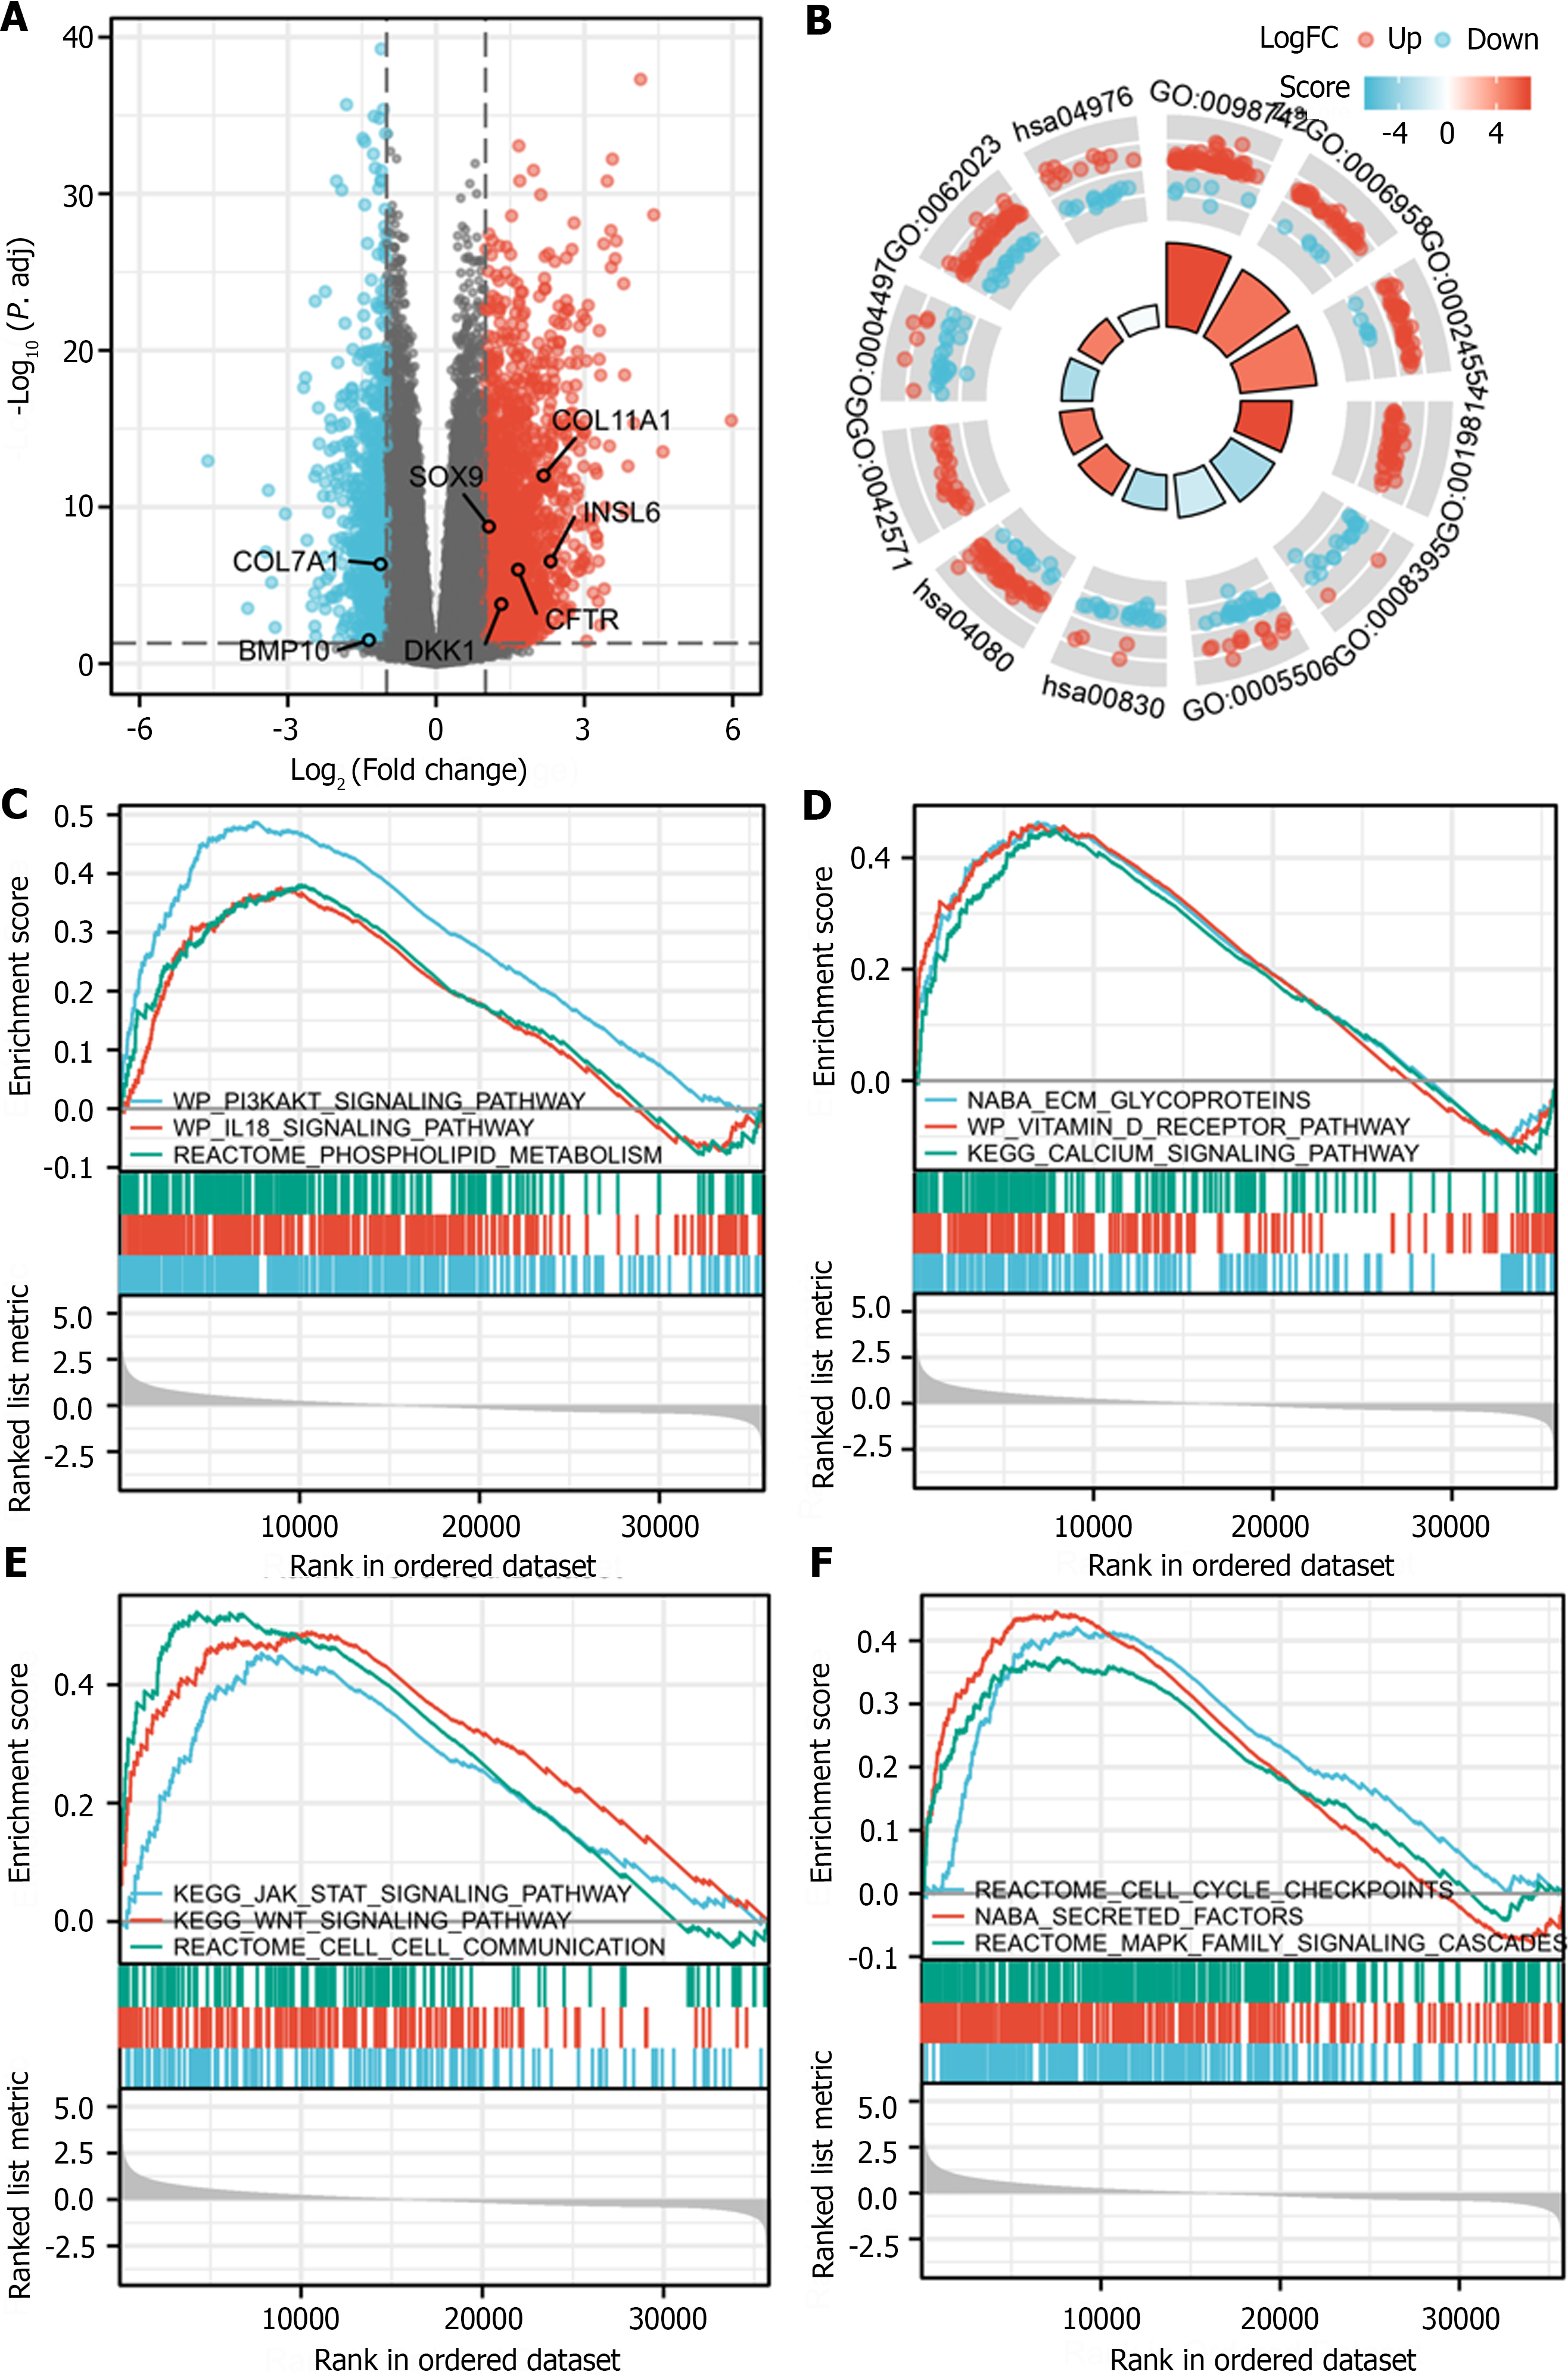
Figure 5 Differentially expressed genes between high and low sterol O-acyltransferase 1 expression groups in liver hepatocellular carcinoma.
A: Volcano plot of differentially expressed genes (DEGs) between high and low sterol O-acyltransferase 1 (SOAT1) expression groups in liver hepatocellular carcinoma (LIHC); B: Top GO terms and KEGG pathways enriched by DEGs between high and low SOAT1 expression groups in LIHC; C-F: Gene set enrichment analysis of DEGs between high and low SOAT1 expression groups in LIHC.
- Citation: Gan CJ, Zheng Y, Yang B, Cao LM. Comprehensive prognostic and immune analysis of sterol O-acyltransferase 1 in patients with hepatocellular carcinoma. World J Hepatol 2024; 16(3): 439-451
- URL: https://www.wjgnet.com/1948-5182/full/v16/i3/439.htm
- DOI: https://dx.doi.org/10.4254/wjh.v16.i3.439


