Copyright
©The Author(s) 2022.
World J Hepatol. May 27, 2022; 14(5): 956-971
Published online May 27, 2022. doi: 10.4254/wjh.v14.i5.956
Published online May 27, 2022. doi: 10.4254/wjh.v14.i5.956
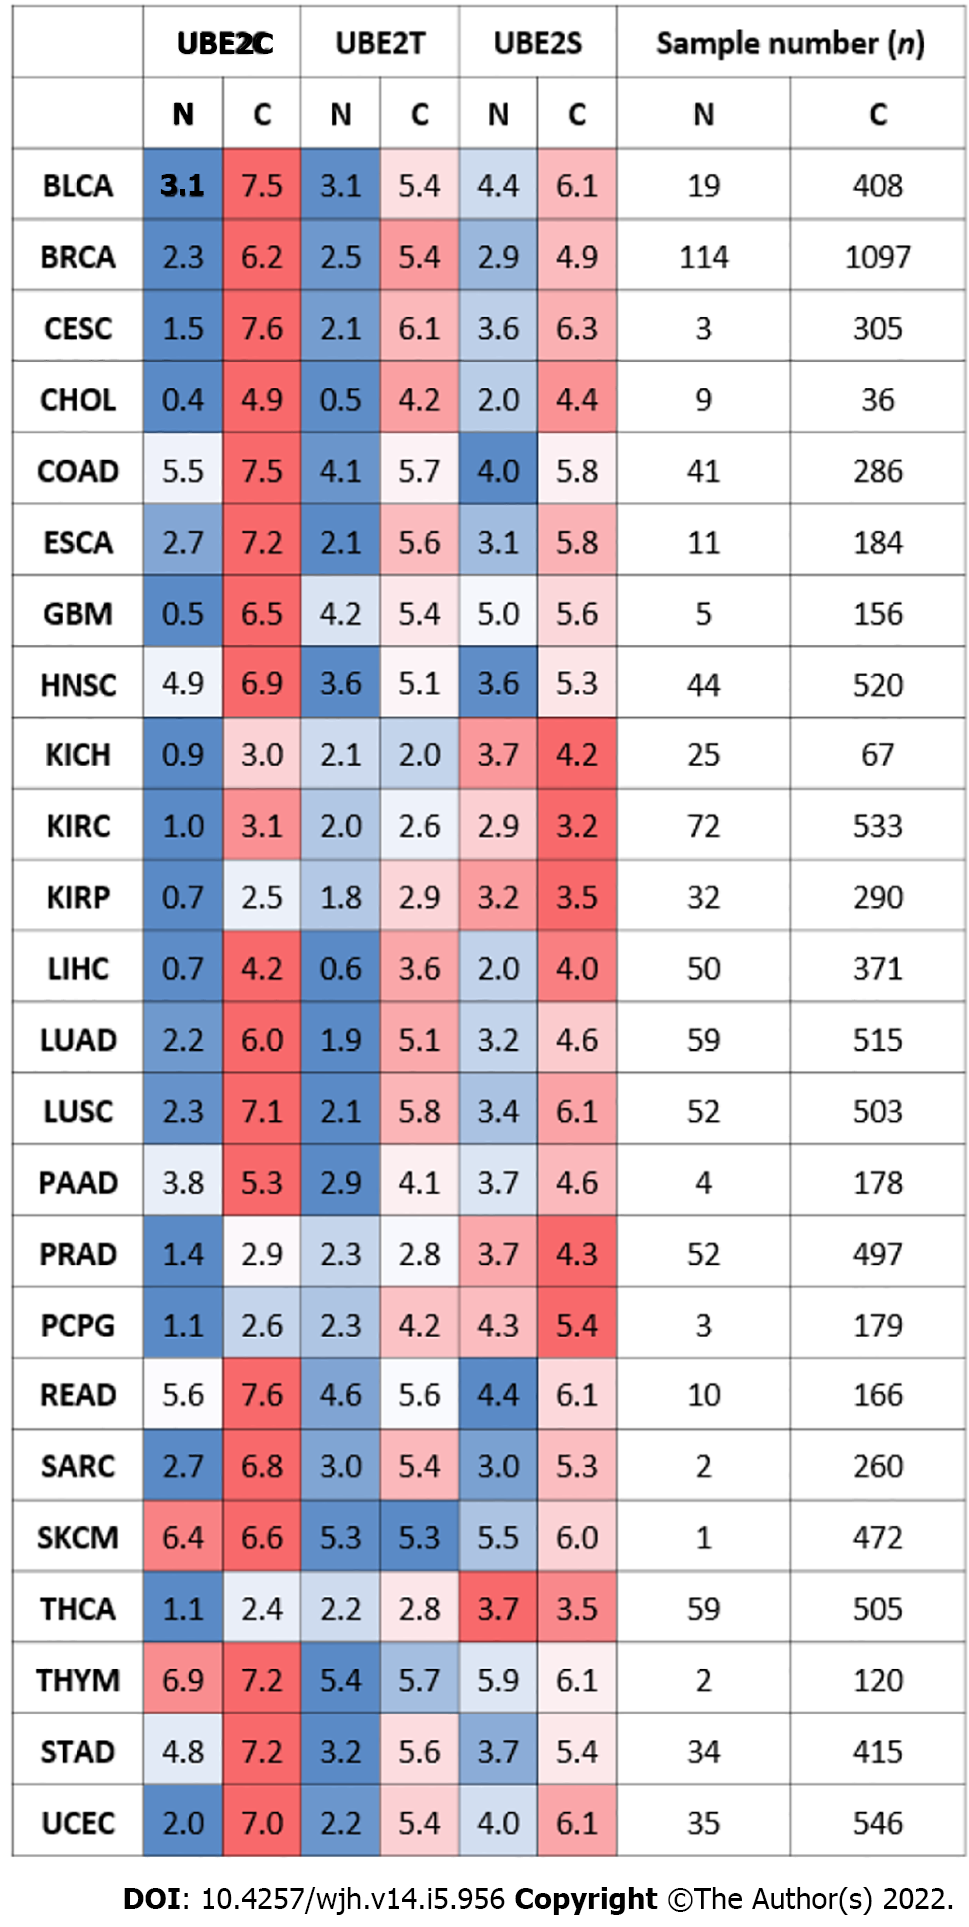
Figure 1 Gene expression levels of UBE2C, UBE2T, and UBE2S in pan-cancer with normal samples and tumor samples (the Cancer Genome Atlas database).
N: Normal samples; C: Cancer samples. Color-coded only based on each cancer type. Red: higher expression level; Blue: lower expression level when compared tumor samples with normal samples in a particular cancer type. The number represents the median value of expression Log2 (transcript count per million (TPM)+1). The total sample number for the corresponding cancer type was listed on the right side of the figure (N: total sample number of normal samples. C: total sample number of tumor samples) Abbreviations: BLCA: Bladder urothelial carcinoma; BRCA: Breast invasive carcinoma; CESC: Cervical squamous cell carcinoma; CHOL: Cholangiocarcinoma; COAD: Colon adenocarcinoma; ESCA: Esophageal carcinoma; GBM: Glioblastoma multiforme; HNSC: Head and Neck squamous cell carcinoma; KICH: Kidney Choromophobe; KIRC: Kidney renal clear cell carcinoma; KIRP: Kidney renal papillary cell carcinoma; LIHC (HCC): Liver hepatocellular carcinoma; LUAD: Lung adenocarcinoma; LUSC: Lung squamous cell carcinoma; PAAD: Pancreatic adenocarcinoma; PRAD: Prostate adenocarcinoma; PCPG: Pheochromocytoma and Paraganglioma; READ: Rectum adenocarcinoma; SARC: Sarcoma; SKCM: Skin Cutaneous Melanoma; THCA: Thyroid carcinoma; UCS: Uterine Carcinosarcoma; THYM: Thymoma; STAD: Somach adenocarcinoma; UCEC: Uterine Corpus Endometrial Carcinoma)
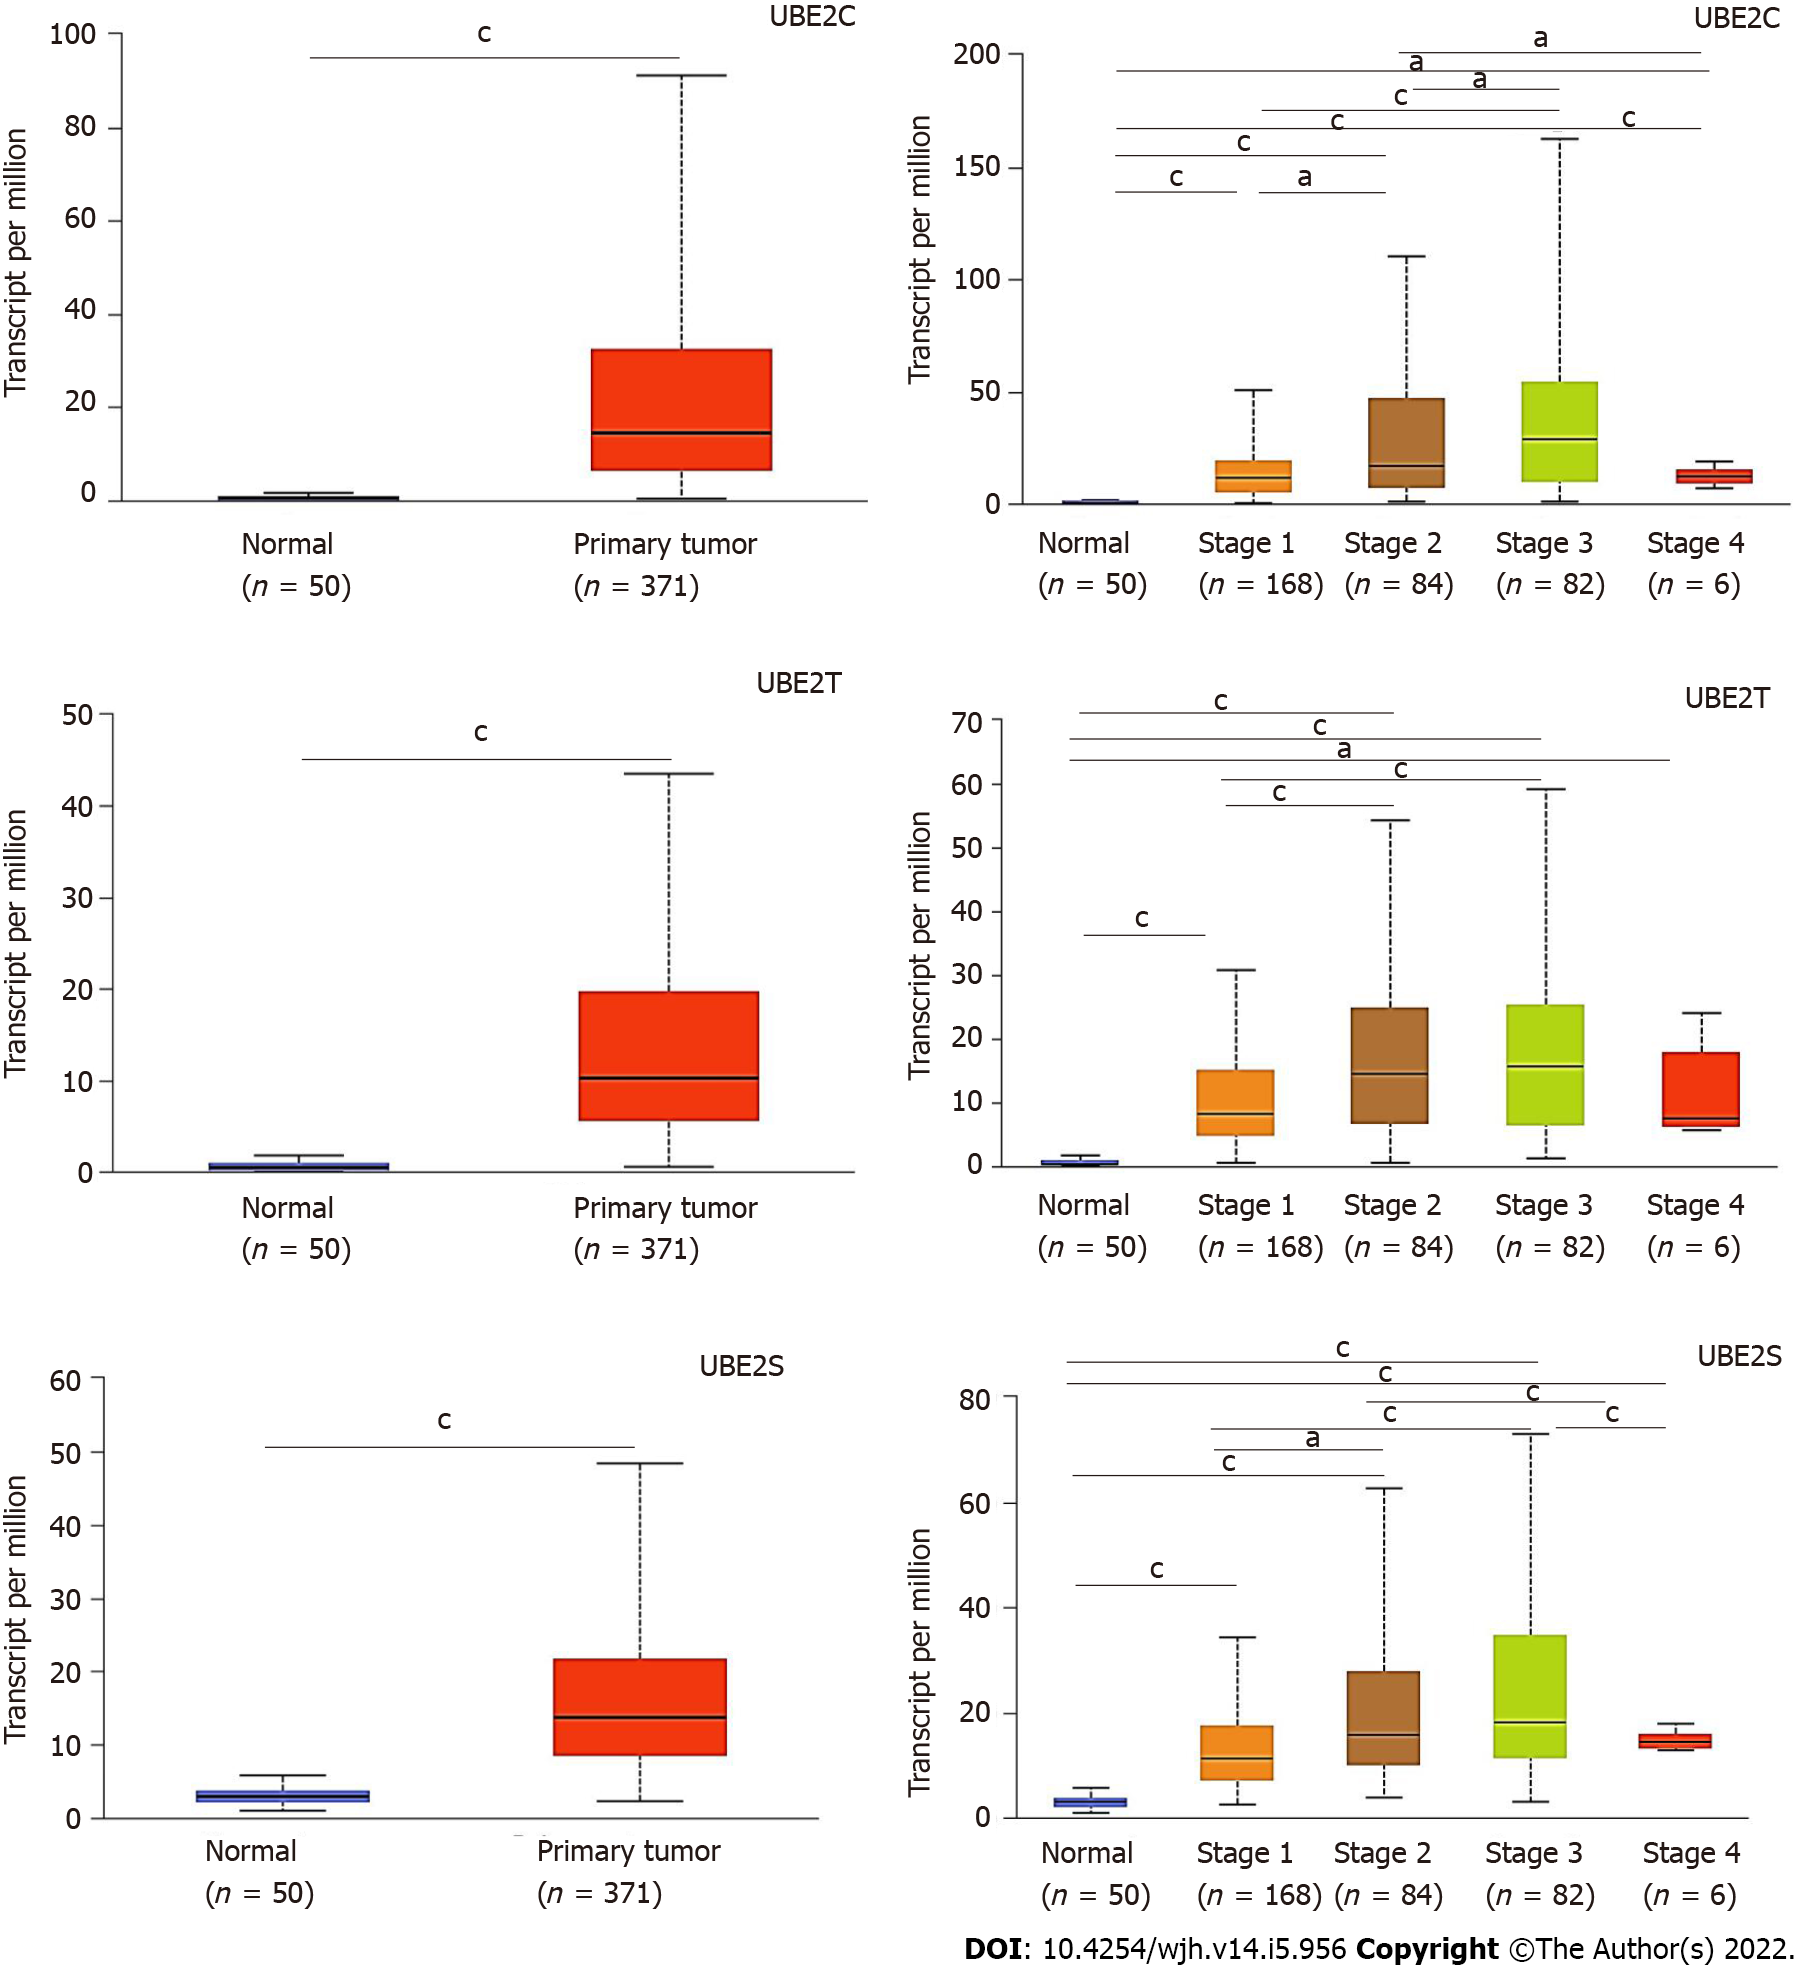
Figure 2 UBE2C, UBE2T, and UBE2S expression levels in hepatocellular carcinoma based on normal and tumor sample types and based on cancer stages (the Cancer Genome Atlas database).
A: Expression of UBE2C in hepatocellular carcinoma (HCC) based on sample types; B: Expression of UBE2T in HCC based on sample types; C: Expression of UBE2S in HCC based on sample types; D: Expression of UBE2C in HCC based on individual cancer stages; E: Expression of UBE2T in HCC based on individual cancer stages; F: Expression of UBE2S in HCC based on individual cancer stages (aP < 0.05; cP < 0.001).
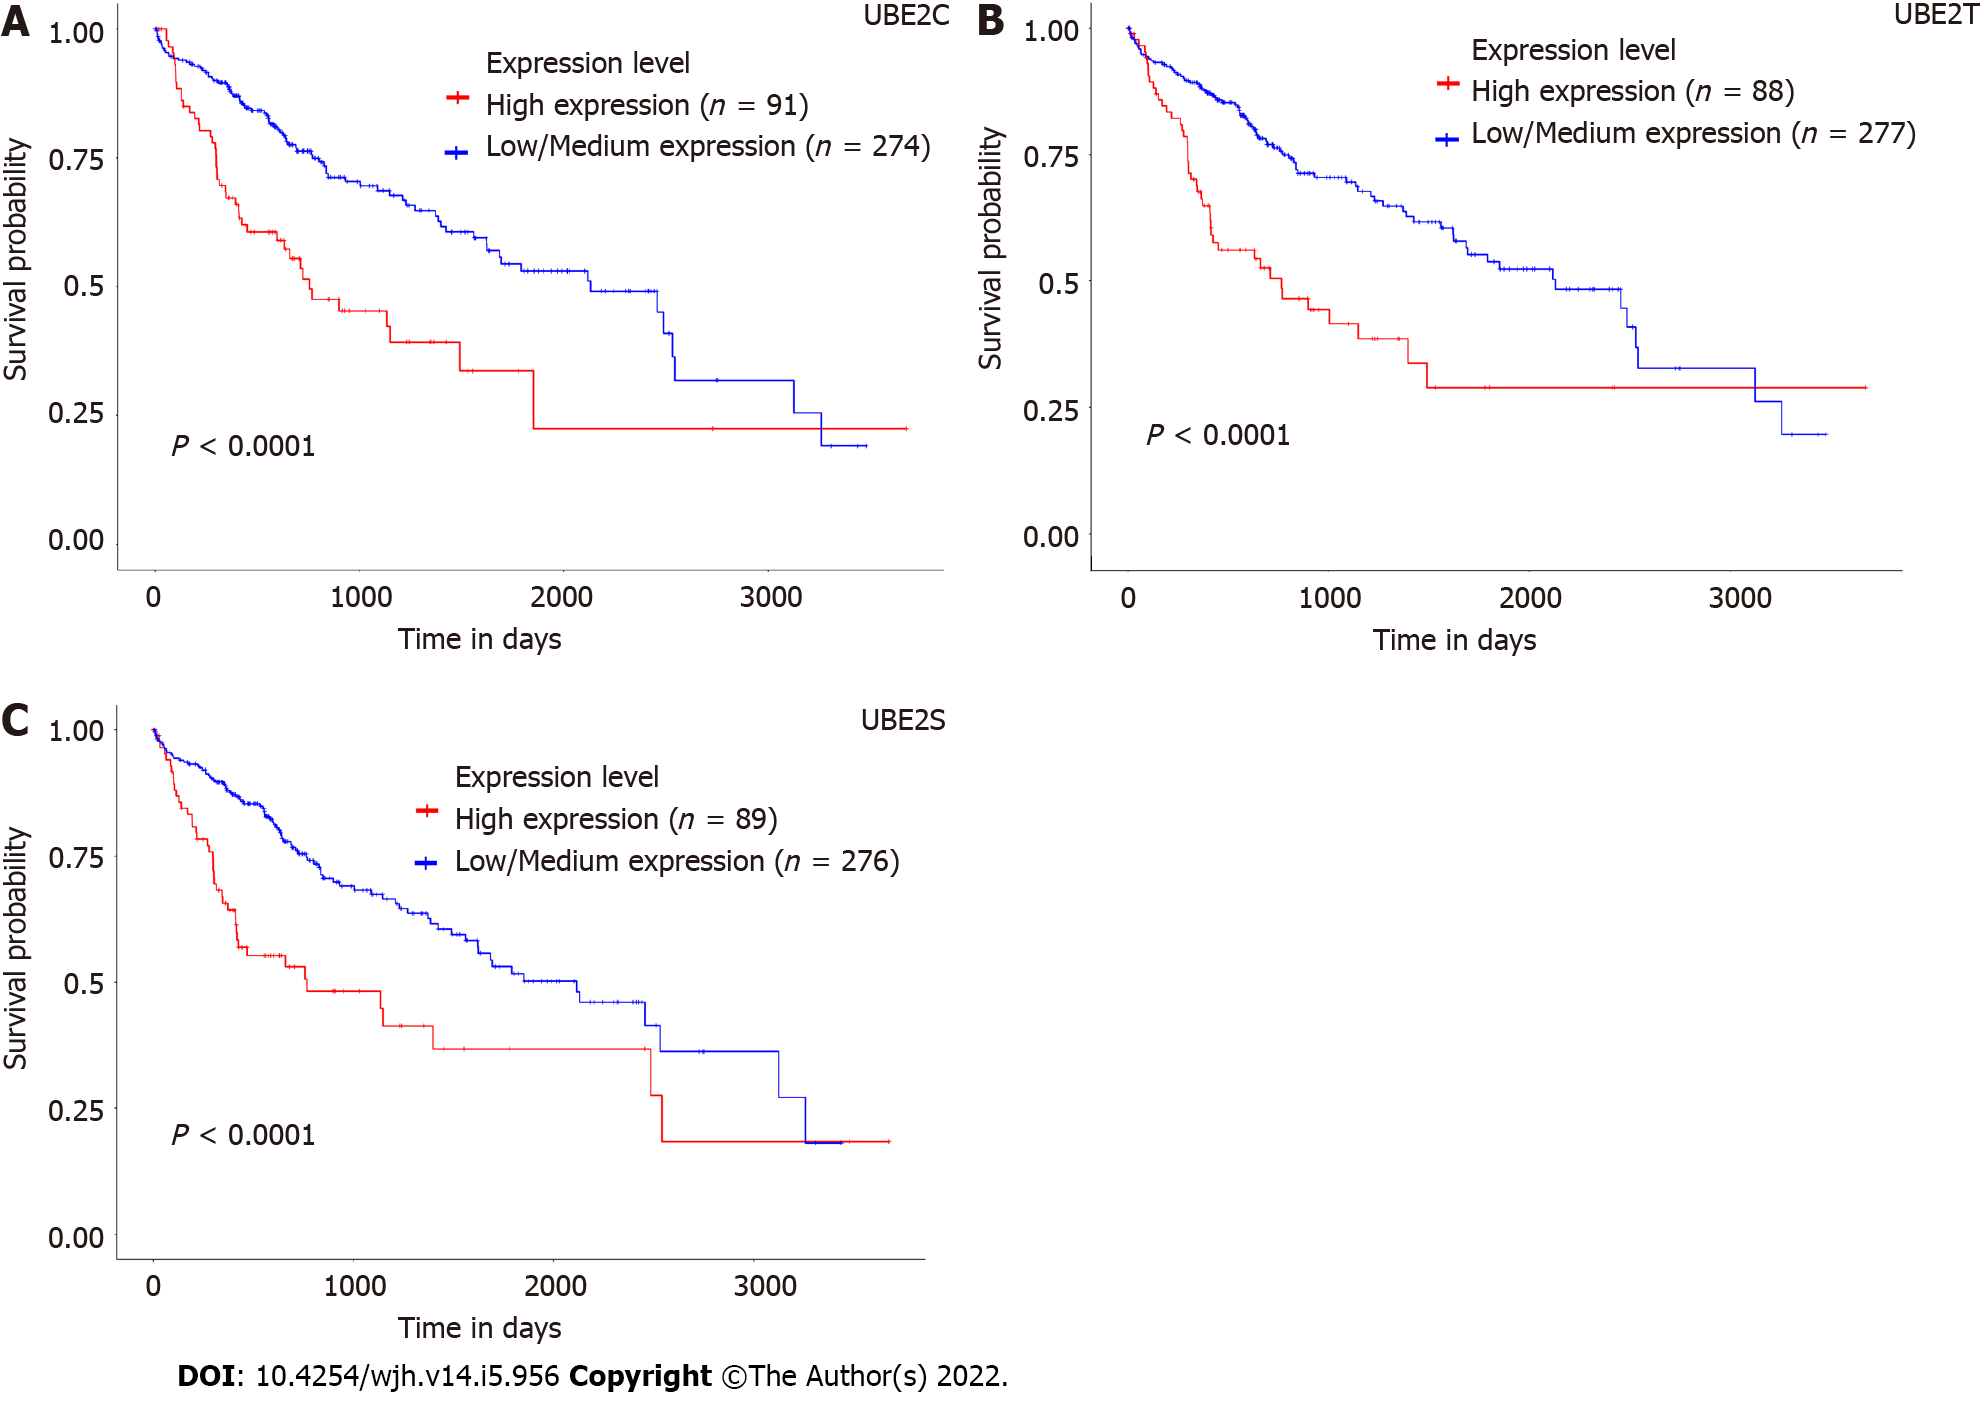
Figure 3 Association of expression levels of UBE2C, UBE2T, and UBE2S with prognostic outcomes of hepatocellular carcinoma patients.
A: Survival of patients with a high expression level of UBE2C compared with patients with low/medium expression level; B: Survival of patients with a high expression level of UBE2T compared with patients with a low/medium expression level; C: Survival of patients with a high expression level of UBE2S compared with patients with low/medium expression level; D: Overall survival heat map of patients across multiple cancer types. Red color represents higher risk on survival and blue color represents lower risk. The frame indicated the significant unfavorable (red) and favorable (blue) prognostic outcome. (Calculation of the hazards ratio based on Cox PH Model, 95% Confidence Interval) (ACC: Adrenocortical carcinoma; LGG: Brain lower grade glioma; DBLC: Lymphoid Neoplasm Diffuse Large B-cell Lymphoma; MESO: Mesothelioma; OV: Ovarian serous cystadenocarcinoma; TGCT: Testicular germ cell tumors; UVM: Uveal melanoma).
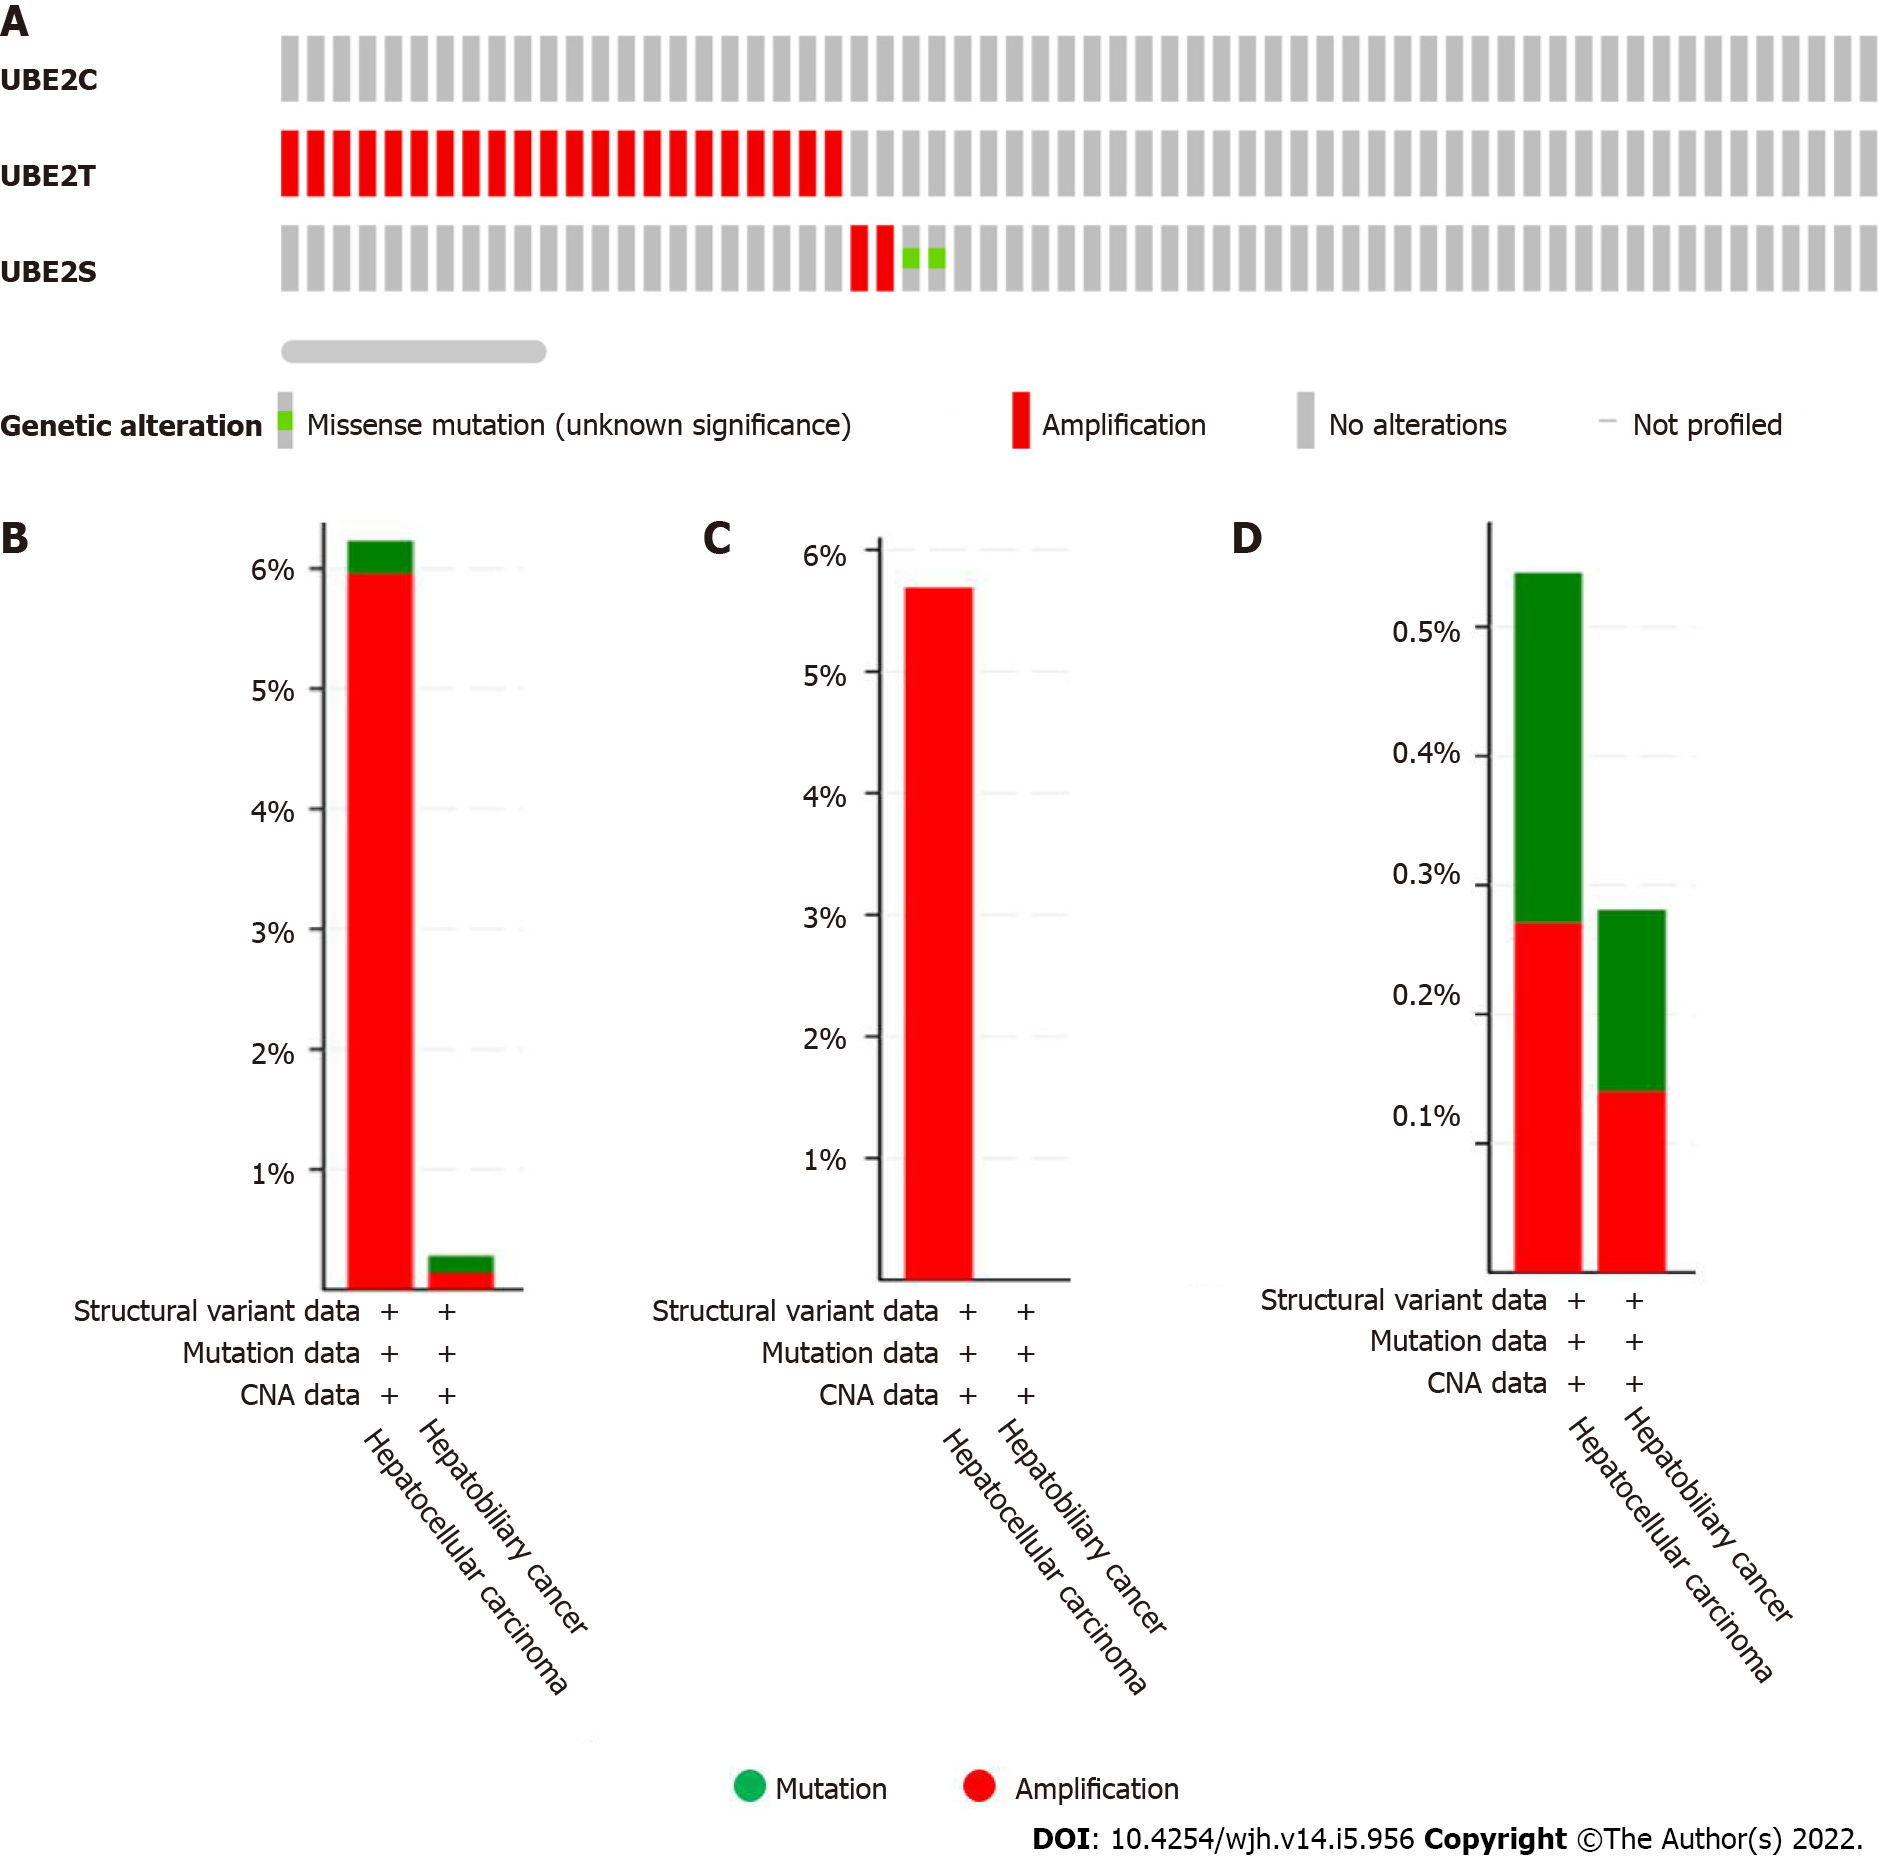
Figure 4 The genetic alteration occurred in UBE2C, UBE2T, and UBE2S in liver cancer (1238 samples from the Cancer Genome Atlas).
A: Genetic alteration occurred in UBE2C, UBE2T, and UBE2S in HCC; B: UBE2T and UBE2S, overall alteration frequency 6.23% (23/369 cases) in hepatocellular carcinoma including 22 cases implication and 1 case of mutation. In hepatobiliary cancer type, the alteration frequency is 0.28 (2/712) with 1 case of amplification and 1 case of mutation; C: UBE2T genetic alteration frequency 5.69% (21/369 cases) categorized by cancer type; D: UBE2S genetic alteration frequency 0.54% (2/369 cases) in HCC (1 case amplification and 1 case mutation); In hepatobiliary cancer, UBE2S alteration frequency is 0.28% (2/712 cases) (1 case amplification and 1 case mutation).
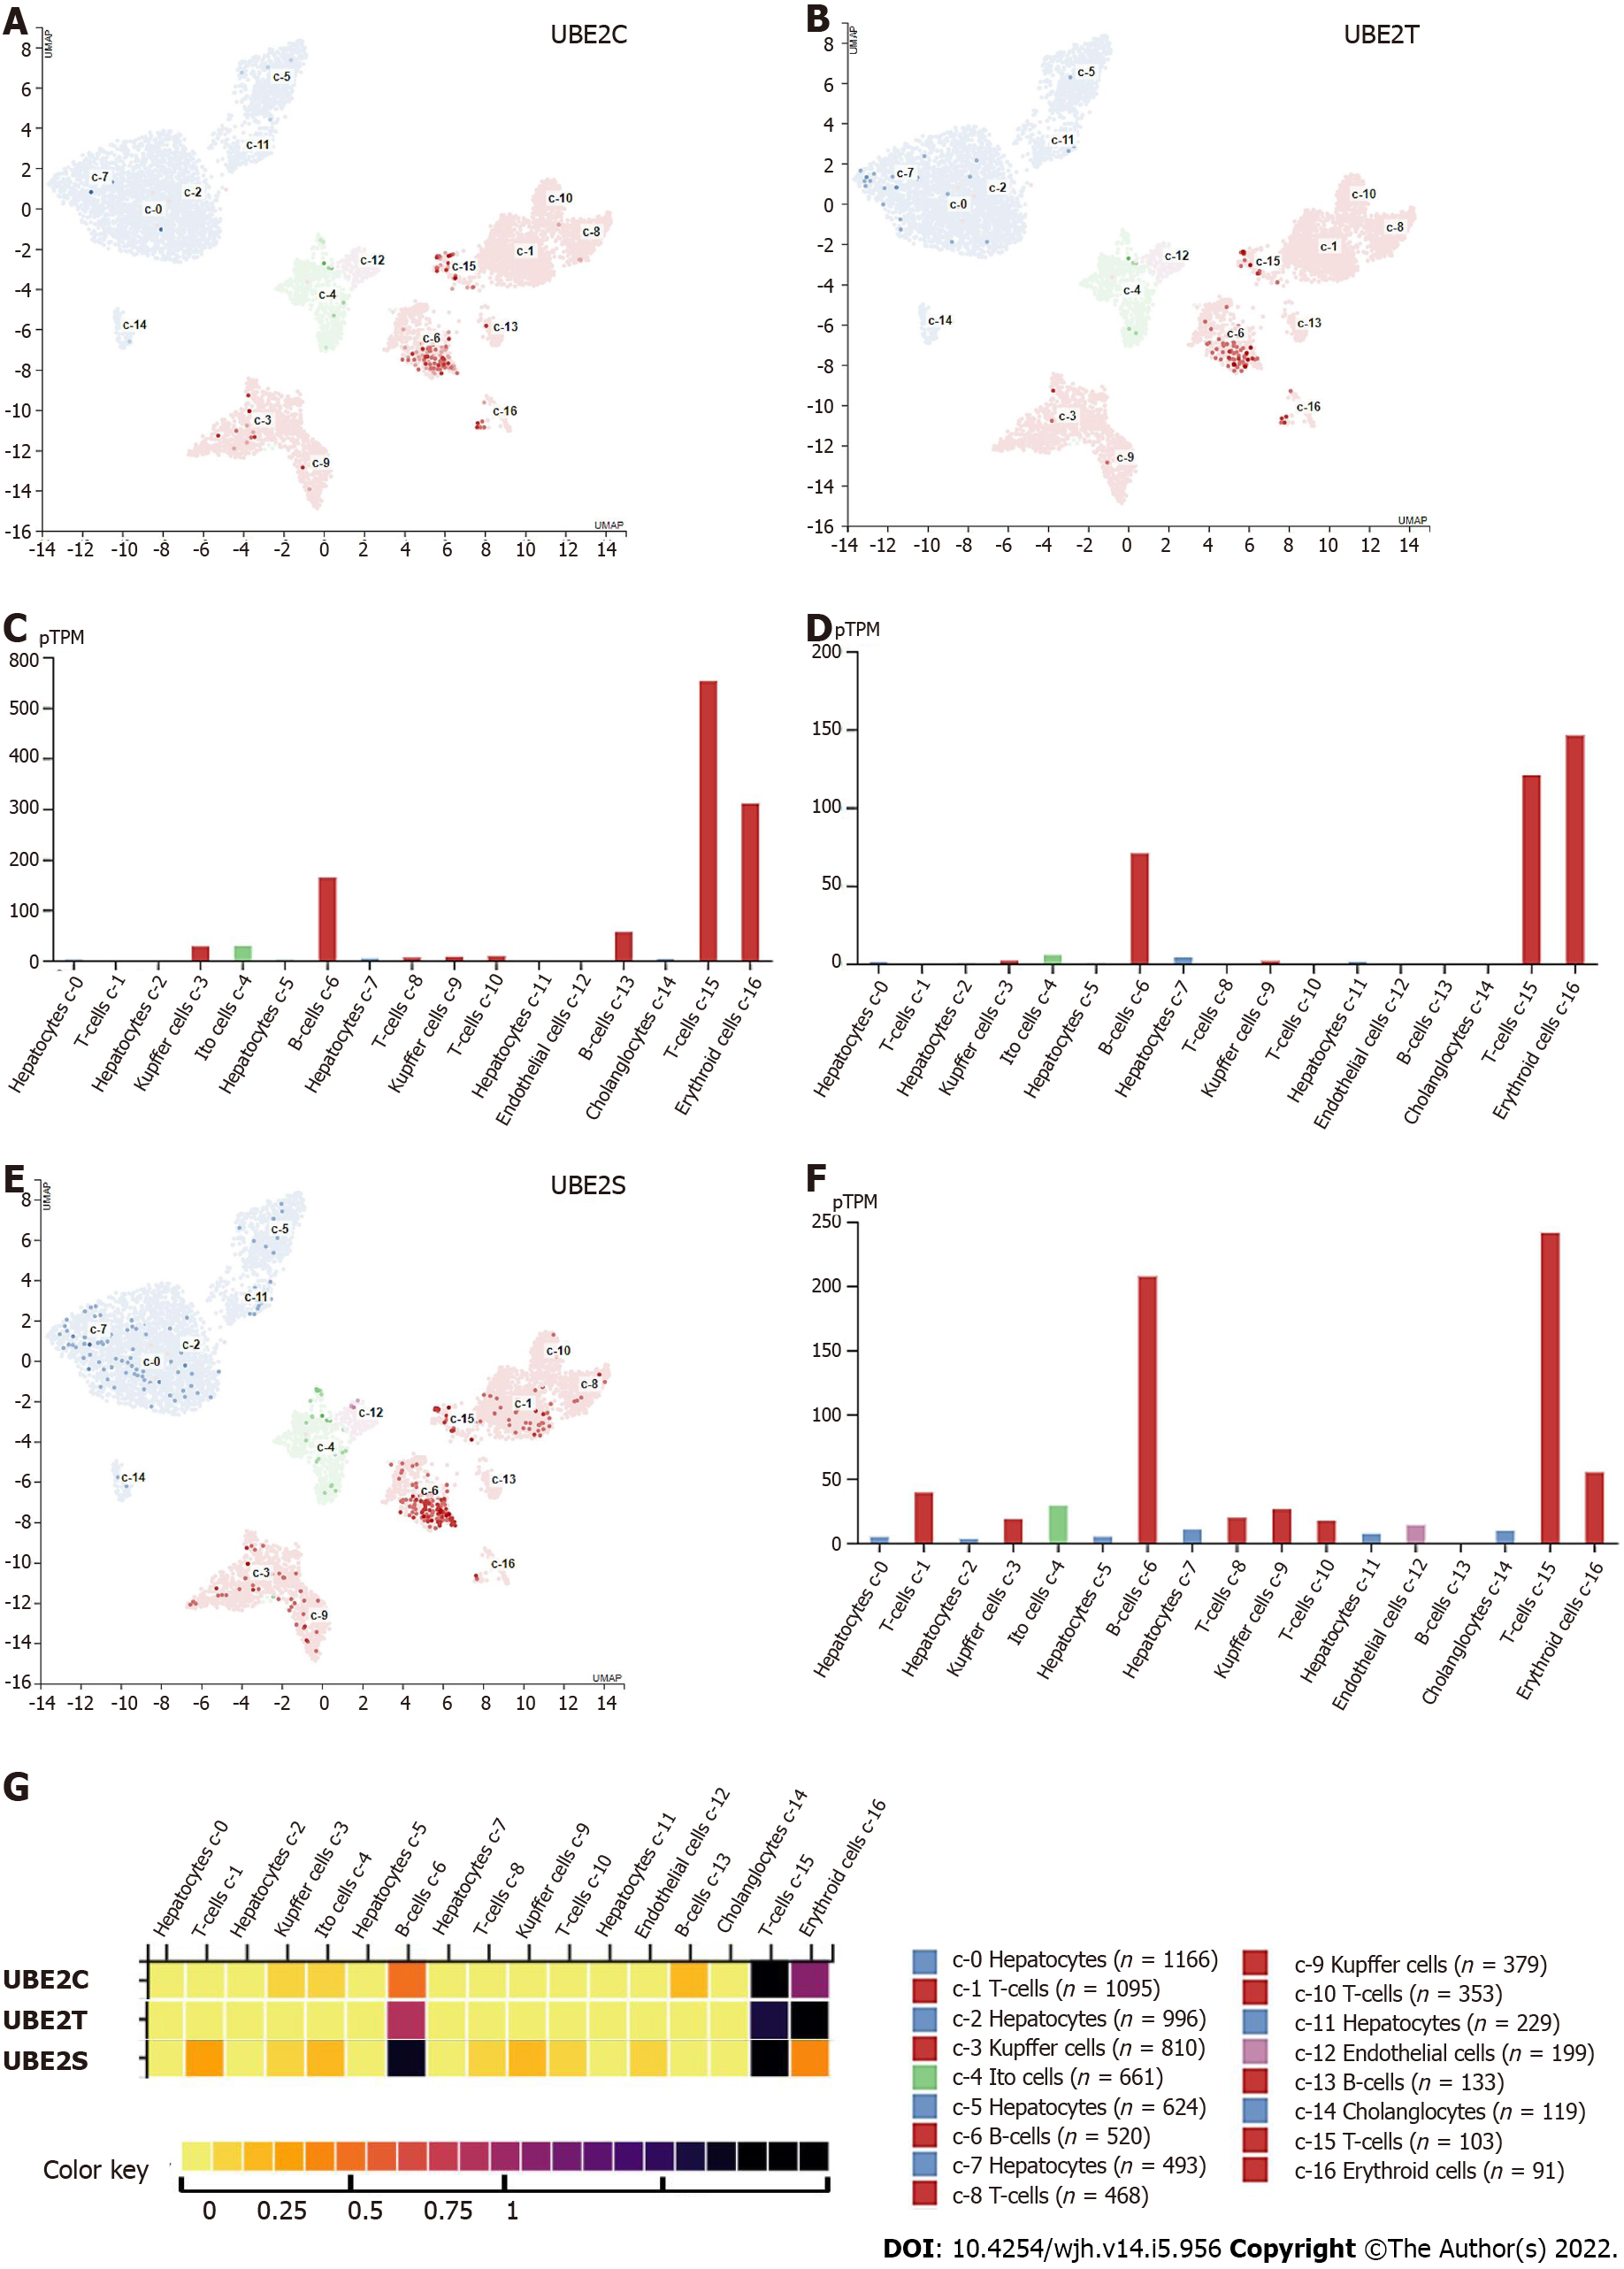
Figure 5 UBE2C, UBE2T, and UBE2S mRNA expression in different cell types.
A: UBE2C expressed genes in each cell cluster of scRNA-seq data; B: Bar plot of the transcript abundance of UBE2C in different cell types based on the scRNA-seq data. The level of UBE2C mRNA was represented by the mean pTPM (Protein-coding transcripts per million); C: UBE2T expressed genes in each cell cluster; D: Bar plot of the transcript abundance of UBE2T in different cell types based on the scRNA-seq data. The level of UBE2T mRNA was represented by the mean pTPM; E: UBE2S expressed genes in each cell cluster; F: Bar plot of the transcript abundance of UBE2S in different cell types based on the scRNA-seq data. The level of UBE2S mRNA was represented by the mean pTPM (Colored according to cell type group); G: Heat map of the expression level of UBE2C, UBE2T, and UBE2S. (Color key from 0-1 represent low–high expression).
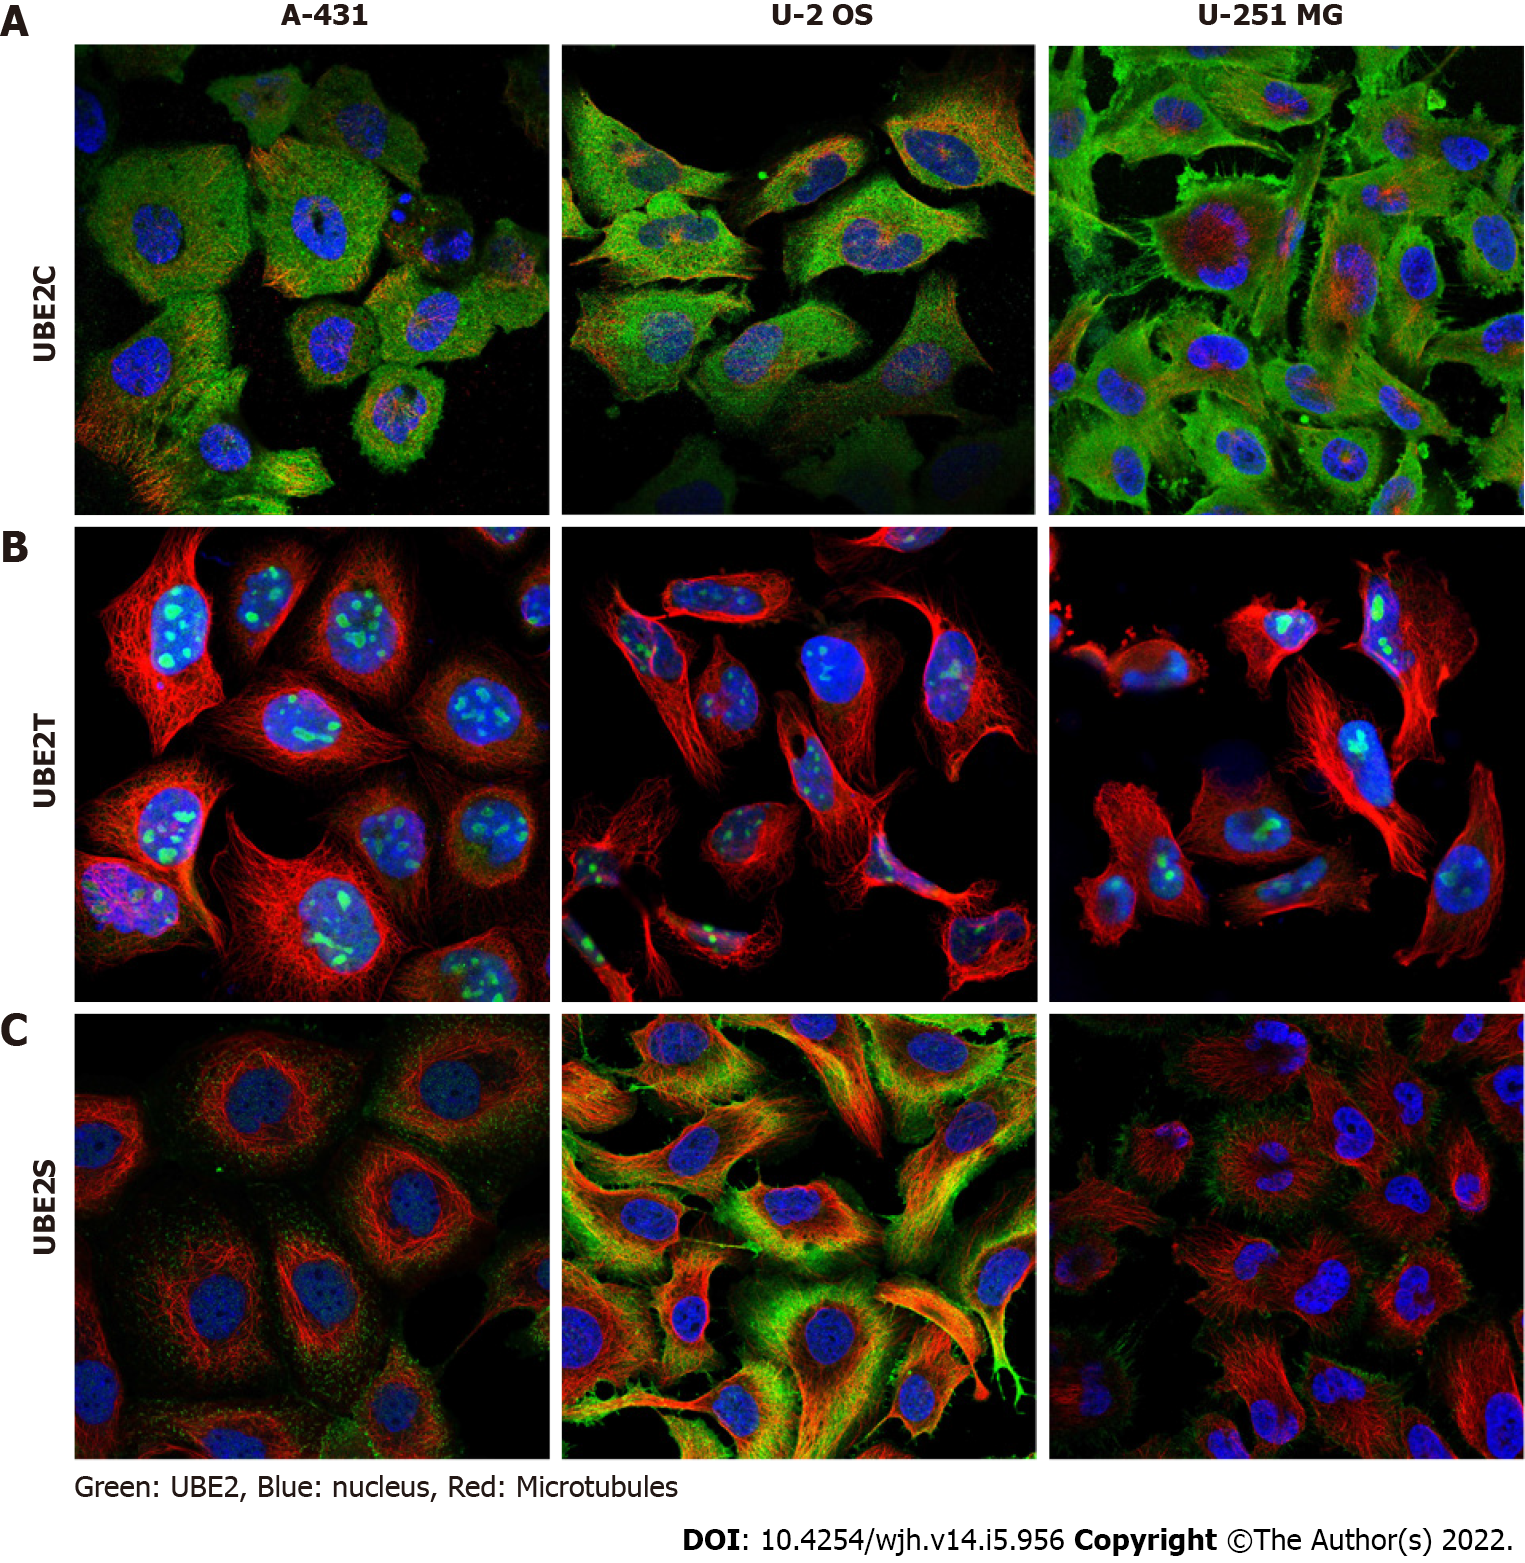
Figure 6 UBE2C, UBE2T, and UBE2S protein expression in cell lines.
A: UBE2C was mainly expressed in cytosol and plasma membrane; B: UBE2T was mainly expressed in nucleoli or nucleoplasm; C: UBE2S was highly expressed in cytosol and plasma membrane and less expressed in nucleoli.
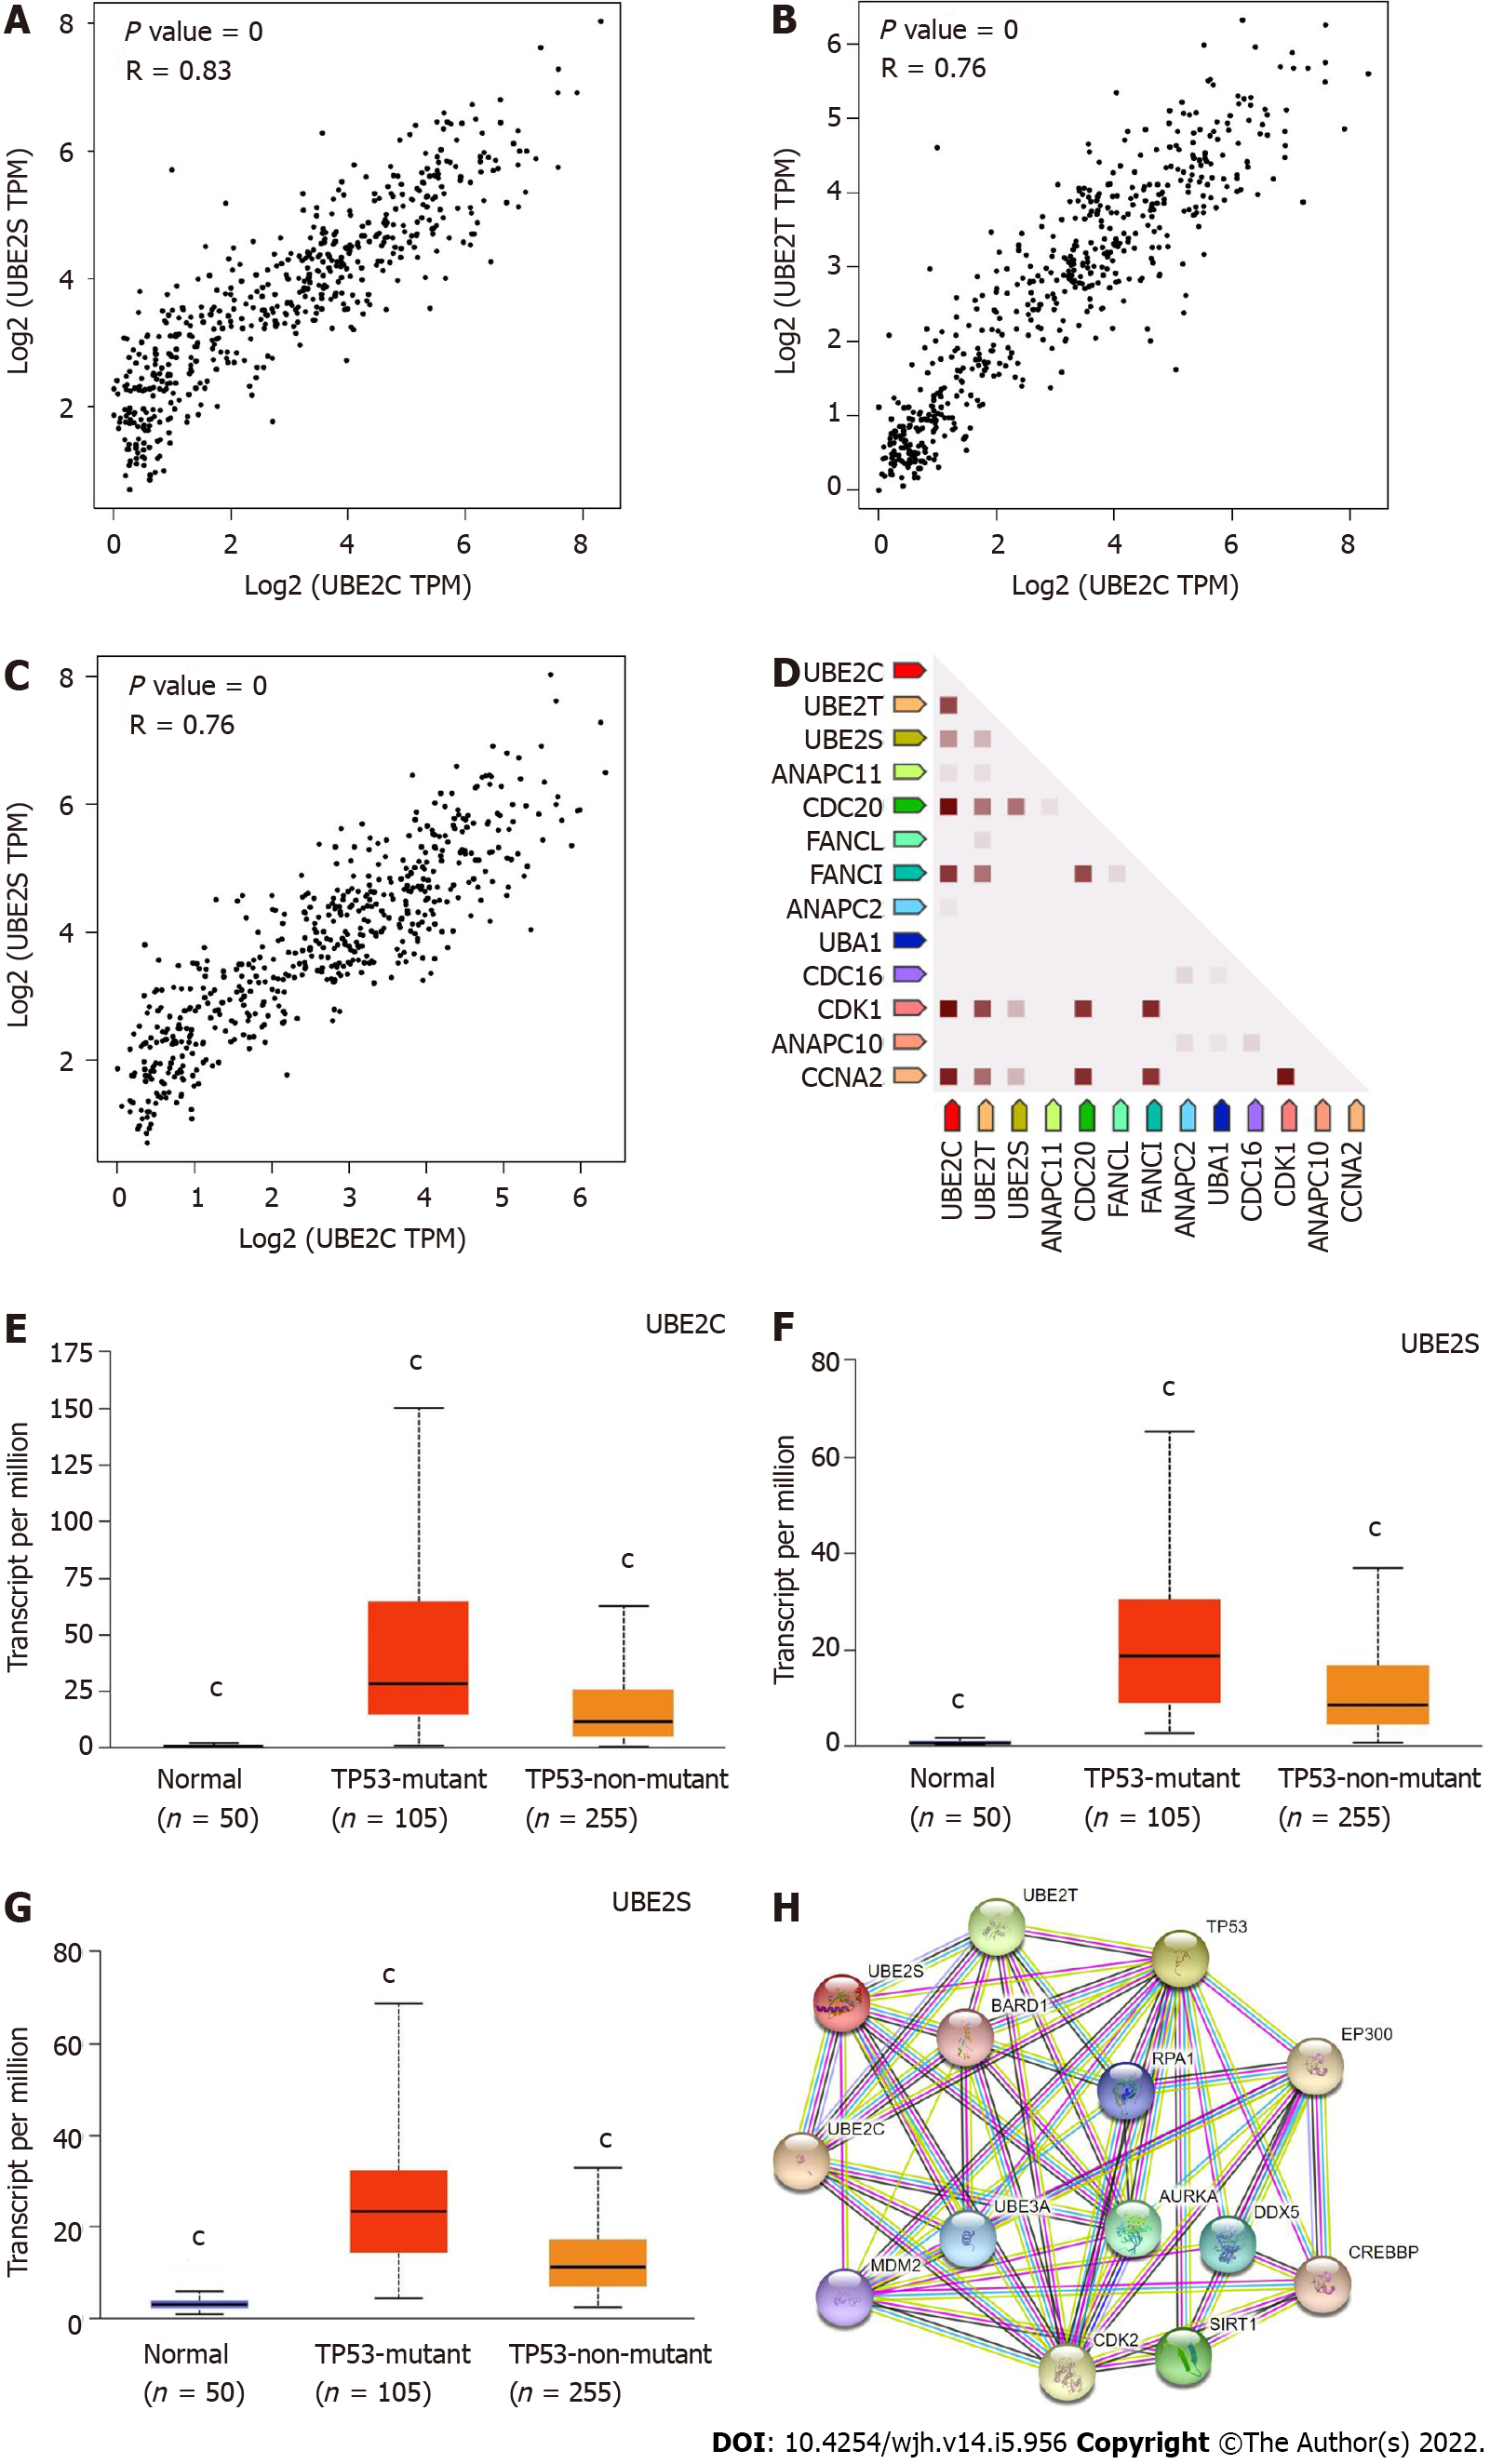
Figure 7 UBE2C, UBE2T, and UBE2S expression in homo sapiens and protein-protein interaction network.
A: Co-expression of UBE2C and UBE2S; B: Co-expression of UBE2C and UBE2T; C: Co-expression of UBE2T and UBE2S; D: Co-expression of UBE2C, UBE2T, and UBE2S predicts functional association. In the triangle matrices above, the intensity of the color indicates the level of confidence that two proteins are functionally associated in Homo sapiens. Figures E-G showed the expression of UBE2C, UBE2T, and UBE2S in HCC based on TP53 mutation status. TCGA samples for analysis; E: UBE2C expression in normal, HCC with TP53 mutation, and HCC non-TP53 mutation samples; F: UBE2T expression in normal, HCC with TP53 mutation, and HCC non-TP53 mutation samples; G: UBE2S expression in normal, HCC with TP53 mutation, and HCC non-TP53 mutation samples. (cP value < 0.001 Compared with other two groups); H: Protein-protein interaction of functional enrichment of queried network using query input of UBE2C, UBE2T, UBE2S, and TP53.
- Citation: Zhang CY, Yang M. Functions of three ubiquitin-conjugating enzyme 2 genes in hepatocellular carcinoma diagnosis and prognosis. World J Hepatol 2022; 14(5): 956-971
- URL: https://www.wjgnet.com/1948-5182/full/v14/i5/956.htm
- DOI: https://dx.doi.org/10.4254/wjh.v14.i5.956


