Copyright
©The Author(s) 2022.
World J Hepatol. May 27, 2022; 14(5): 956-971
Published online May 27, 2022. doi: 10.4254/wjh.v14.i5.956
Published online May 27, 2022. doi: 10.4254/wjh.v14.i5.956
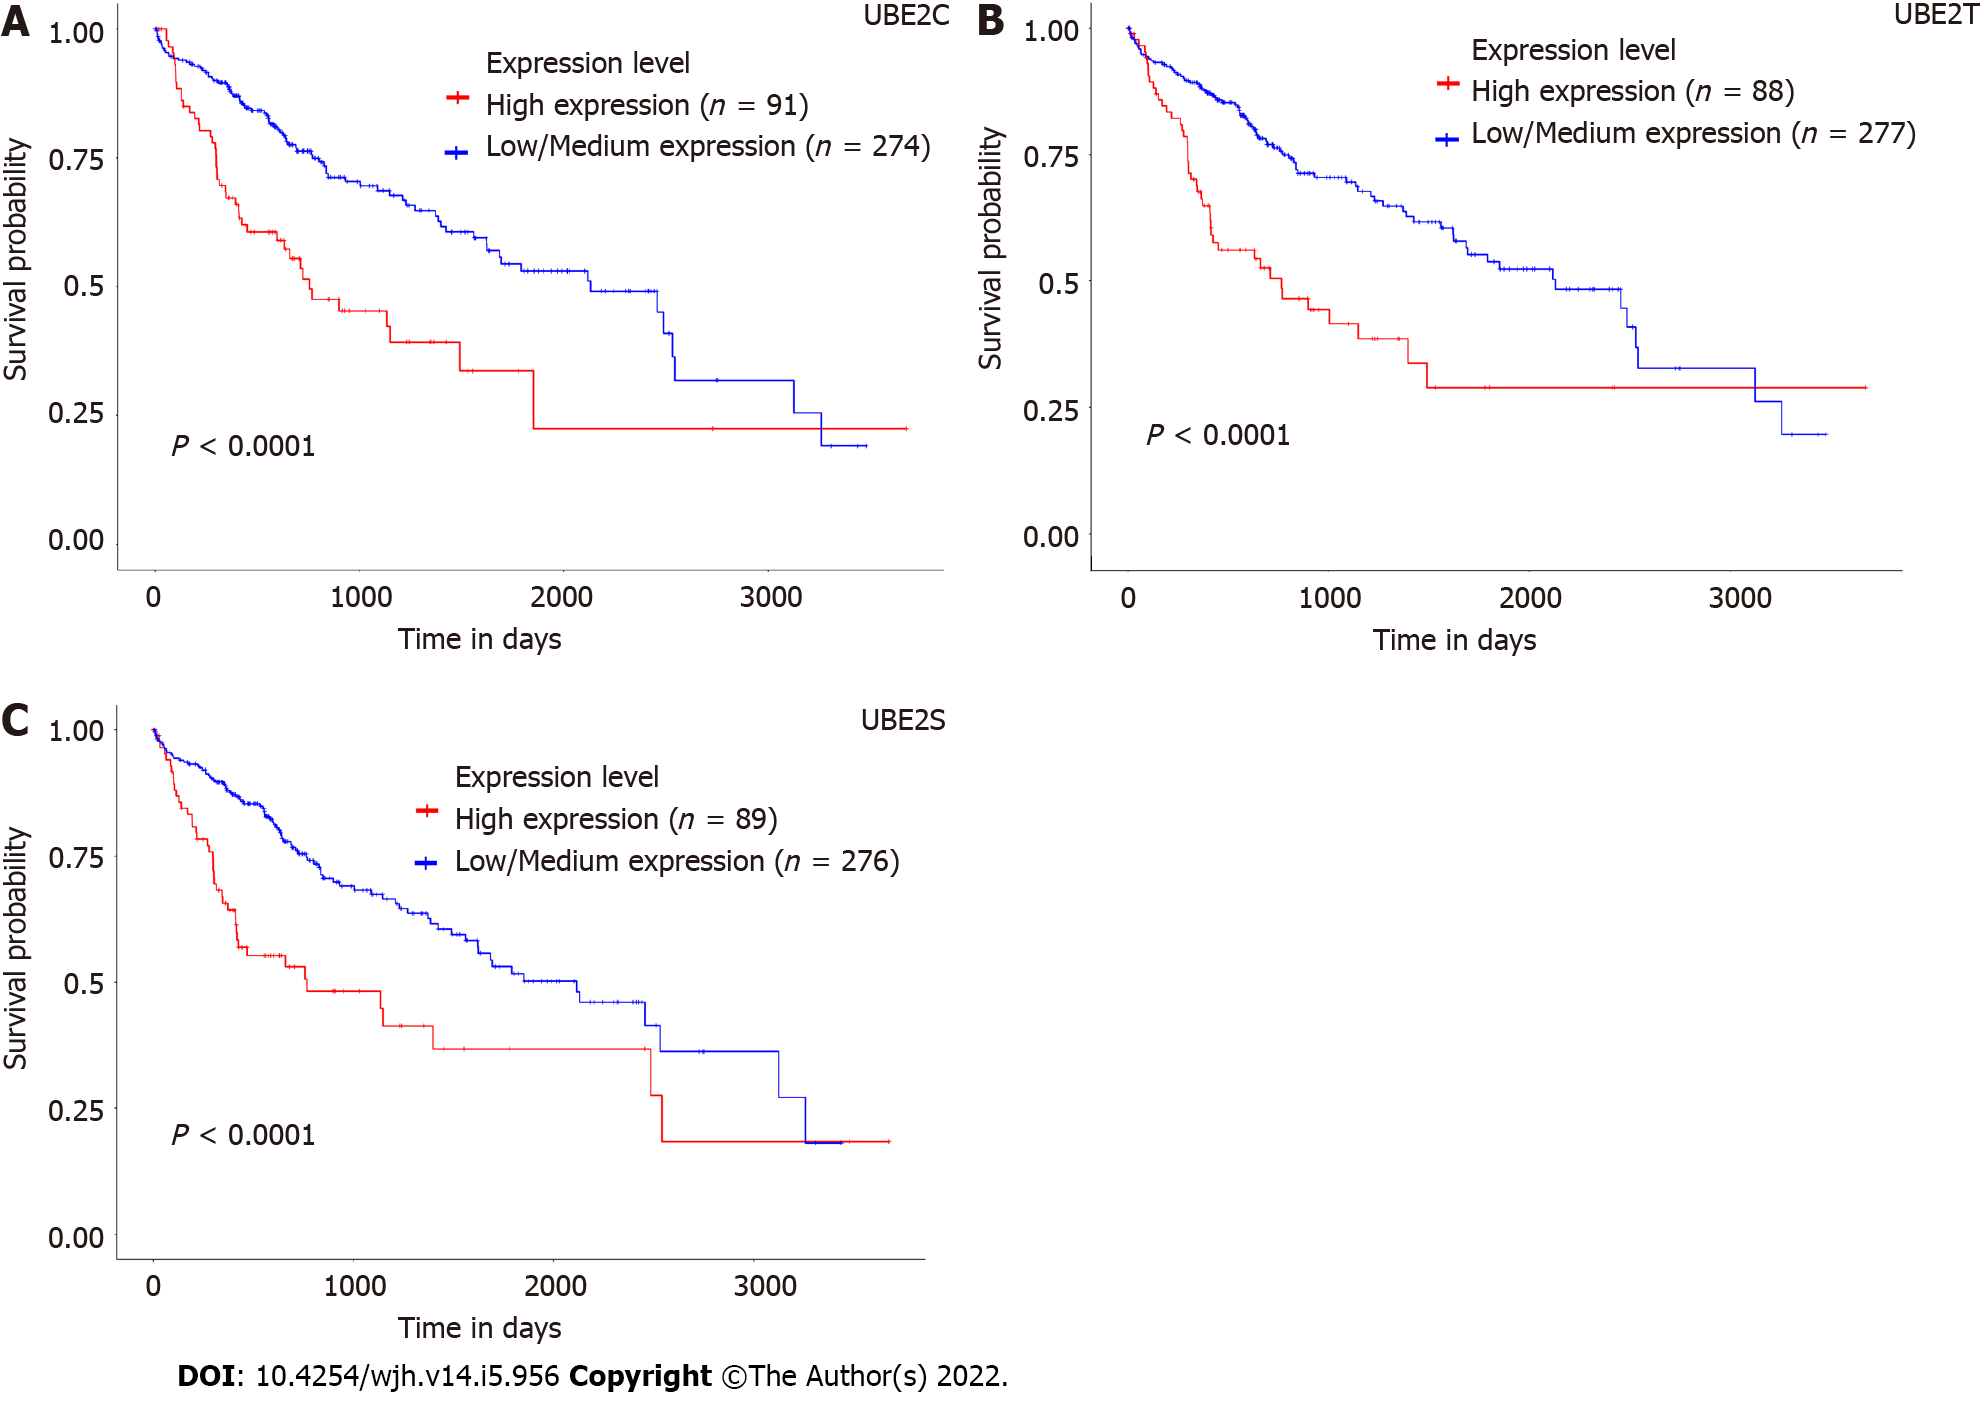
Figure 3 Association of expression levels of UBE2C, UBE2T, and UBE2S with prognostic outcomes of hepatocellular carcinoma patients.
A: Survival of patients with a high expression level of UBE2C compared with patients with low/medium expression level; B: Survival of patients with a high expression level of UBE2T compared with patients with a low/medium expression level; C: Survival of patients with a high expression level of UBE2S compared with patients with low/medium expression level; D: Overall survival heat map of patients across multiple cancer types. Red color represents higher risk on survival and blue color represents lower risk. The frame indicated the significant unfavorable (red) and favorable (blue) prognostic outcome. (Calculation of the hazards ratio based on Cox PH Model, 95% Confidence Interval) (ACC: Adrenocortical carcinoma; LGG: Brain lower grade glioma; DBLC: Lymphoid Neoplasm Diffuse Large B-cell Lymphoma; MESO: Mesothelioma; OV: Ovarian serous cystadenocarcinoma; TGCT: Testicular germ cell tumors; UVM: Uveal melanoma).
- Citation: Zhang CY, Yang M. Functions of three ubiquitin-conjugating enzyme 2 genes in hepatocellular carcinoma diagnosis and prognosis. World J Hepatol 2022; 14(5): 956-971
- URL: https://www.wjgnet.com/1948-5182/full/v14/i5/956.htm
- DOI: https://dx.doi.org/10.4254/wjh.v14.i5.956


