Copyright
©The Author(s) 2022.
World J Hepatol. May 27, 2022; 14(5): 923-943
Published online May 27, 2022. doi: 10.4254/wjh.v14.i5.923
Published online May 27, 2022. doi: 10.4254/wjh.v14.i5.923
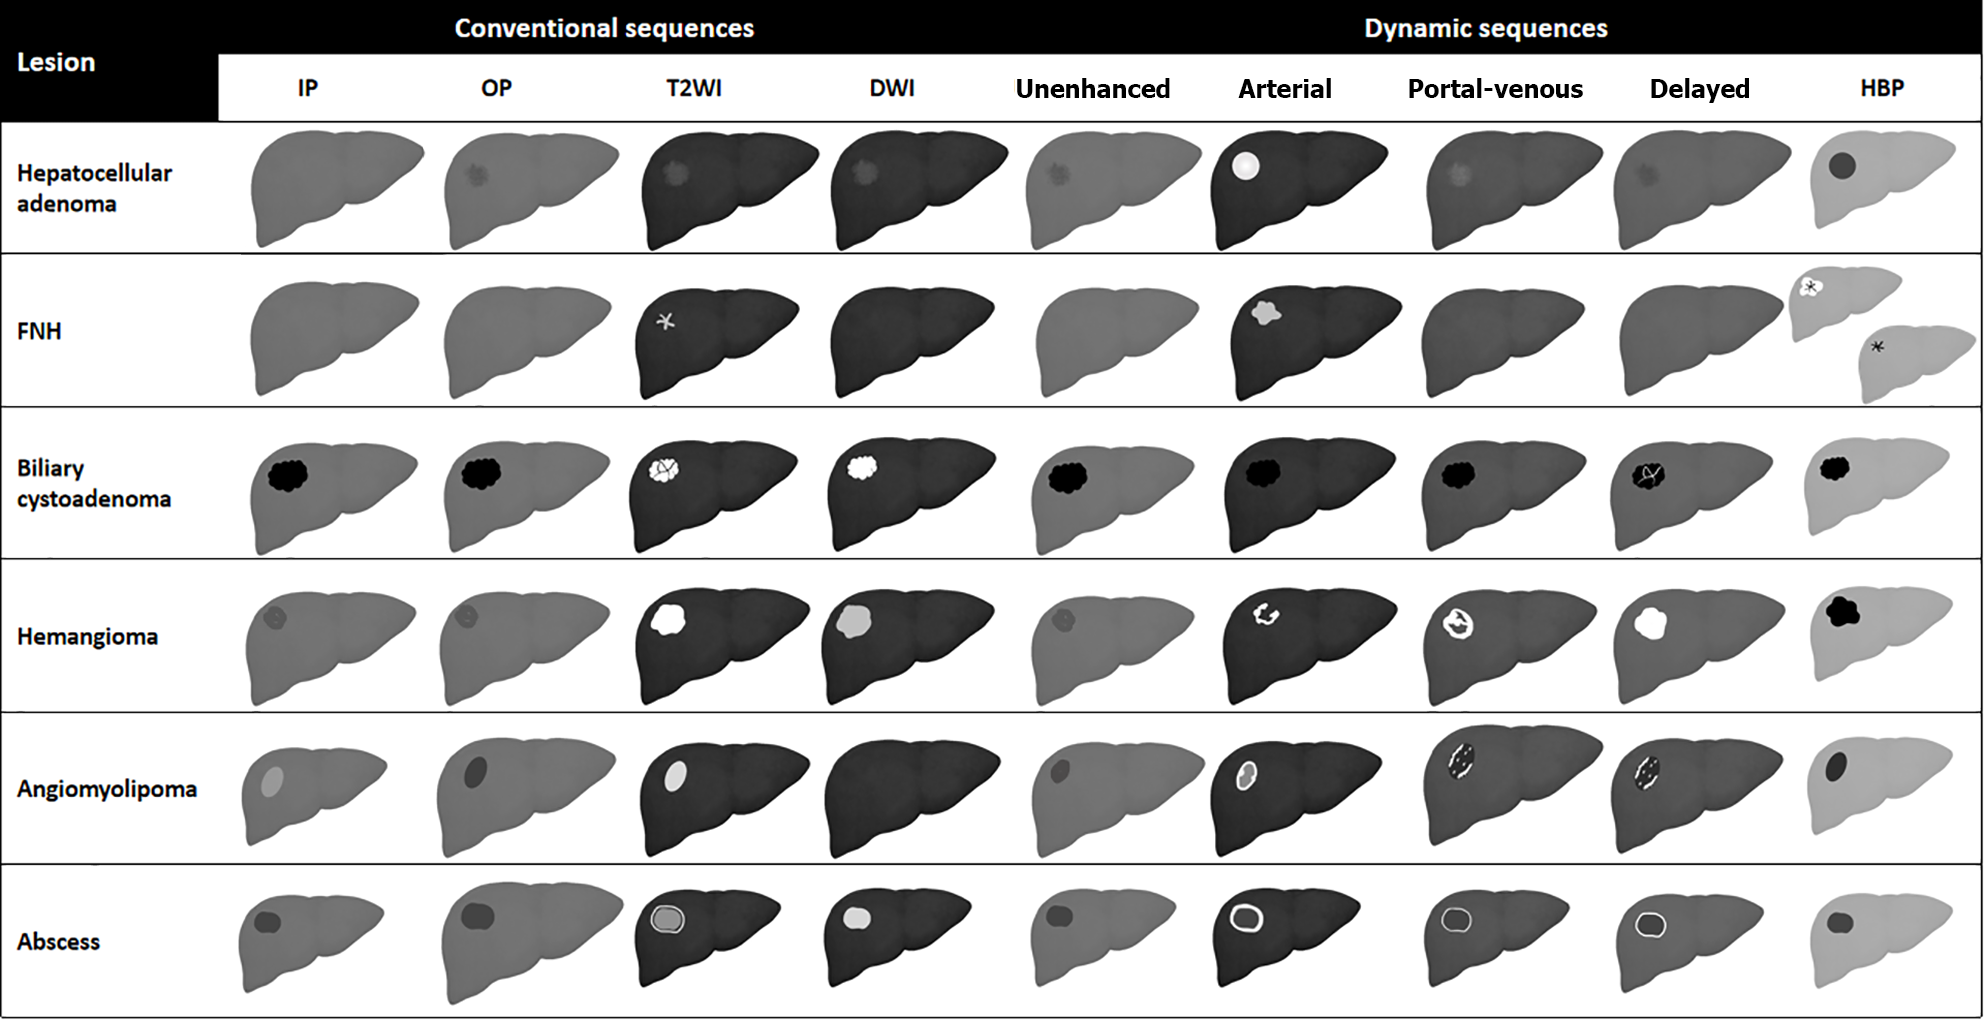
Figure 1 Schematic representation showing liver magnetic resonance imaging features of benign liver lesions.
IP: T1-weighted in-phase imaging; OP: T1-weighted out-of-phase imaging; DWI: Diffusion weighted imaging; HBP: Hepatobiliary phase; FNH: Focal nodular hyperplasia.
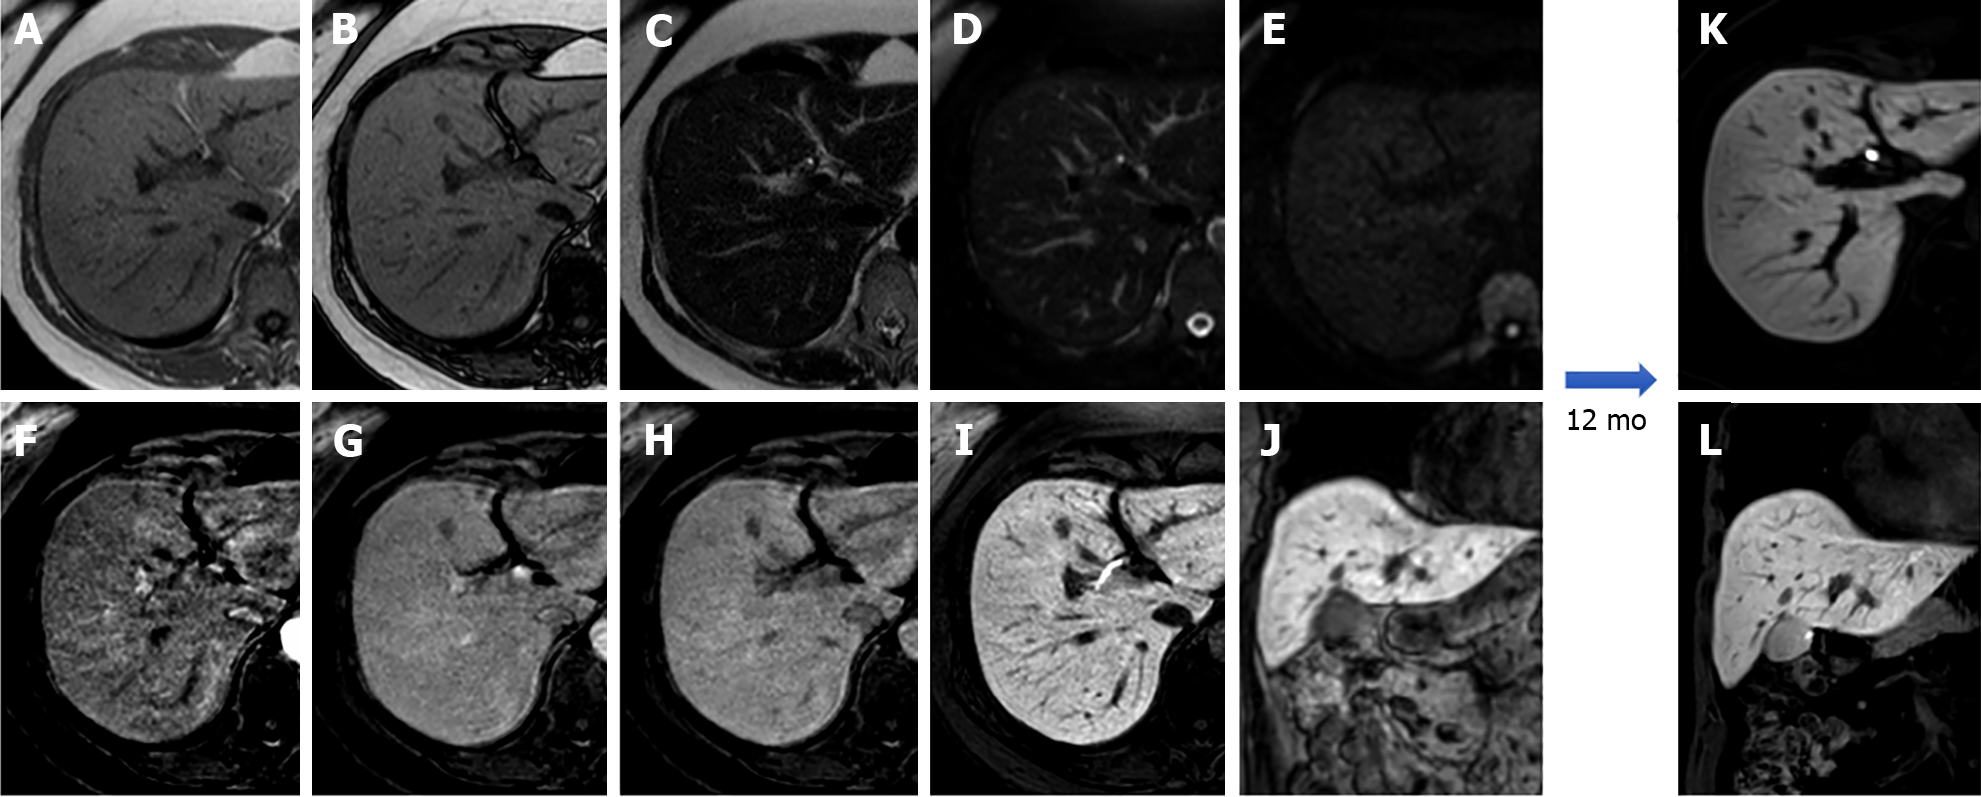
Figure 2 A 53-year-old patient presented with right hypochondrium pain and underwent abdominal ultrasound examination demonstrating a hyperechoic nodule in S4.
Liver magnetic resonance imaging confirmed an isointense nodule on T1 in-phase sequence with loss of signal on opposed-phase T1-weighted images, isointense on T2 sequences, without increased signal intensity on diffusion weighted images, with minimum wash-in on the arterial phase and wash-out on the portal-venous and delayed phase, hypointense in the hepatobiliary phase, findings consistent with hepatocyte nuclear factor 1α - mutated hepatocellular adenoma. A: In-phase T1-weighted image; B: Out-of-phase T1-weighted image; C: T2-weighted image; D: T2-Spectral Attenuated Inversion Recovery; E: High b-value diffusion weighted imaging; F: Arterial phase magnetic resonance imaging (MRI); G: Portal venous phase MRI; H: Delayed phase MRI; I-L: Hepatobiliary phase MRI.
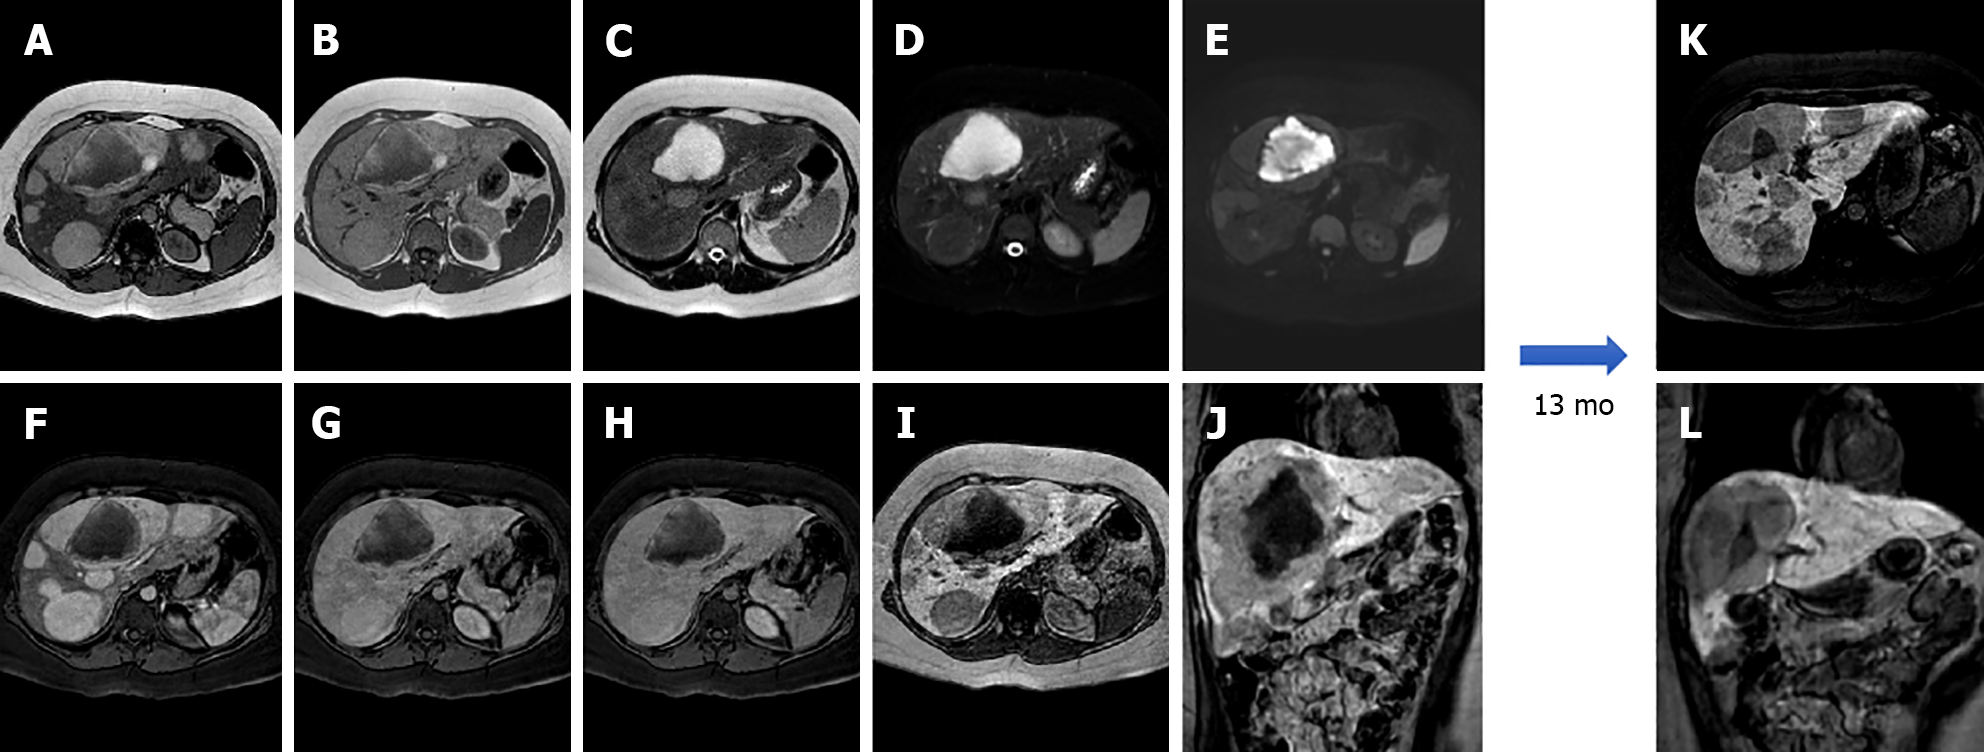
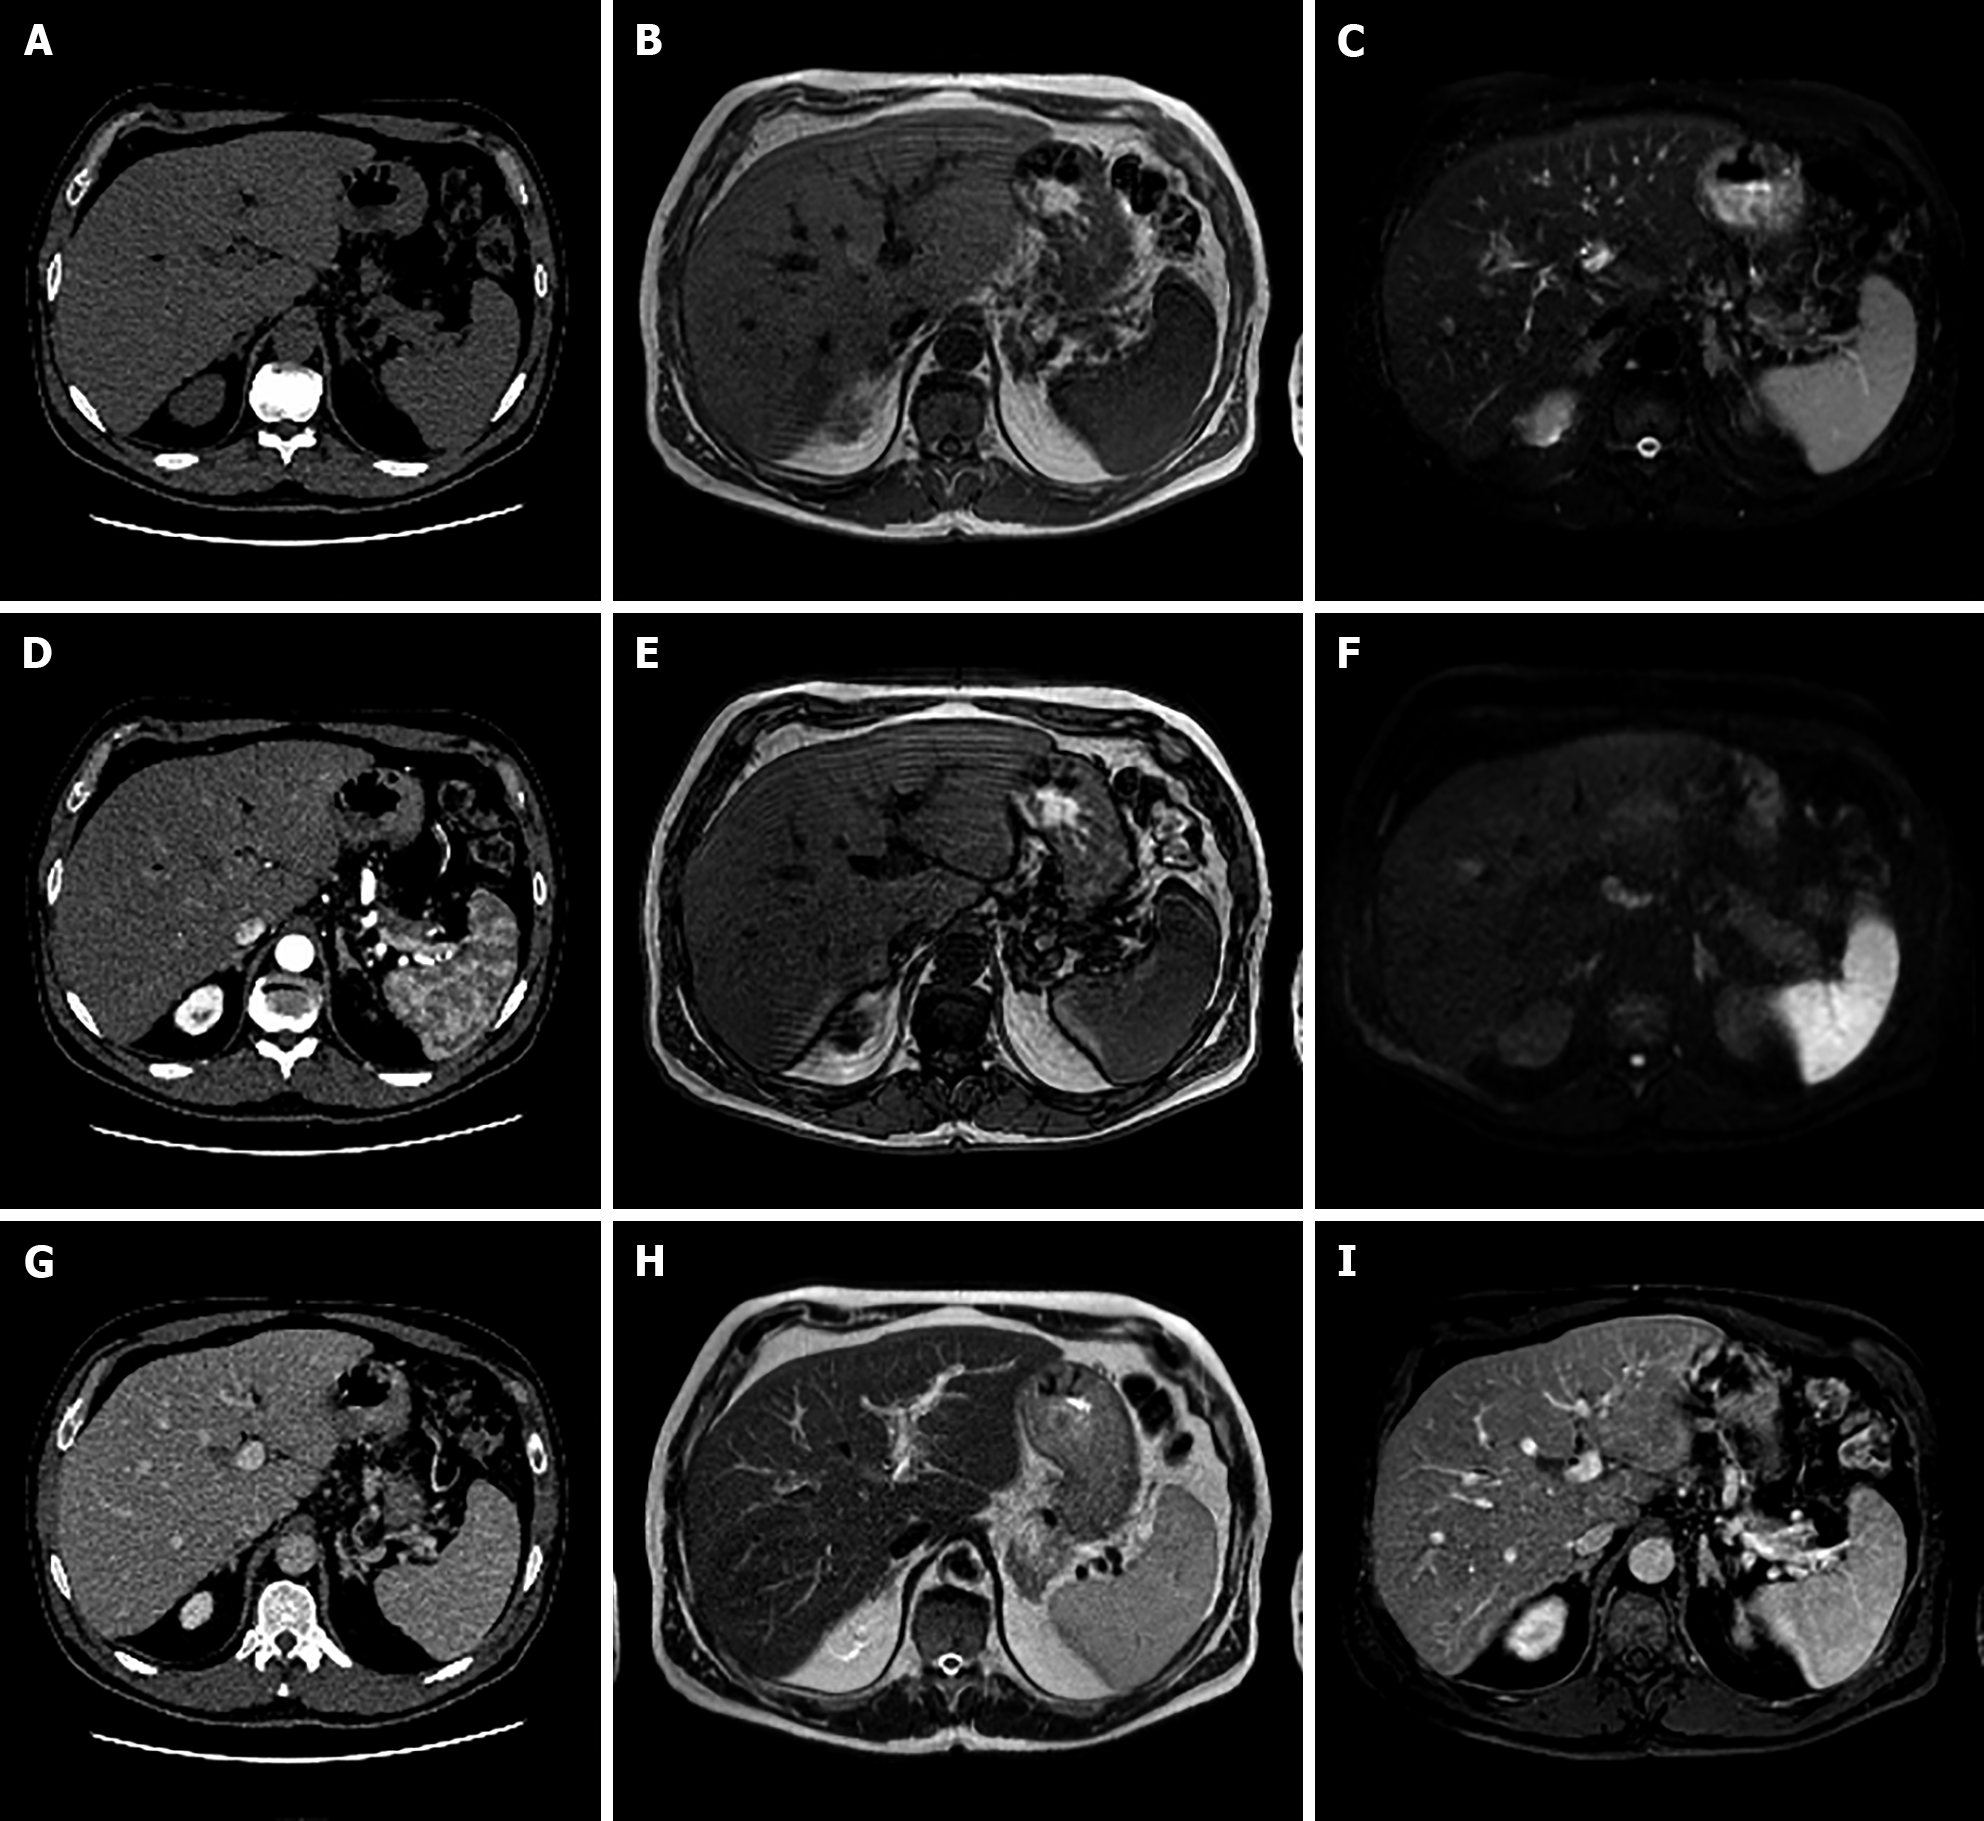
Figure 3 A 25-year-old female with 10-year history of oral contraceptive pill presented to the emergency department with diffuse abdominal pain.
Liver magnetic resonance imaging demonstrated multiple hepatic lesions, the larger 15 cm in diameter in S4-S5-S8 shows iso-hyperintense signal on T1-weighted sequences, with dishomogenous hypointense central component with peripheral hyperintensity. The lesion is isointense on T2-weighted sequences with marked hyperintensity of the central component; on diffusion weighted images the mass presents a slight increase in signal while the central portion has a marked signal increase. At the dynamic study, the mass has wash-in that persists on the portal venous and delayed phase while the central portion illustrates minimum enhancement. The mass is hypointense on the hepatobiliary phase with a marked hypointense central portion. Liver biopsy demonstrated a hepatic adenoma with a bleeding component. At 13 mo follow-up, the lesion presented a slightly reduced diameter while the central bleeding component was almost completely reabsorbed. A: Out-of-phase T1-weighted image; B: In-phase T1-weighted image; C: T2-weighted image; D: T2-Spectral Attenuated Inversion Recovery; E: High b-value diffusion weighted imaging; F: Arterial phase magnetic resonance imaging (MRI); G: Portal venous phase MRI; H: Delayed phase MRI; I-L: Hepatobiliary phase MRI.
Figure 4 A 41-year-old female presented to the emergency department with diffuse abdominal pain and underwent ultrasound examination revealing a 5.
3 cm solid hypoechoic lesion in S7. Liver magnetic resonance imaging confirmed an isointense lesion on T1-weighted sequence, isointense in T2 sequences, with minimum increased signal intensity on diffusion weighted images and isointense on the ADC map. After gadoxetic acid administration the lesion shows intense arterial enhancement; slightly hyperintense on the portal venous and delayed phases. The mass shows hyperintense signal on the hepatobiliary phase. These findings are consistent with typical focal nodular hyperplasia. A: Liver ultrasound image; B: In-phase T1-weighted image; C: Out-of-phase T1-weighted image; D: T2-weighted image; E: T2-Spectral Attenuated Inversion Recovery; F: High b-value diffusion weighted imaging; G: ADC map; H: Liver ultrasound image; I: Pre-contrast phase magnetic resonance imaging (MRI); J: Arterial phase MRI; K: Portal venous phase MRI; L: Delayed phase MRI; M and N: Hepatobiliary phase MRI.
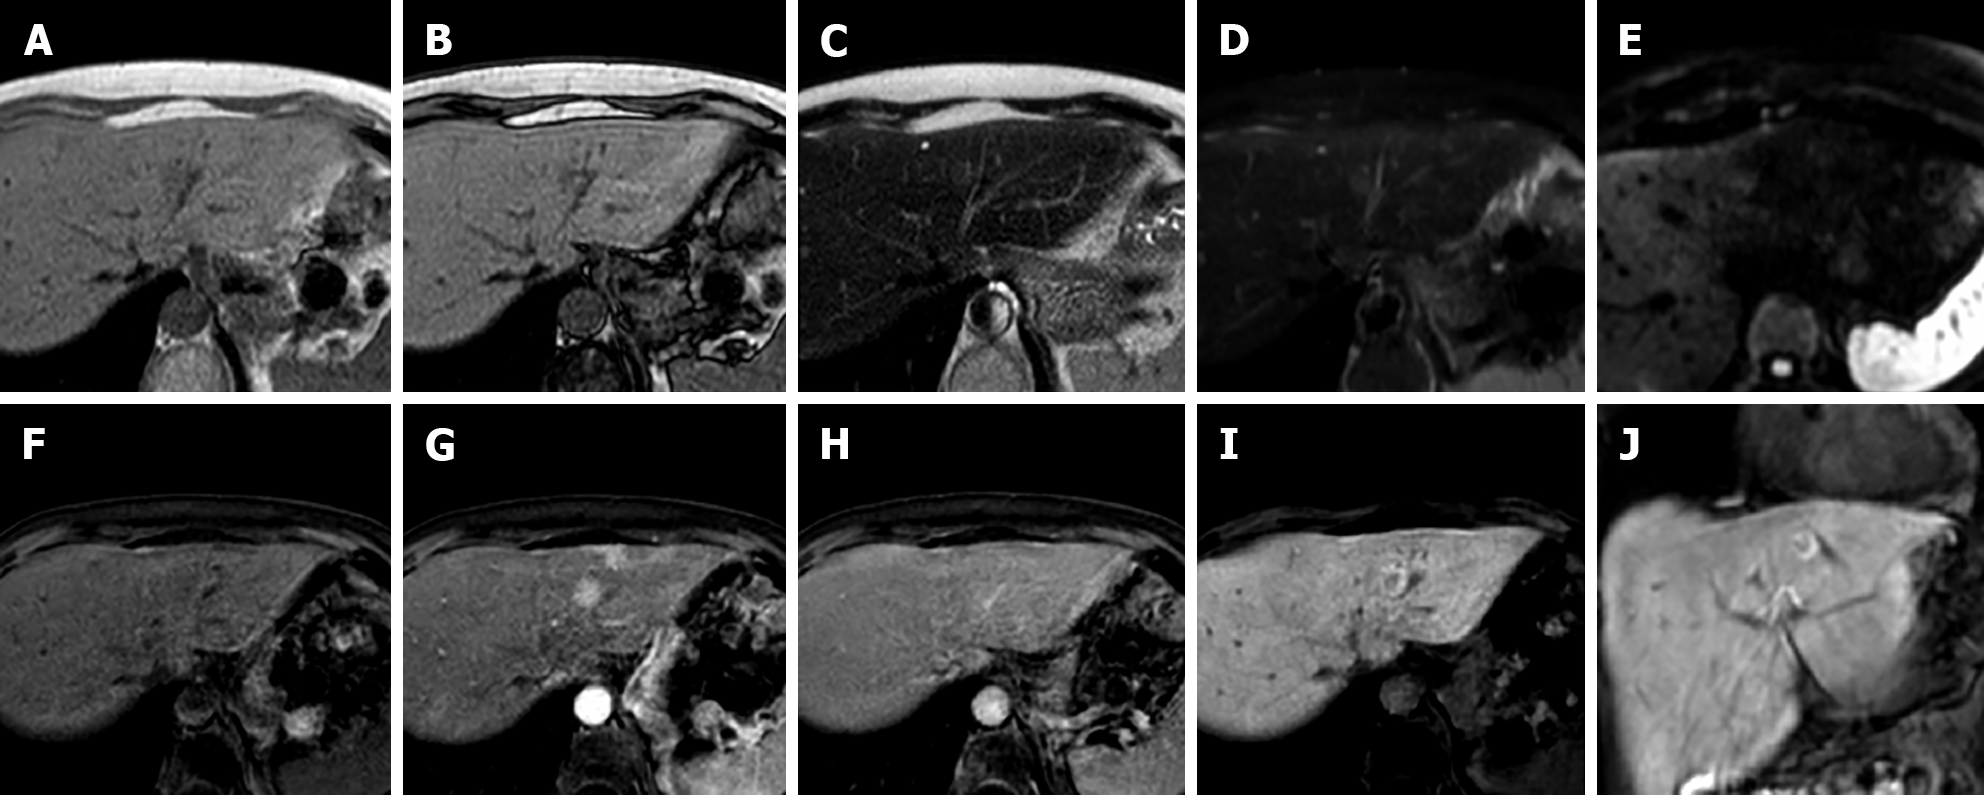
Figure 5 A 56-year-old female with ultrasound evidence of a hyperechoic nodular lesion in S8.
Liver magnetic resonance imaging confirmed a nodule, slightly hypointense on T1-weighted, slightly hyperintense on T2-weighted sequences, without increased signal intensity on diffusion weighted images. After gadoxetic acid administration, the lesion shows homogeneous arterial enhancement, becomes isointense during the portal venous phase, and presents peripheral hyperintensity with a hypointense core on the hepatobiliary phase. Such findings are consistent with atypical focal nodular hyperplasia. A: In-phase T1-weighted image; B: Out-of-phase T1-weighted image; C: T2-weighted image; D: T2-Spectral Attenuated Inversion Recovery; E: High b-value diffusion weighted imaging; F: Pre-contrast phase magnetic resonance imaging (MRI); G: Arterial phase MRI; H: Portal venous phase MRI; I and J: Hepatobiliary phase MRI.
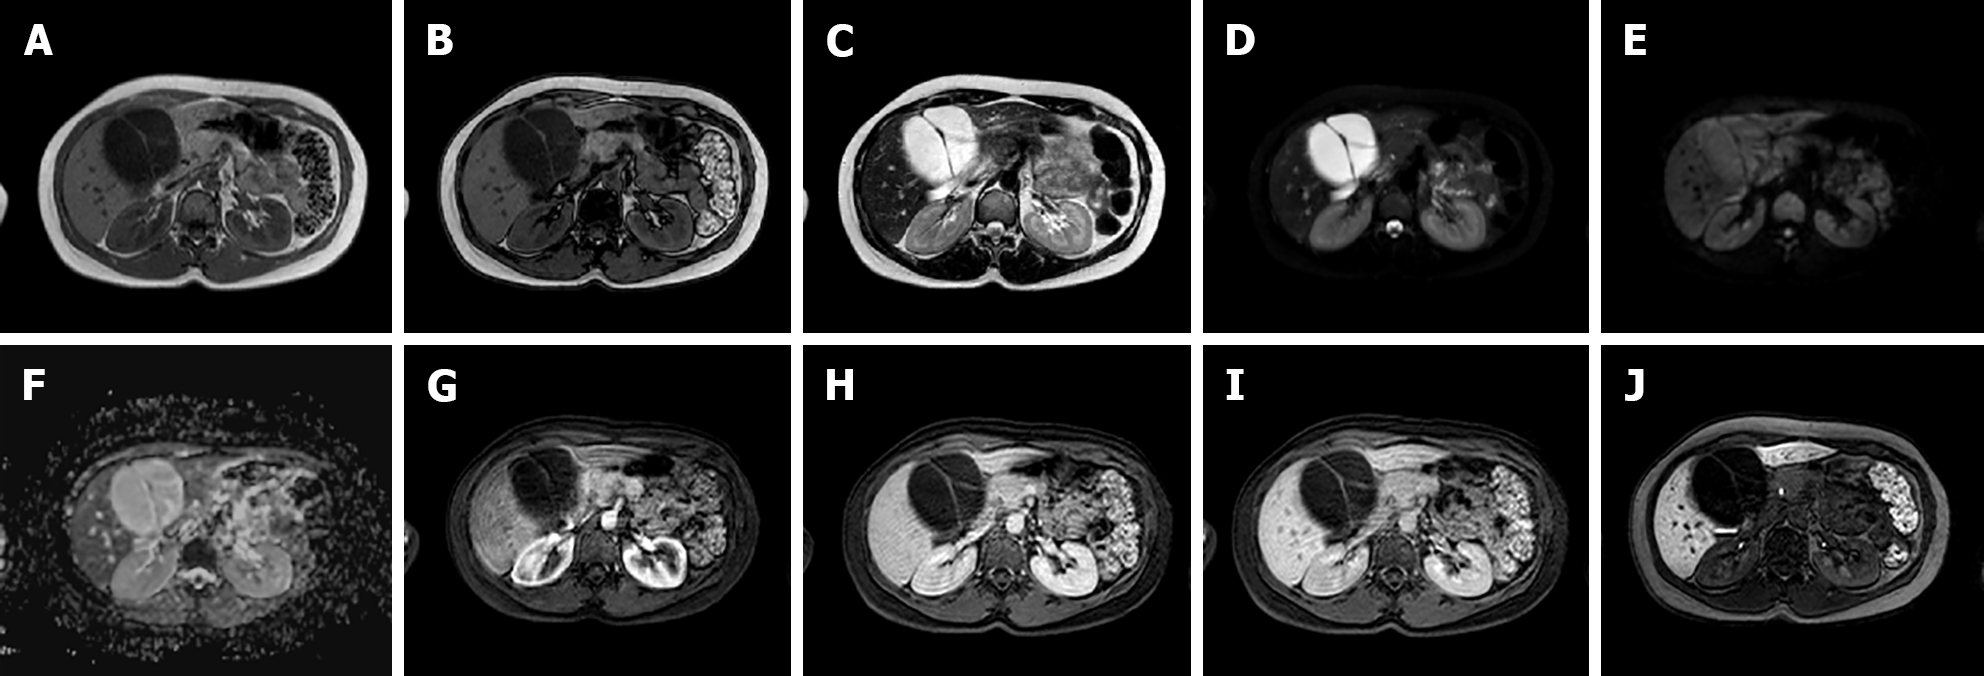
Figure 6 A 34-year-old female patient.
Liver magnetic resonance imaging demonstrated a multiloculated cystic mass in S4b, hypointense on T1 sequences with isointense septa, hyperintense on T2 sequences, slightly hyperintense on diffusion weighted images and without significant restriction on the ADC map. On dynamic study after gadoxetic acid administration, the lesion presents no enhancement even in the septal components. On the hepatobiliary excretion phase the mass is hypointense. After surgical resection, histological examination demonstrated a biliary cystadenoma. A: In-phase T1-weighted image; B: Out-of-phase T1-weighted image; C: T2-weighted image; D: T2-Spectral Attenuated Inversion Recovery; E: High b-value diffusion weighted imaging; F: ADC map; G: Arterial phase magnetic resonance imaging (MRI); H: Portal venous phase MRI; I: Delayed phase MRI; J: Hepatobiliary phase MRI.
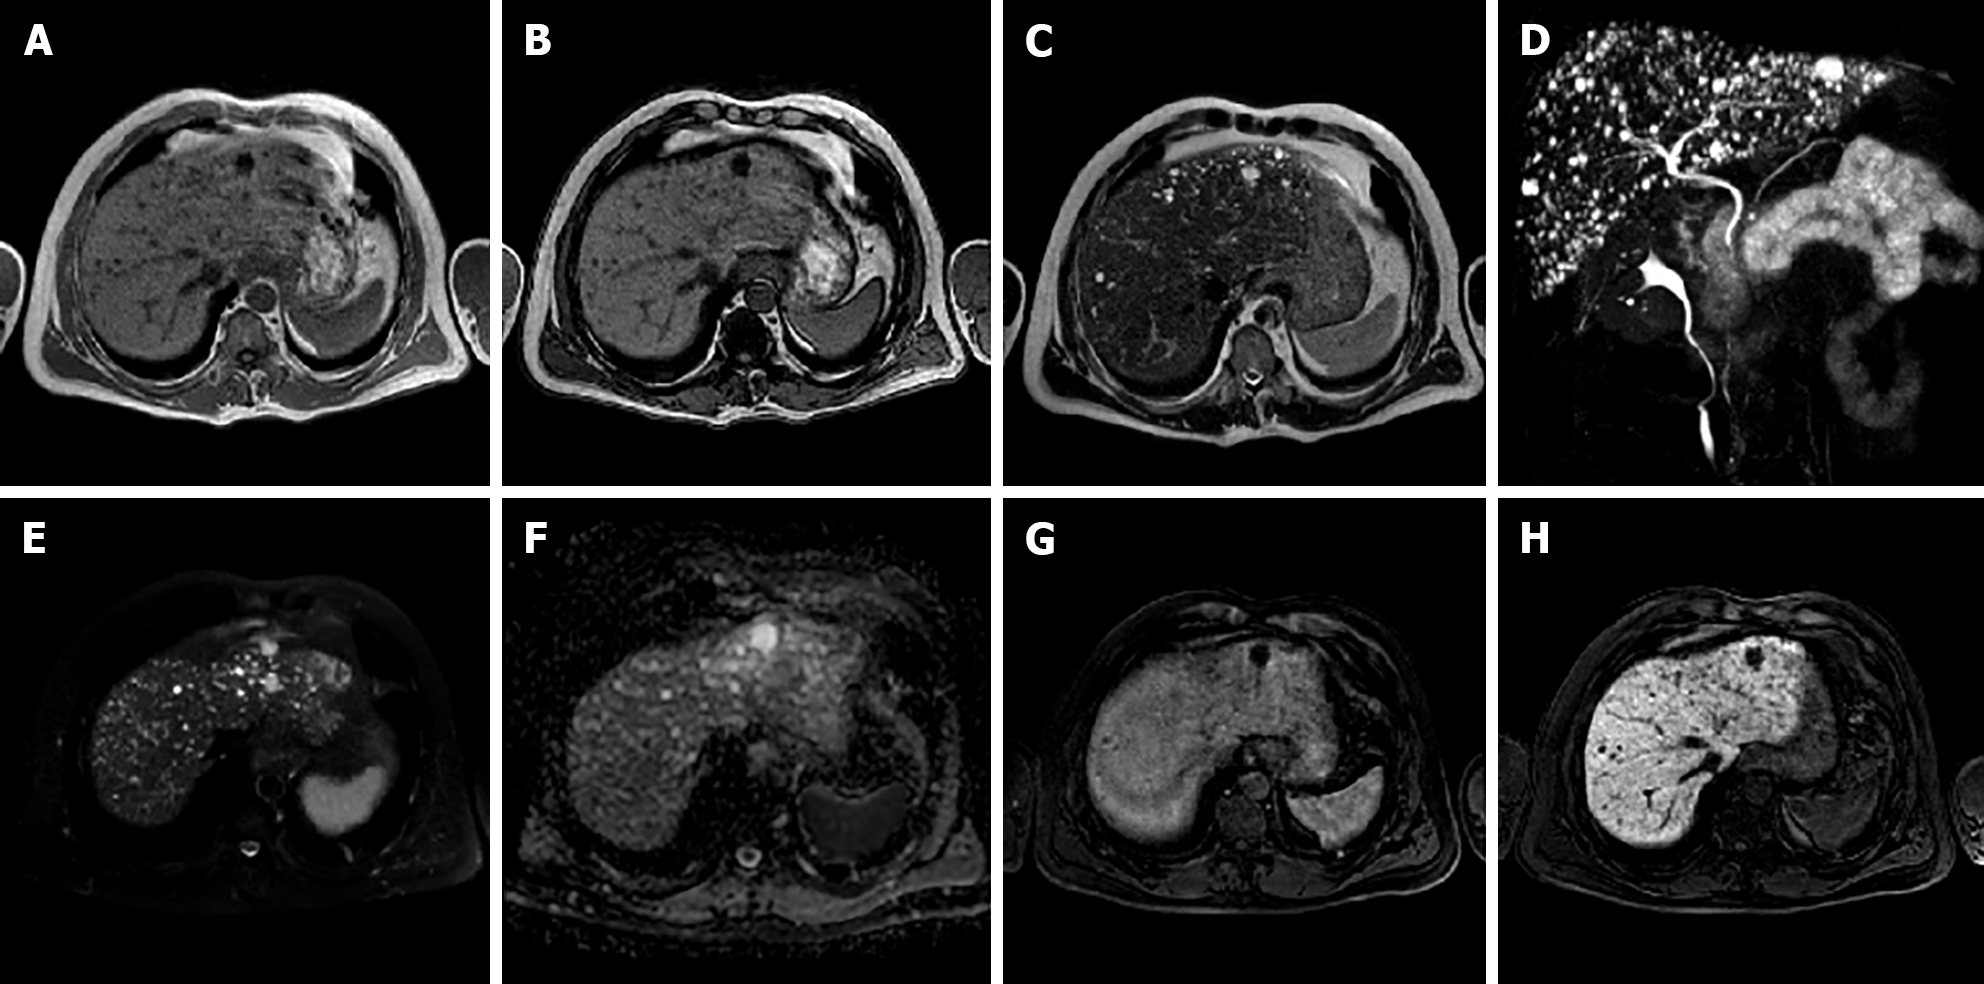
Figure 7 A 50-year-old male.
Liver magnetic resonance imaging demonstrates the presence of multiple bilobar small nodular lesions, hypointense on T1 imaging, hyperintense on T2 sequences, without diffusion restriction on the ADC map and presenting no enhancement on the portal venous phase after contrast injection. These nodules are hypointense on the hepatobiliary phase. Such features and the lack of communications with the biliary tree demonstrated on maximum intensity projection images from magnetic resonance cholangiography are consistent with multiple biliary hamartomas (von Meyenburg complex). A: In-phase T1-weighted image; B: Out-of-phase T1-weighted image; C: T2-weighted image; D: 3D maximum intensity projection reconstruction magnetic resonance cholangiopancreatography; E: High b-value diffusion weighted imaging; F: ADC map; G: Portal venous phase magnetic resonance imaging (MRI); H: Hepatobiliary phase MRI.
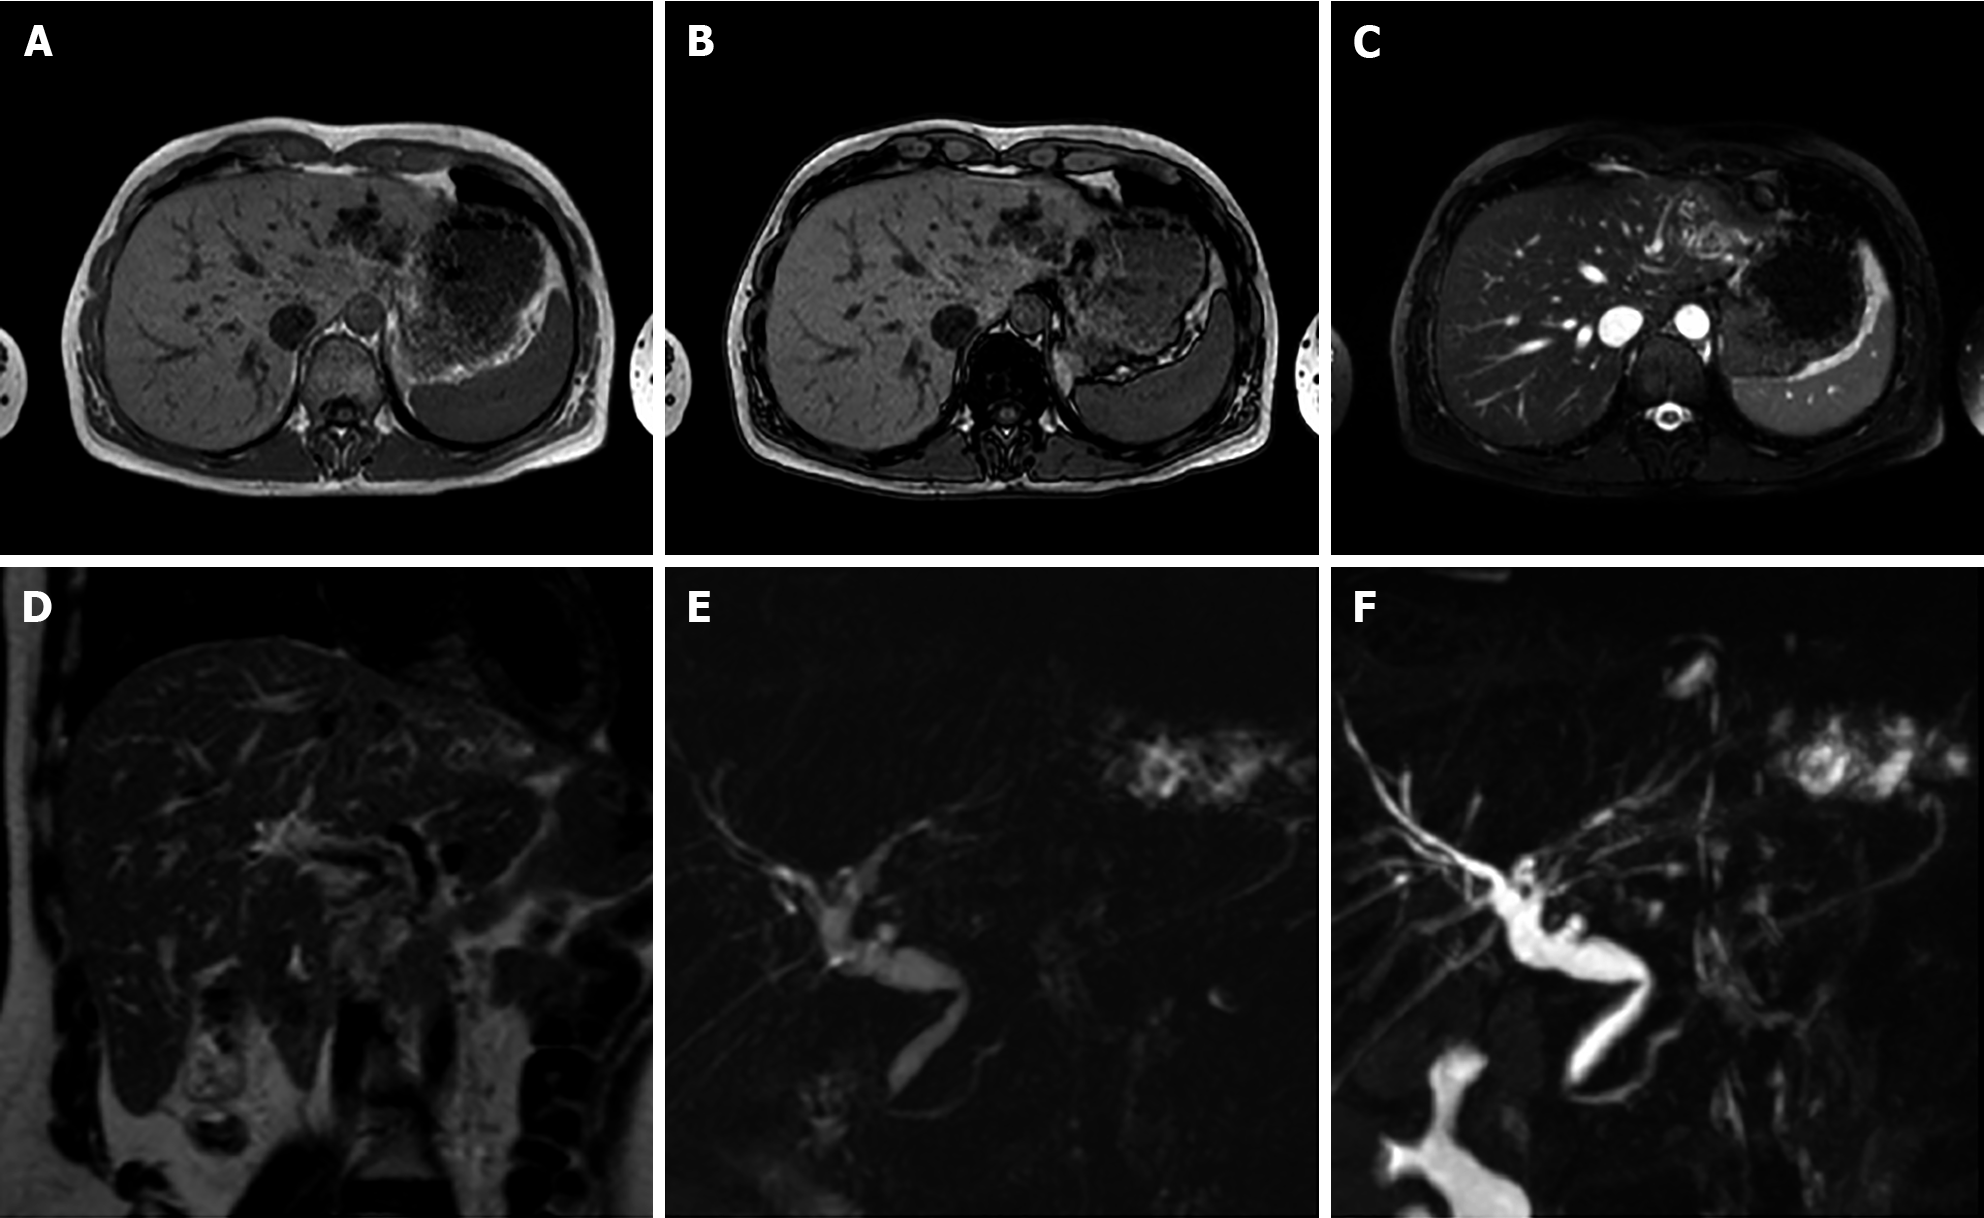
Figure 8 A 40-year-old female.
Liver magnetic resonance imaging demonstrates dilatation of the left biliary hemisystem with multiple voids of signal on long TR sequences compatible with lithiasis. Pathology examination after left hepatectomy confirmed Caroli disease. A: In-phase T1-weighted image; B: Out-of-phase T1-weighted image; C: T2-Spectral Attenuated Inversion Recovery; D: T2-weighted image; E: Single-shot magnetic resonance (MR) cholangiopancreatography; F: 3D maximum intensity projection reconstruction MR cholangiopancreatography.
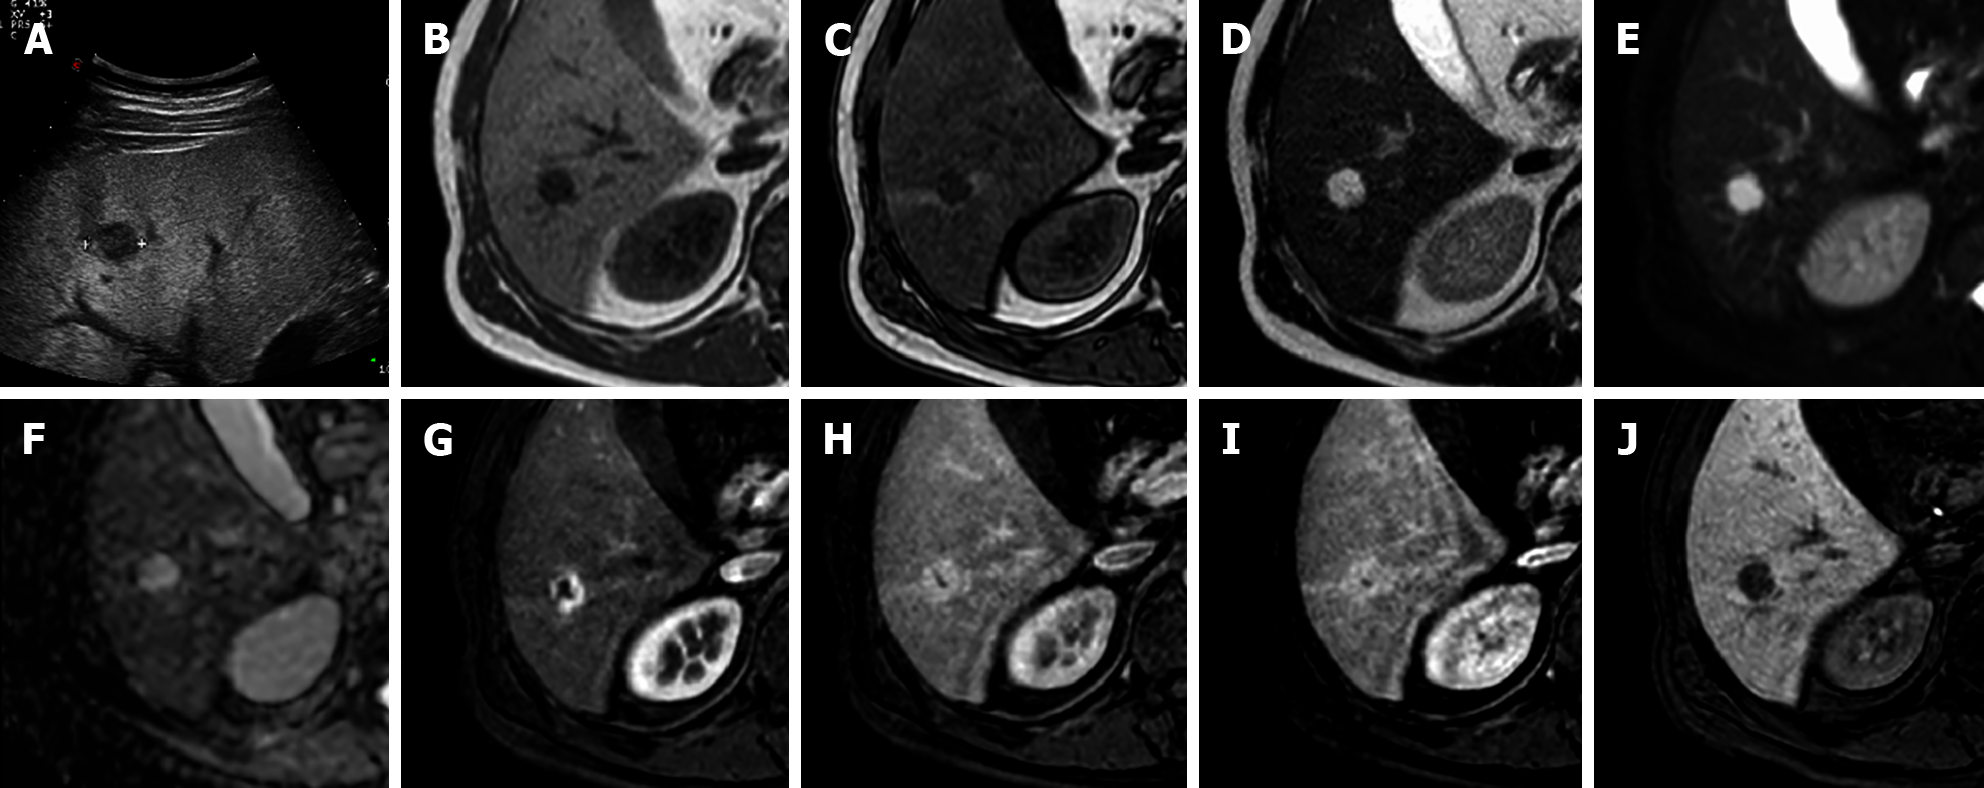
Figure 9 A 42-year-old male underwent ultrasound examination for abdominal discomfort demonstrating diffuse steatosis with a hypoechoic nodule in S6.
Liver magnetic resonance imaging confirmed diffuse steatosis and a hypointense lesion on T1-weighted sequences, hyperintense on long TR sequences and on the ADC map. During dynamic study after intravenous contrast injection, the lesion presents centripetal enhancement and is hypointense on the hepatobiliary phase. These features are consistent with hemangioma. A: Liver ultrasound image; B: In-phase T1-weighted image; C: Out-of-phase T1-weighted image; D: T2-weighted image; E: T2-Spectral Attenuated Inversion Recovery; F: ADC map; G: Arterial phase magnetic resonance imaging (MRI); H: Portal venous phase MRI; I: Delayed phase MRI; J: Hepatobiliary phase MRI.
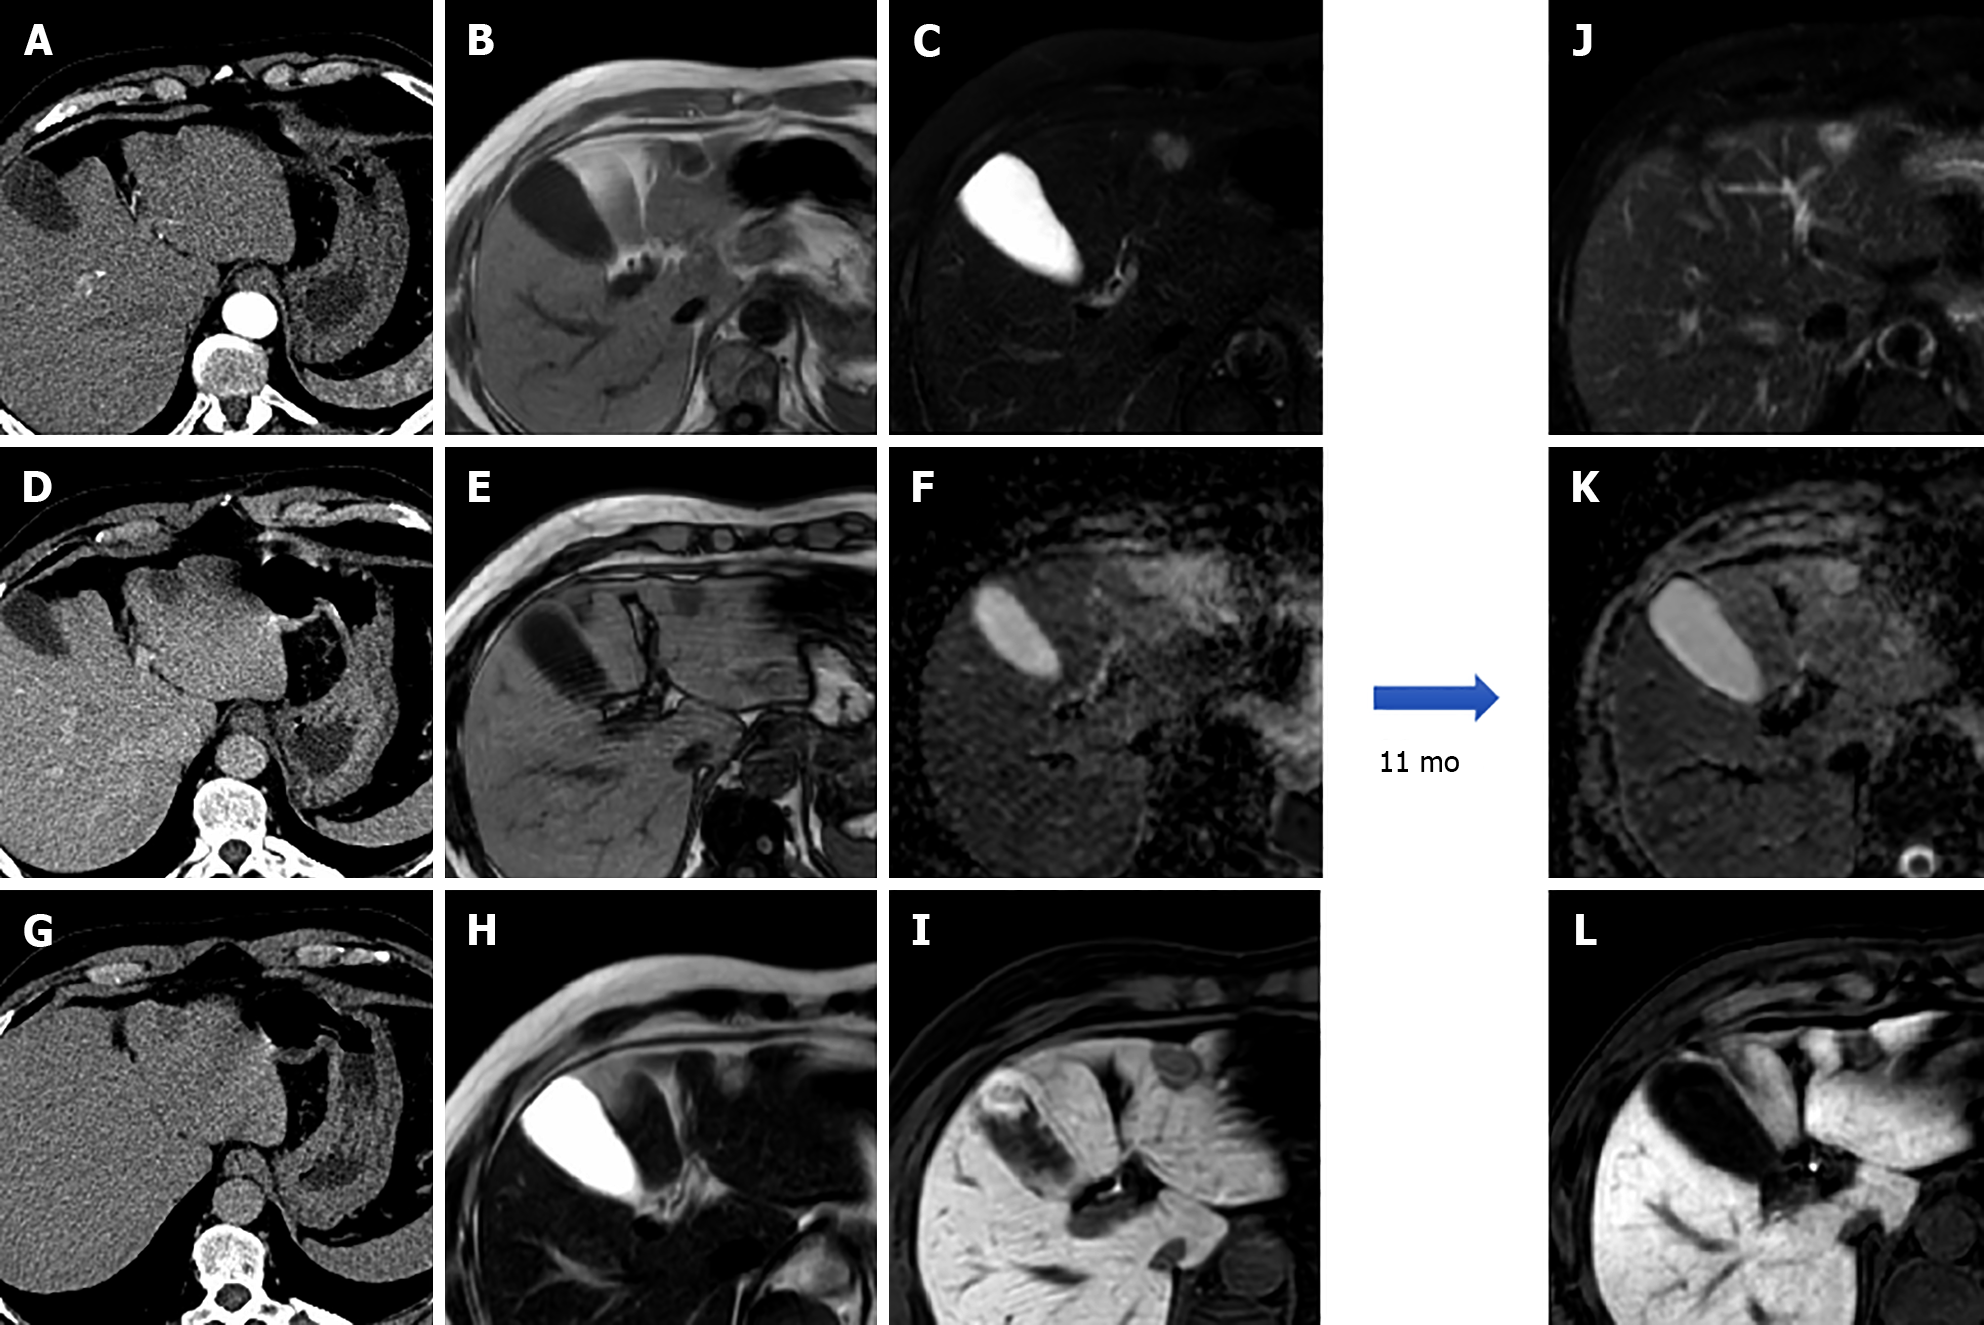
Figure 10 A 57-year-old male underwent abdominal computed tomography scan with contrast for the evaluation of a renal mass demonstrating a hepatic lesion in S3, hypodense on contrast-enhanced computed tomography.
Liver magnetic resonance imaging (MRI) confirmed the presence of a nodule hypointense on T1-weighted sequences, slightly hyperintense on long TR sequences, without significant restriction on the ADC map. During dynamic study after intravenous contrast injection (gadoxetic acid), the lesion does not have significant enhancement and it appears hypointense on the hepatobiliary phase. At 11 mo follow-up, the nodule shows stable dimensions and MRI signal features. These features are consistent with fibrous hemangioma. A: Arterial phase of liver computed tomography (CT); B: In-phase T1-weighted image; C: T2-Spectral Attenuated Inversion Recovery; D: Portal venous phase of liver CT; E: Out-of-phase T1-weighted image; F: ADC map; G: Delayed phase of liver CT; H: T2-weighted image; I: Hepatobiliary phase (HBP) magnetic resonance imaging (MRI); J: T2-Spectral Attenuated Inversion Recovery; K: ADC map; L: HBP MRI.
Figure 11 A 20-year-old female with tuberous sclerosis.
Liver magnetic resonance imaging demonstrates a small focal lesion in S8 hyperintense on in-phase T1-weighted images, with signal loss on opposed-phase sequences with marginal india-ink artifact because of chemical shift, hyperintense on T2 turbo spin echo sequences, hypointense on T2-Spectral Attenuated Inversion Recovery (SPAIR) images, without increased signal on diffusion weighted images and hypointense in all phases during dynamic study and on the hepatobiliary phase (HBP). These features are consistent with lipoma. A second nodule in S2-S3 depicts a hyperintense signal on in-phase T1-weighted images, with signal loss on opposed-phase sequence, hyperintense on T2-TSE images, hypointense on T2-SPAIR sequences, without increased signal on diffusion weighted images. The nodule presents minimal vascularization during dynamic study and appears hypointense on HBP, such features are compatible with angiomyolipoma. A: In-phase T1-weighted image; B: Out-of-phase T1-weighted image; C: T2-weighted image; D: T2-Spectral Attenuated Inversion Recovery (SPAIR); E: High b-value diffusion weighted imaging; F: Portal venous phase magnetic resonance imaging (MRI); G: Hepatobiliary phase (HBP) MRI; H: In-phase T1-weighted image; I: Out-of-phase T1-weighted image; J: T2-weighted image; K: T2-SPAIR; L: High b-value diffusion weighted imaging; M: portal venous phase MRI; N: HBP MRI.
Figure 12 A 50-year-old male, unremarkable past medical history.
Multiphase abdominal computed tomography study shows a hypodense liver area near the porta hepatis. Subsequent magnetic resonance imaging liver study confirmed a hilar area slightly hyperintense on T1 in-phase sequence, with signal loss on opposed-phase images, slightly hyperintense on T2-turbo spin echo images, hypointense on T2-Spectral Attenuated Inversion Recovery images, without significant increased signal on diffusion weighted images and with no contrast enhancement on dynamic study. These features are consistent with an area of focal fatty infiltration. A: Unenhanced liver computed tomography (CT); B: In-phase T1-weighted image; C: T2-Spectral Attenuated Inversion Recovery; D: Arterial phase of liver CT; E: Out-of-phase T1-weighted image; F: High b-value diffusion weighted imaging; G: Portal venous phase of liver CT; H: T2-weighted image; I: Portal venous phase magnetic resonance imaging.
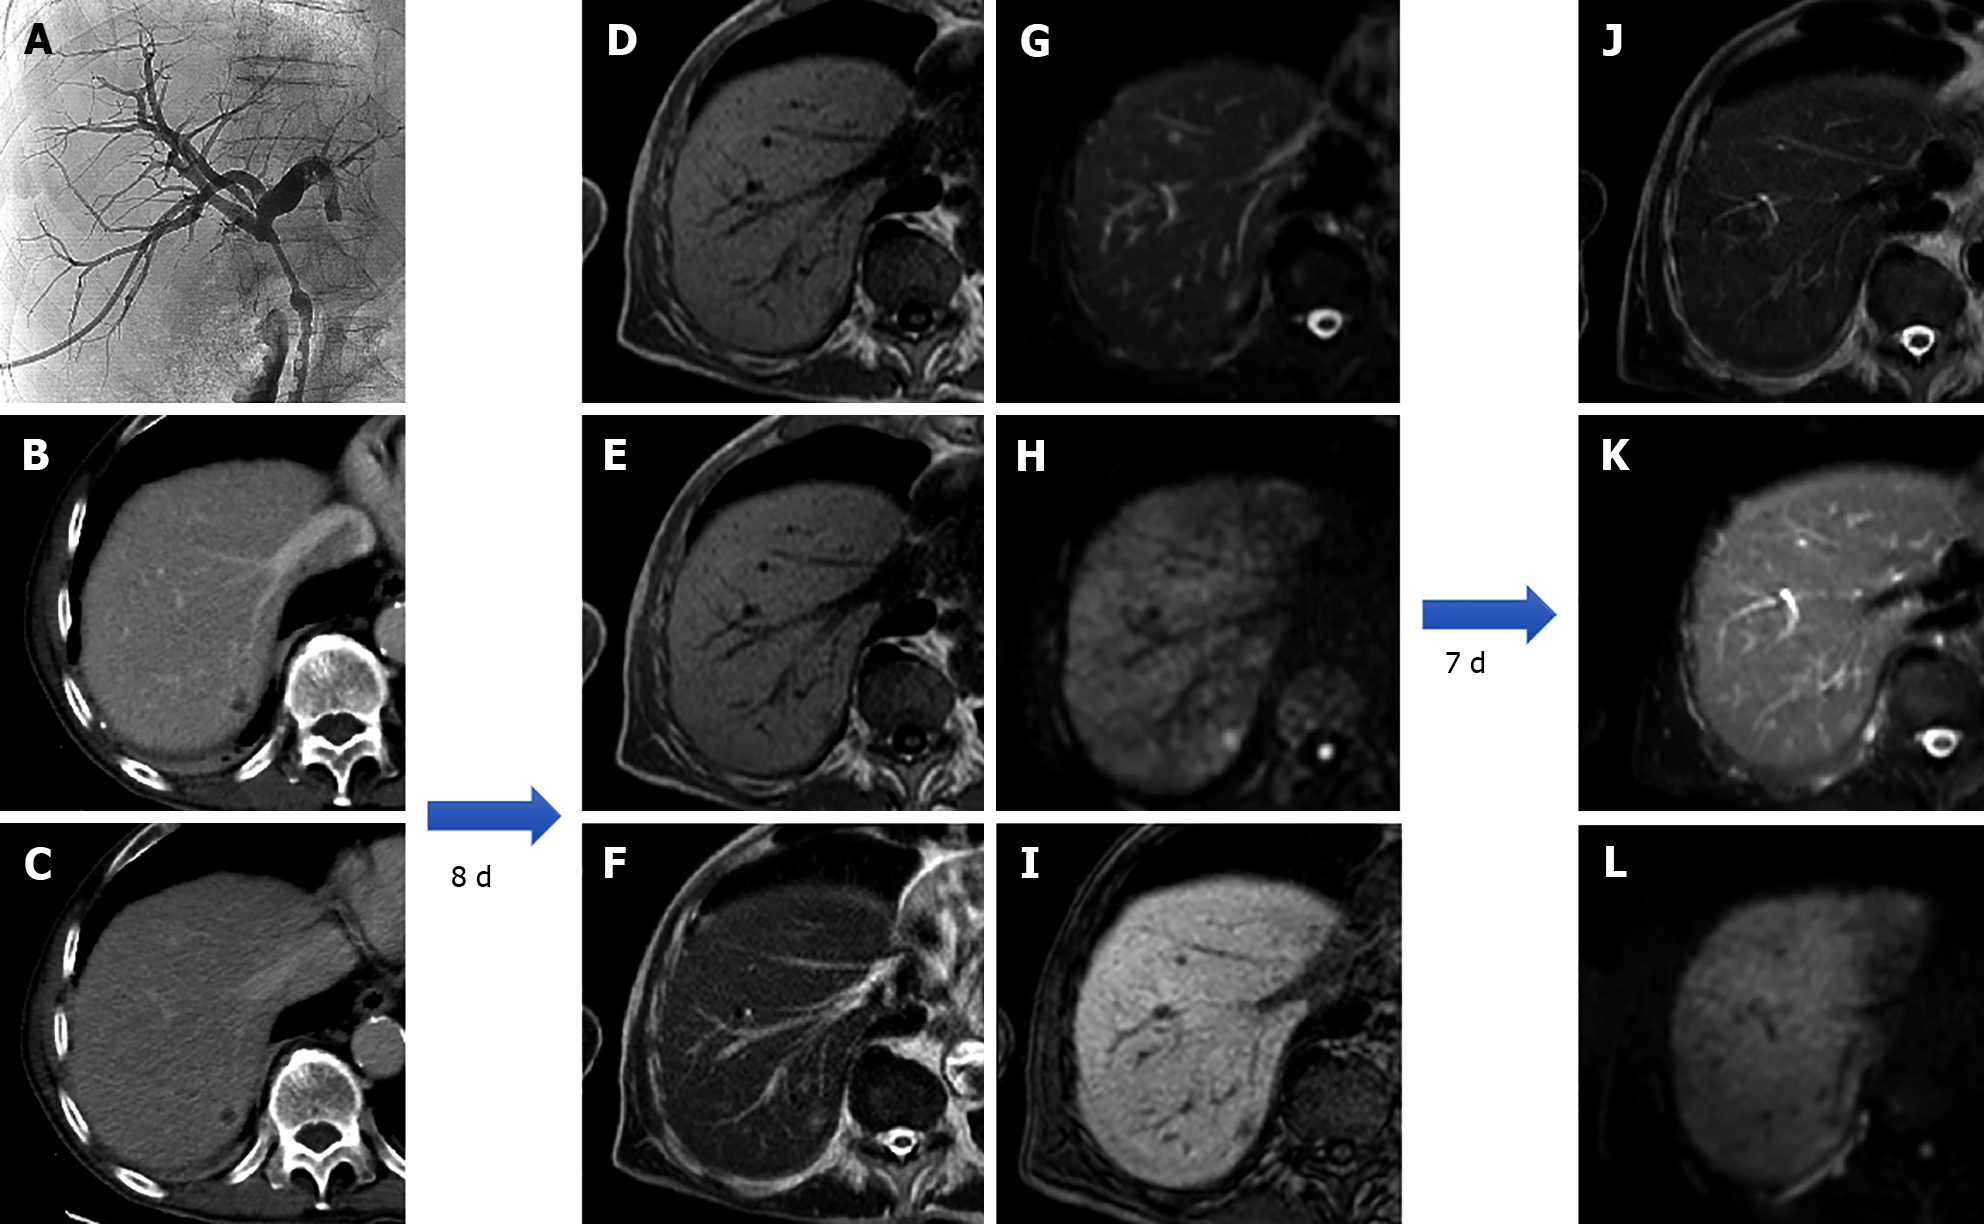
Figure 13 An 80-year-old patient with the finding of common hepatic bile duct stenosis.
Cholangiography procedure with the placement of biliary drainage in which histological diagnosis of the biliary tract suggested adenocarcinoma of the main biliary duct. Following an episode of fever, increase in white blood cells (13.02 × 10⁻⁹/L) and C-reactive protein (90.1 mg/L) computed tomography examination showed a small hepatic hypodensity in the 7th segment. Liver magnetic resonance imaging (MRI) performed after a few days of therapy shows a nodular lesion, hypointense on the T1-weighted sequences, slightly hyperintense in the T2 sequences, with increased signal on diffusion weighted imaging (DWI) and hypointense signal on the hepatobiliary phase. A 7-d follow-up liver MRI examination showed a further evolution of the lesion with evidence of a very slight hyperintense signal on T2 sequences and almost disappearance of the lesion itself on DWI, which confirmed the diagnosis of hepatic abscess. A: Percutaneous transhepatic cholangiography; B: Portal venous phase of liver computed tomography (CT); C: Delayed phase of liver CT; D: In-phase T1-weighted image; E: Out-of-phase T1-weighted image; F: T2-weighted image; G: T2-Spectral Attenuated Inversion Recovery (SPAIR); H: High b-value diffusion weighted imaging; I: Hepatobiliary phase magnetic resonance imaging; L: T2-weighted image; M: T2-SPAIR; N: high b-value DWI.
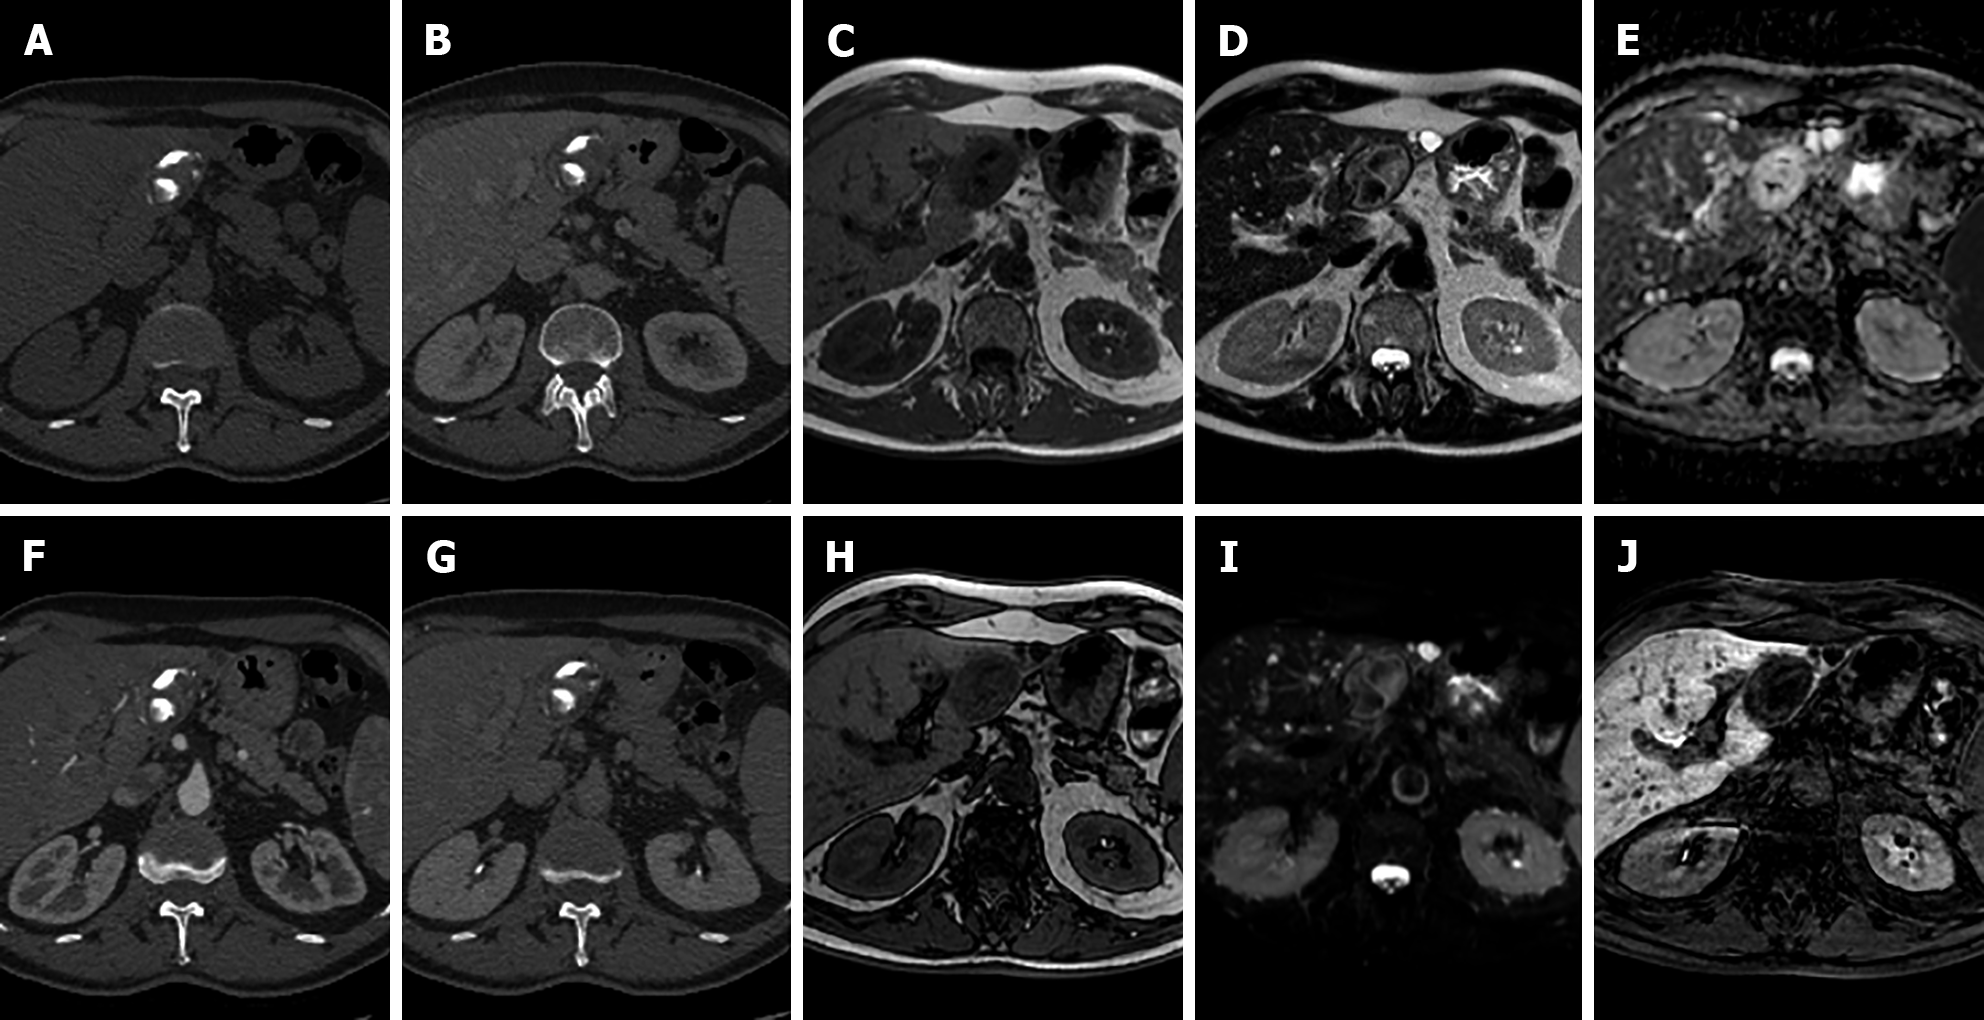
Figure 14 A 67-year-old male who underwent multiphasic abdominal computed tomography scan demonstrated a lesion with gross calcifications in S3 that did not present contrast enhancement in any phase.
Liver magnetic resonance imaging confirmed a nodular formation, hypointense on T1-weighted sequences, isointense on long TR sequences with more hypointense components corresponding to calcification on computed tomography images, without significant restriction on diffusion weighted images and hypointense on the hepatobiliary phase. These features are consistent with a calcified echinococcal cyst. A: Unenhanced liver computed tomography (CT); B: Portal venous phase of liver CT; C: In-phase T1-weighted image; D: T2-weighted image; E: ADC map; F: Portal venous phase of liver CT; G: Delayed phase of liver CT; H: Out-of-phase T1-weighted image; I: T2-Spectral Attenuated Inversion Recovery; L: Hepatobiliary phase magnetic resonance imaging.
Figure 15 A 38-year-old female, smoker, polycystic ovary syndrome, previous appendicectomy.
Abdominal ultrasound performed due to neutropenia demonstrated hyperechoic liver nodules. Subsequent liver magnetic resonance imaging confirmed multiple liver nodules hypointense in T1-weighted sequences slightly hyperintense on T2 sequences, with increased signal on diffusion weighted images, without contrast enhancement after dynamic study with gadoxetic. Lesions are hypointense on the hepatobiliary phase. Chest computed tomography with contrast demonstrated bilateral nodules with a perilymphatic pattern and a bigger lesion with satellite nodules (galaxy sign) on the right; increased hilar lymph nodes were present. Transbronchial biopsy demonstrated noncaseating granulomas which led to the diagnosis of sarcoidosis. A: Liver ultrasound image; B: Out-of-phase T1-weighted image; C: In-phase T1-weighted image; D: T2-turbo spin echo; E: Portal venous phase magnetic resonance imaging (MRI); F: Chest computed tomography (CT) with pulmonary parenchymal window; G: Ultrasound image; H: T2-Spectral Attenuated Inversion Recovery; I: High b-value diffusion weighted imaging; J: Arterial phase MRI; K: Hepatobiliary phase MRI; L: Chest CT with mediastinal window.
- Citation: Gatti M, Maino C, Tore D, Carisio A, Darvizeh F, Tricarico E, Inchingolo R, Ippolito D, Faletti R. Benign focal liver lesions: The role of magnetic resonance imaging. World J Hepatol 2022; 14(5): 923-943
- URL: https://www.wjgnet.com/1948-5182/full/v14/i5/923.htm
- DOI: https://dx.doi.org/10.4254/wjh.v14.i5.923


