Copyright
©The Author(s) 2022.
World J Hepatol. May 27, 2022; 14(5): 923-943
Published online May 27, 2022. doi: 10.4254/wjh.v14.i5.923
Published online May 27, 2022. doi: 10.4254/wjh.v14.i5.923
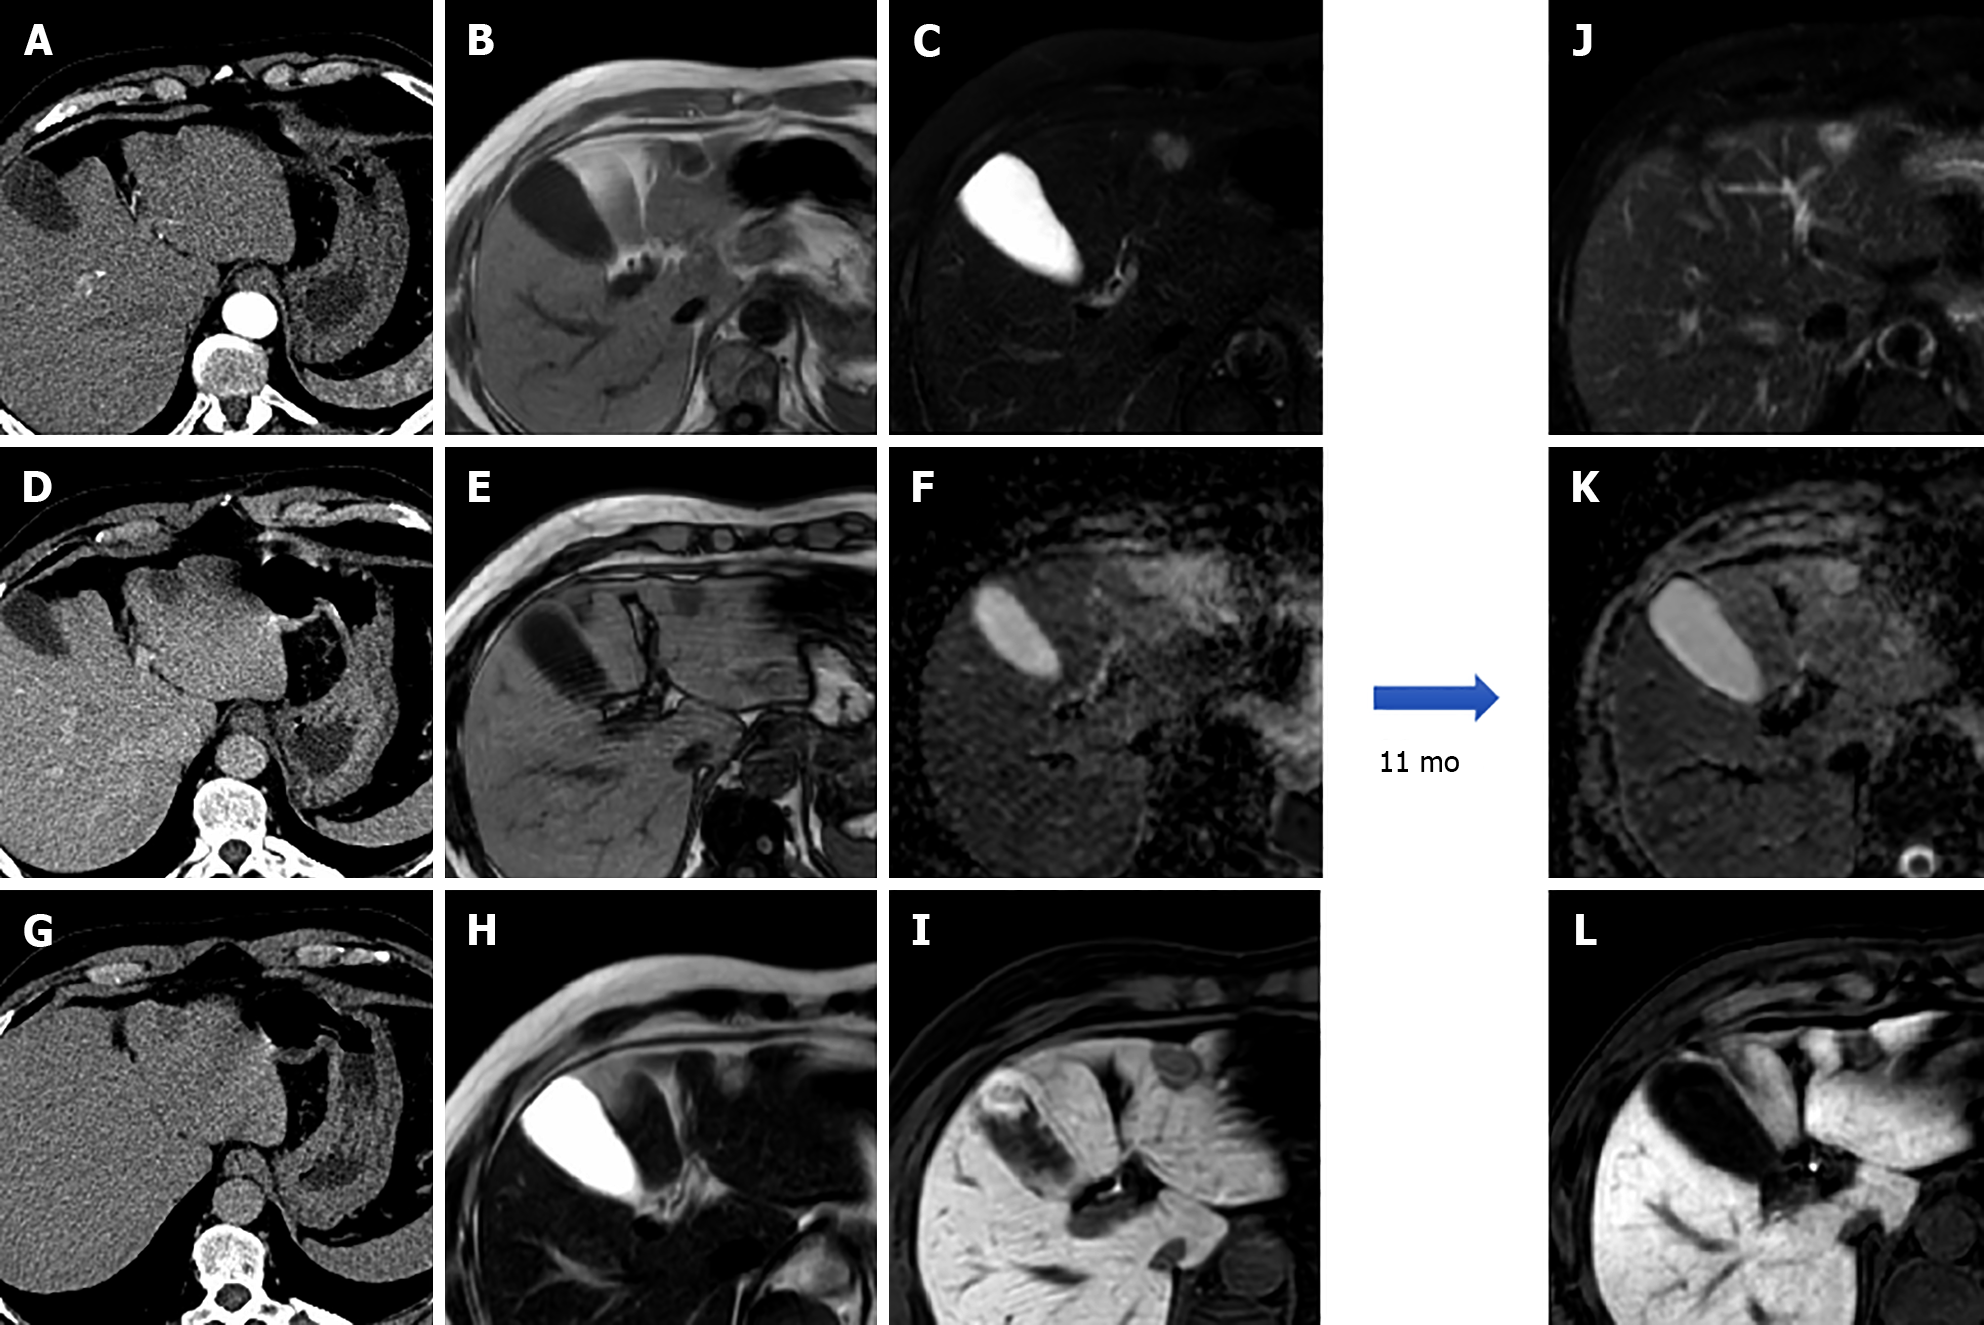
Figure 10 A 57-year-old male underwent abdominal computed tomography scan with contrast for the evaluation of a renal mass demonstrating a hepatic lesion in S3, hypodense on contrast-enhanced computed tomography.
Liver magnetic resonance imaging (MRI) confirmed the presence of a nodule hypointense on T1-weighted sequences, slightly hyperintense on long TR sequences, without significant restriction on the ADC map. During dynamic study after intravenous contrast injection (gadoxetic acid), the lesion does not have significant enhancement and it appears hypointense on the hepatobiliary phase. At 11 mo follow-up, the nodule shows stable dimensions and MRI signal features. These features are consistent with fibrous hemangioma. A: Arterial phase of liver computed tomography (CT); B: In-phase T1-weighted image; C: T2-Spectral Attenuated Inversion Recovery; D: Portal venous phase of liver CT; E: Out-of-phase T1-weighted image; F: ADC map; G: Delayed phase of liver CT; H: T2-weighted image; I: Hepatobiliary phase (HBP) magnetic resonance imaging (MRI); J: T2-Spectral Attenuated Inversion Recovery; K: ADC map; L: HBP MRI.
- Citation: Gatti M, Maino C, Tore D, Carisio A, Darvizeh F, Tricarico E, Inchingolo R, Ippolito D, Faletti R. Benign focal liver lesions: The role of magnetic resonance imaging. World J Hepatol 2022; 14(5): 923-943
- URL: https://www.wjgnet.com/1948-5182/full/v14/i5/923.htm
- DOI: https://dx.doi.org/10.4254/wjh.v14.i5.923


