Copyright
©2013 Baishideng Publishing Group Co.
World J Stem Cells. Jul 26, 2013; 5(3): 73-85
Published online Jul 26, 2013. doi: 10.4252/wjsc.v5.i3.73
Published online Jul 26, 2013. doi: 10.4252/wjsc.v5.i3.73
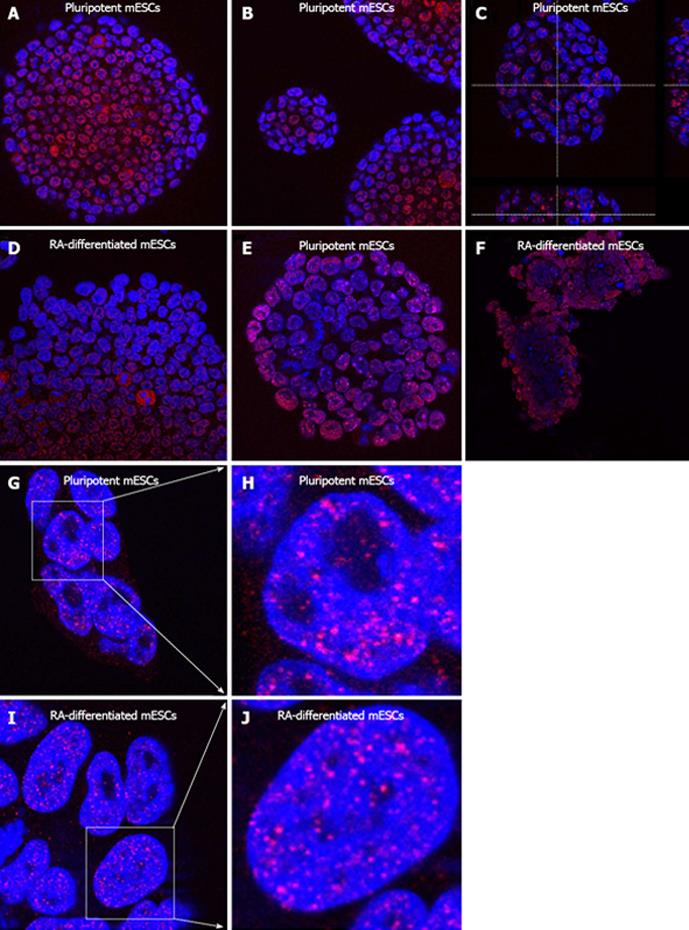
Figure 2 Morphology of colonies of mouse embryonic stem cells (line D3).
A-D: The splicing factor stem cells (SC)-35 (red) was visualized in the cell nuclei (blue) within mouse embryonic stem cells (mESC) colonies in pluripotent cells and after retinoic acid (RA)-induced cell differentiation; E, F: Cell nuclei (blue) that were positive for heterochromatin protein 1 (HP1)β (red) were mapped within a pluripotent mESC colony and after RA-induced differentiation; G-J: Pattern of polycomb group protein BMI1 (red) in pluripotent and RA-differentiated ESCs (blue). Individual nuclei in frames G, I were magnified in panels H and J.
- Citation: Přikrylová T, Pacherník J, Kozubek S, Bártová E. Epigenetics and chromatin plasticity in embryonic stem cells. World J Stem Cells 2013; 5(3): 73-85
- URL: https://www.wjgnet.com/1948-0210/full/v5/i3/73.htm
- DOI: https://dx.doi.org/10.4252/wjsc.v5.i3.73


