
















Copyright: ©Author(s) 2026.
World J Stem Cells. Sep 26, 2026; 18(9): 123933
Published online Sep 26, 2026. doi: 10.4252/wjsc.123933
Published online Sep 26, 2026. doi: 10.4252/wjsc.123933
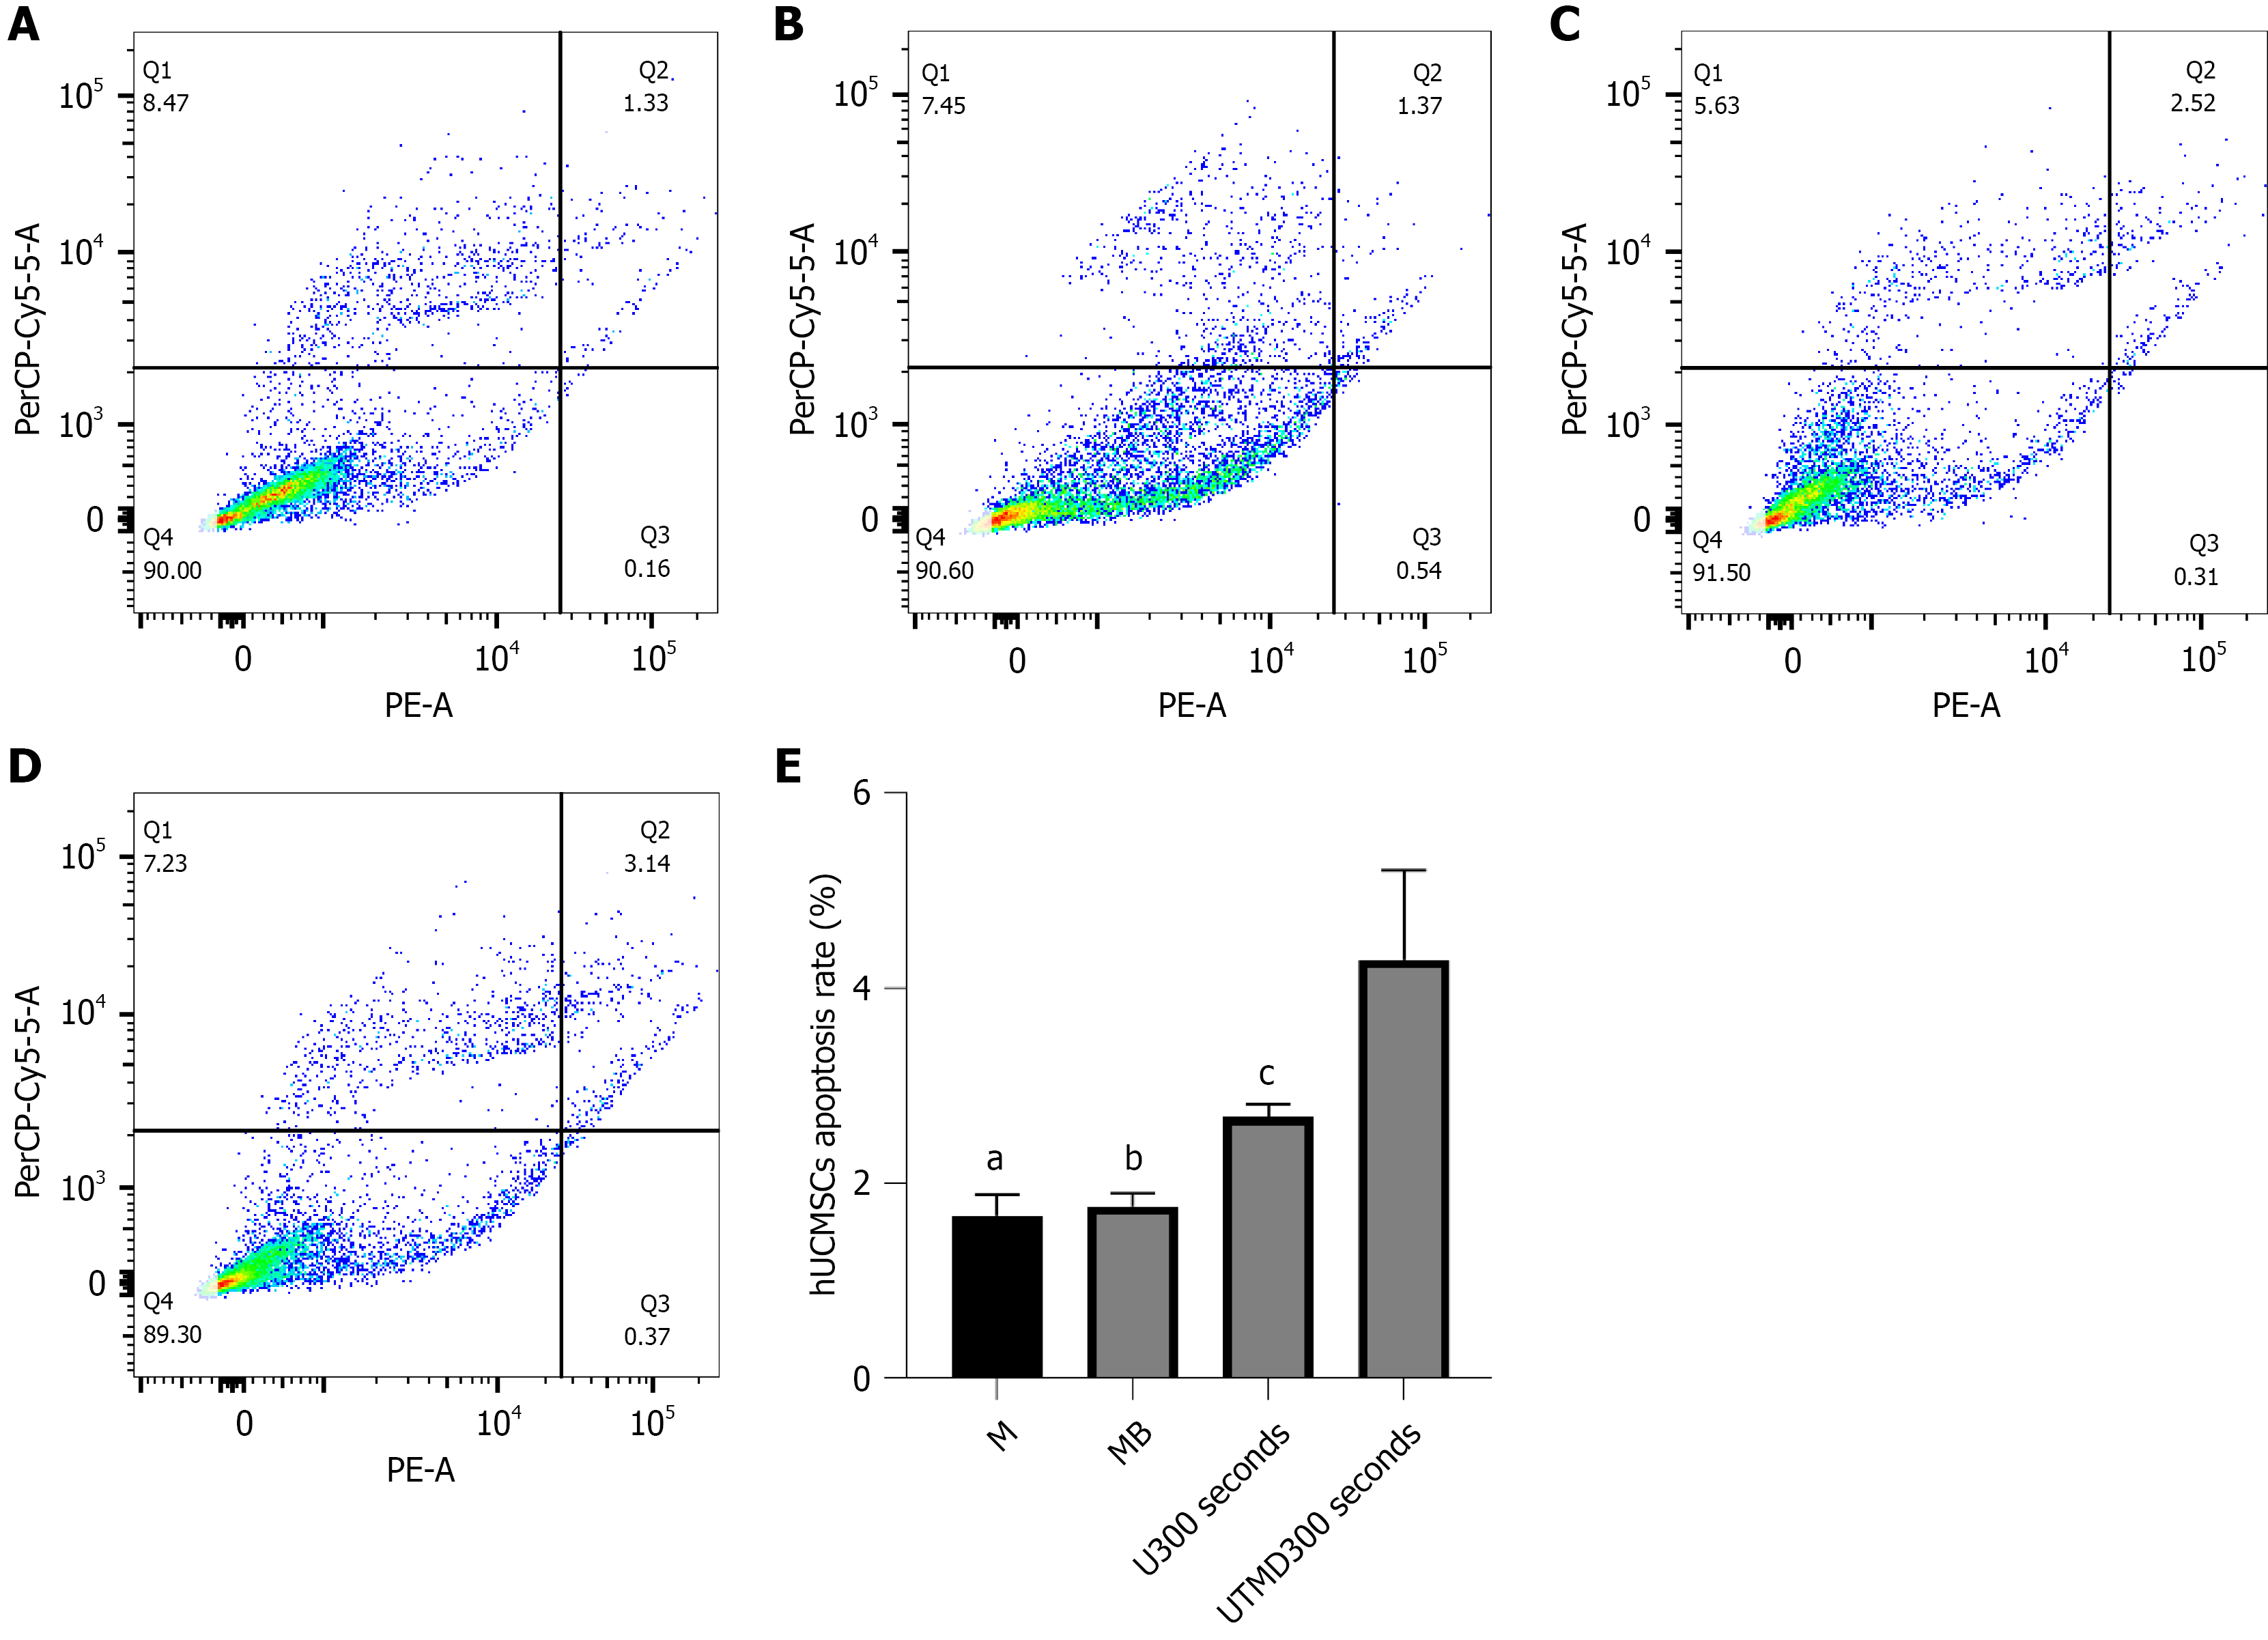
Figure 7 Apoptosis of human umbilical cord mesenchymal stem cells following different treatments, assessed by flow cytometry.
A-D: Representative flow cytometric scatter plots of apoptotic cells in the M (untreated control), MB (microbubbles alone), U300s (ultrasound alone for 300 seconds), and UTMD300s (ultrasound-targeted microbubble destruction for 300 seconds) groups, respectively; E: Quantitative analysis of the total apoptosis rate (early plus late apoptosis) in each group. Statistical significance: aP < 0.01 vs the UTMD300s group; bP < 0.01 vs the UTMD300s group; cP < 0.05 vs the M group. n = 4. All data are presented as mean ± SD. Statistical comparisons were performed using one-way ANOVA followed by Tukey’s post hoc test. UTMD: Ultrasound-targeted microbubble destruction.
- Citation: Zhang P, La BY, Zhang ML, Rewan B, Zhang LY, La XL. Experimental study on ultrasound-targeted microbubble destruction promoting the proliferation, migration of human umbilical cord mesenchymal stem cells. World J Stem Cells 2026; 18(9): 123933
- URL: https://www.wjgnet.com/1948-0210/full/v18/i9/123933.htm
- DOI: https://dx.doi.org/10.4252/wjsc.123933