Copyright
©The Author(s) 2025.
World J Stem Cells. Jun 26, 2025; 17(6): 106520
Published online Jun 26, 2025. doi: 10.4252/wjsc.v17.i6.106520
Published online Jun 26, 2025. doi: 10.4252/wjsc.v17.i6.106520
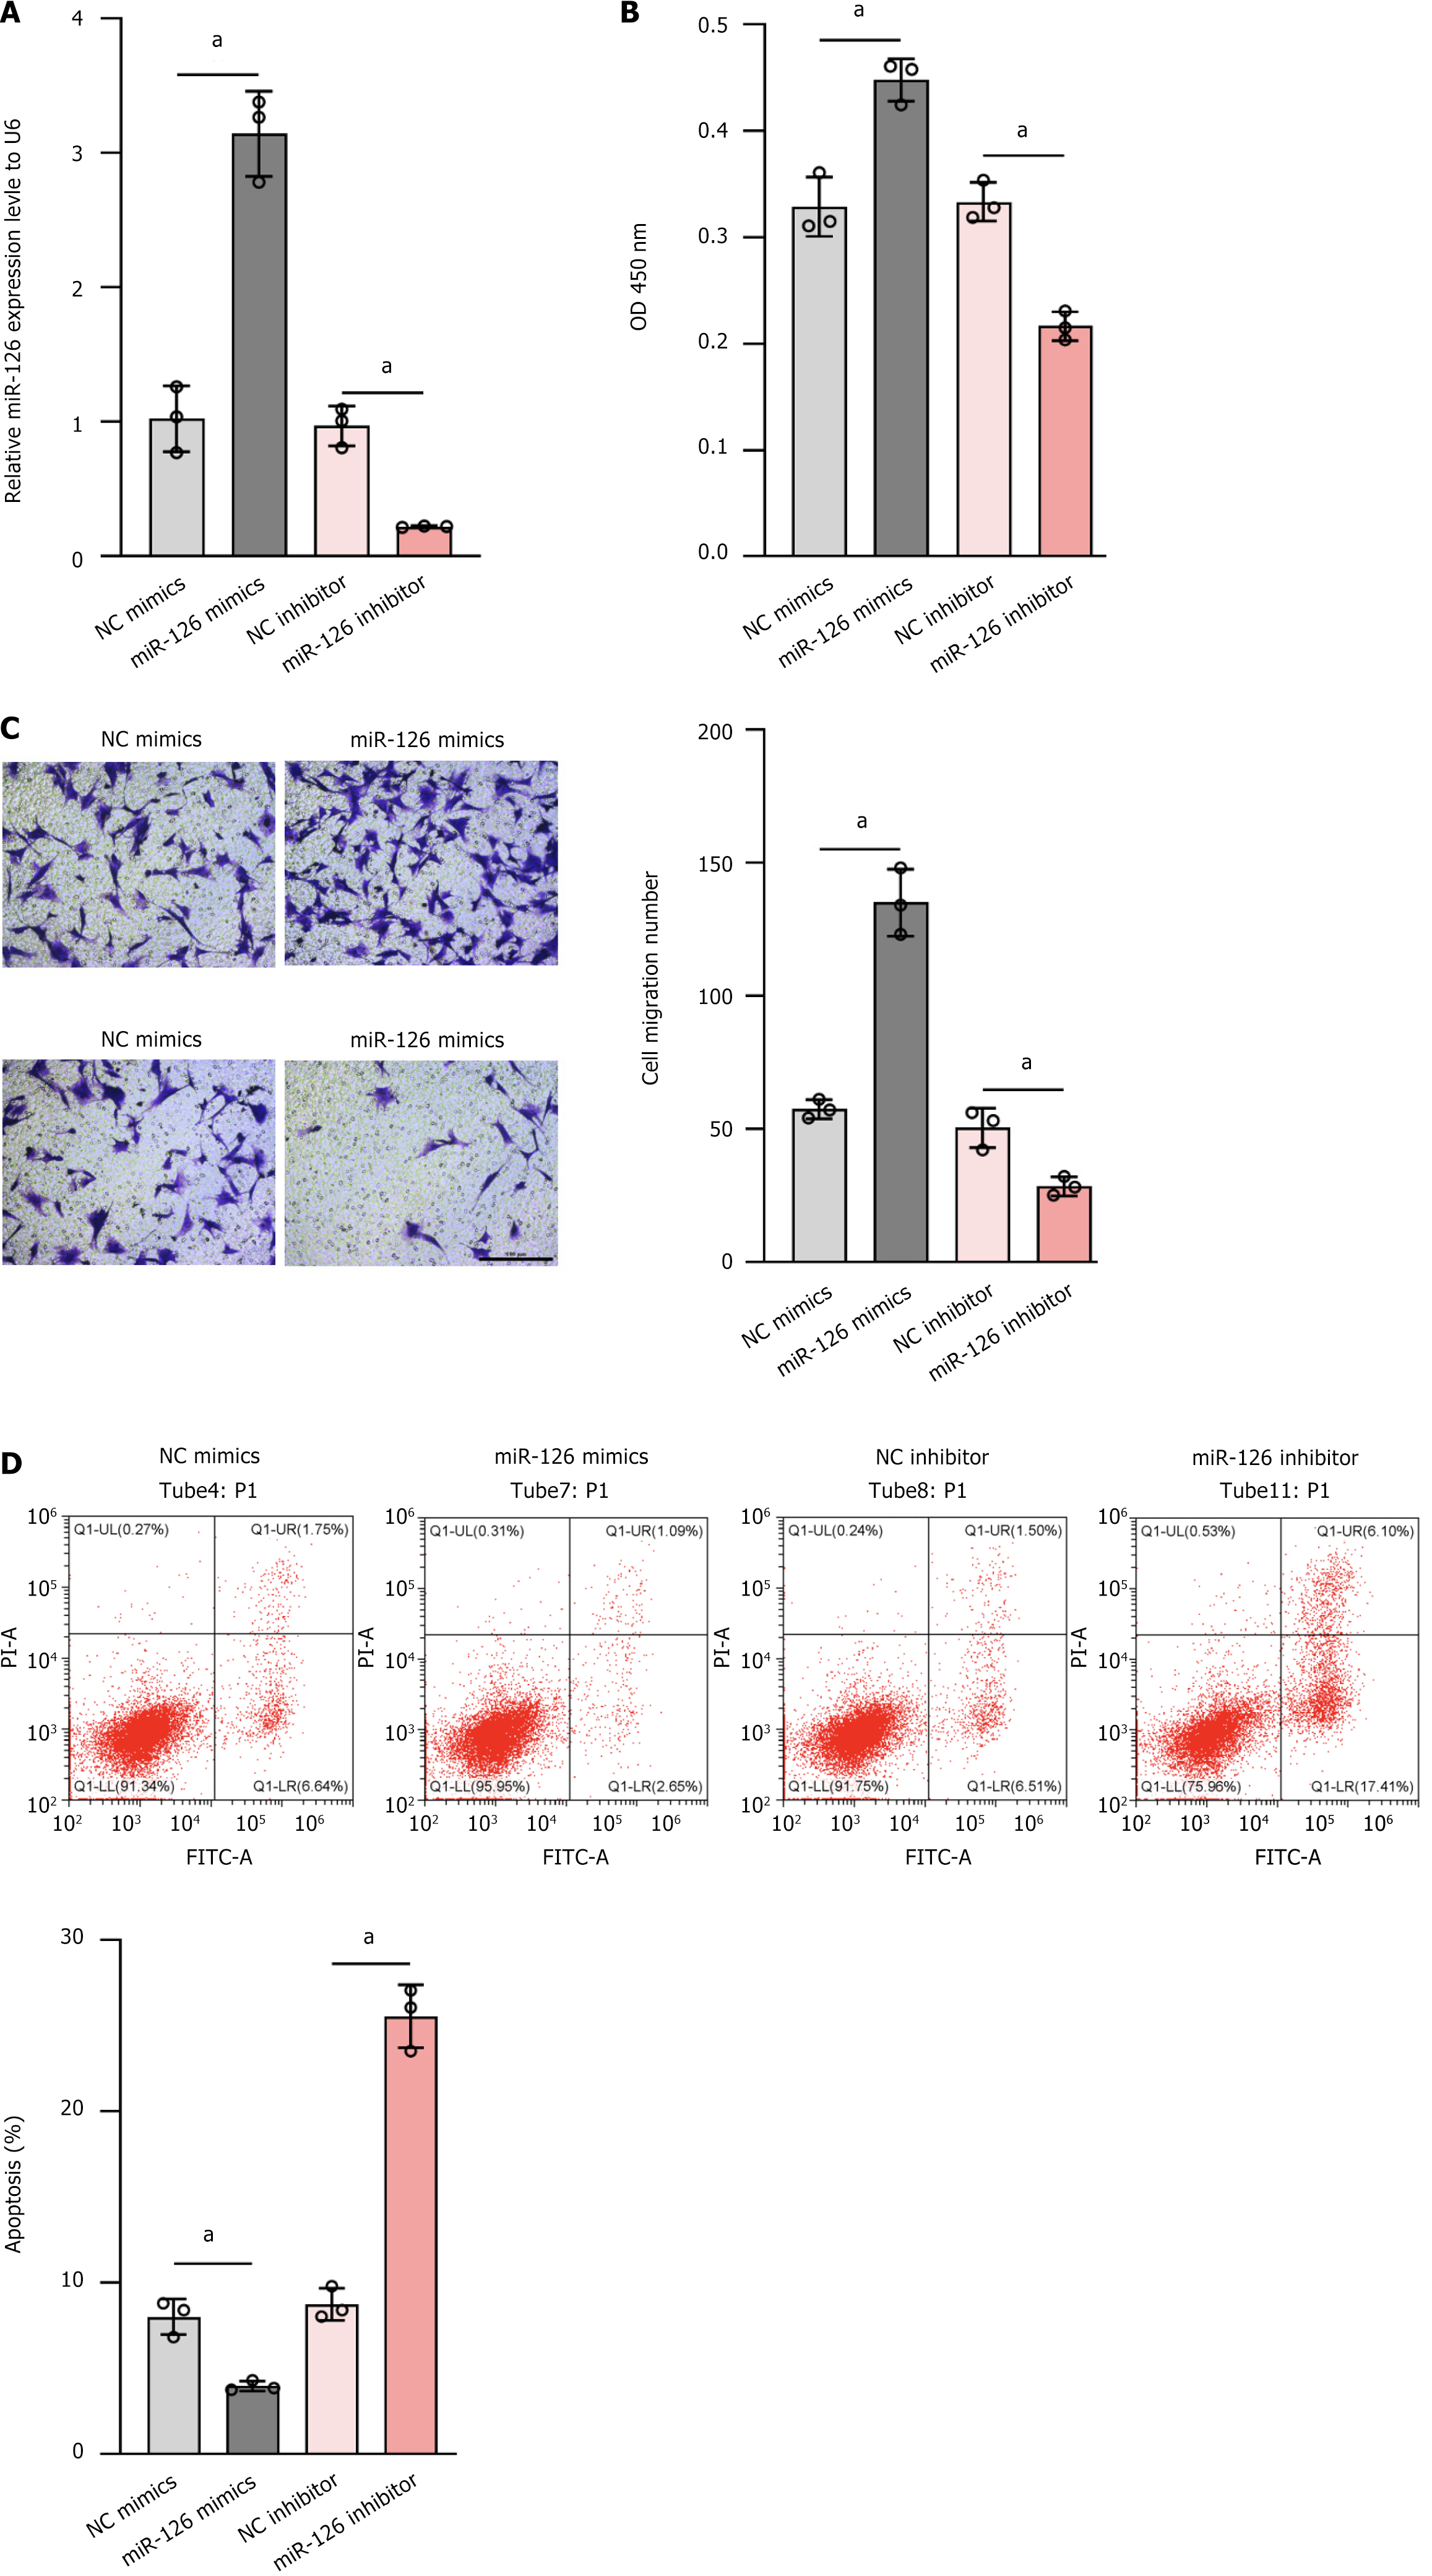
Figure 3 To assess the relative expression level of miR-126, cell proliferation, cell migration ability, and apoptosis.
A: Relative expression level of miR-126 was determined by quantitative polymerase chain reaction. MiR-126 mimics significantly increase miR-126 expression, while miR-126 inhibitor reduces it; B: Cell proliferation was assessed by measuring optical density at 450 nm. Compared with the control group (negative control mimics), the miR-126 mimics group showed enhanced cell proliferation (higher optical density value); C: Cell migration ability was assessed by wound healing assay. The number of migrated cells in the miR-126 mimics group was significantly higher than that in the negative control mimics group. The bar chart quantified the number of migrated cells, further supporting these observations; D: Cells were assessed by flow cytometry apoptosis. MiR-126 mimics reduced apoptosis, while miR-126 inhibitor significantly increased it. The bar chart quantified the apoptosis rate, further supporting these observations. Data are presented as the mean ± SD, and differences between groups were calculated using one-way ANOVA. aP < 0.01. OD: Optical density; NC: Negative control.
- Citation: Ye ZQ, Meng XH, Fang X, Liu HY, Mwindadi HH. MiR-126 regulates the effect of mesenchymal stem cell vascular repair on carotid atherosclerosis through MAPK/ERK signaling pathway. World J Stem Cells 2025; 17(6): 106520
- URL: https://www.wjgnet.com/1948-0210/full/v17/i6/106520.htm
- DOI: https://dx.doi.org/10.4252/wjsc.v17.i6.106520


