Copyright
©The Author(s) 2025.
World J Stem Cells. Jun 26, 2025; 17(6): 105491
Published online Jun 26, 2025. doi: 10.4252/wjsc.v17.i6.105491
Published online Jun 26, 2025. doi: 10.4252/wjsc.v17.i6.105491
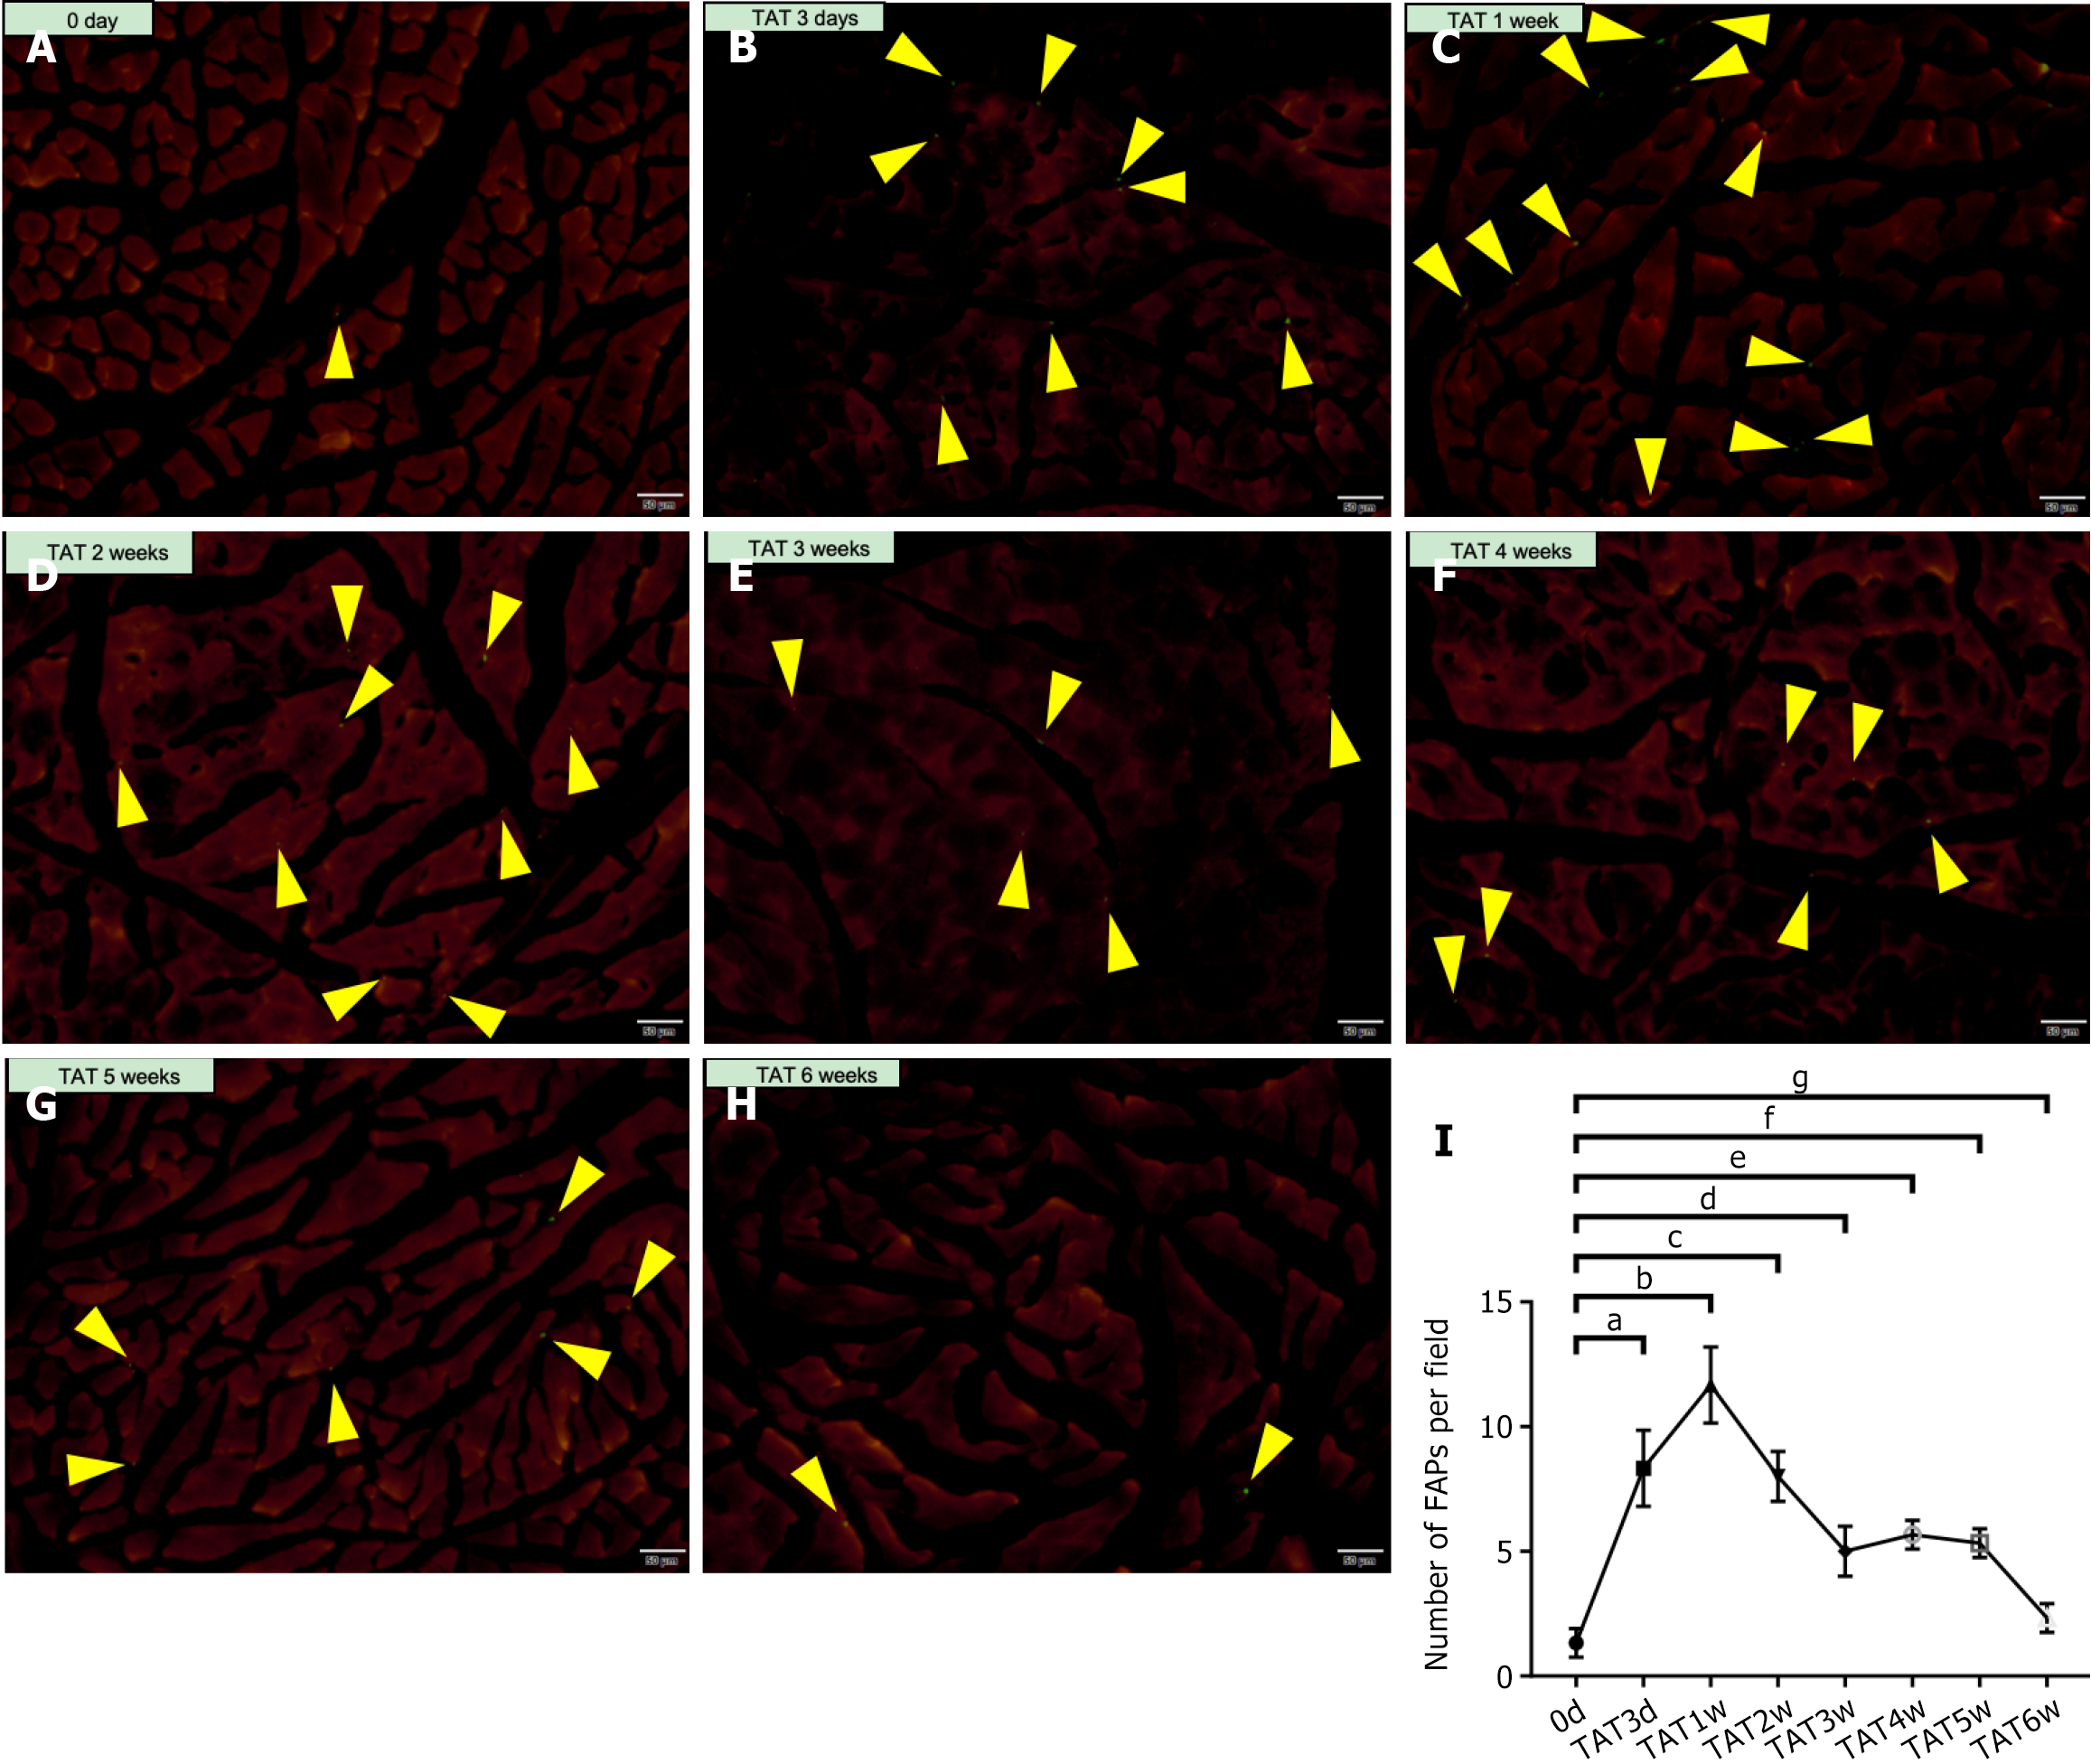
Figure 1 Change in fibro-adipogenic progenitors population after tendon rupture observed in fibro-adipogenic progenitor-tracing mice.
A-H: Images of frozen sections of tibialis anterior muscle at 0 day, 3 days, 1 week, 2 weeks, 3 weeks, 4 weeks, 5 weeks, and 6 weeks after tibialis anterior tenotomy in Pdgfra-H2B::eGFP mice, respectively; I: The statistical analysis of the number of EGFP+ cells per field counted under microscopy. aP < 0.001, 3 days compare to 0 day; bP < 0.001, 1 week compare to 0 day; cP < 0.001, 2 weeks compare to 0 day; dP < 0.01, 3 weeks compare to 0 day; eP < 0.01, 4 weeks compare to 0 day; fP < 0.01, 5 weeks compare to 0 day; gP > 0.05, 6 weeks compare to 0 day. Pdgfra+ cells were labeled with enhanced green fluorescence protein. Yellow arrowheads indicate EGFP+ cells (i.e., fibro-adipogenic progenitors). Scale bar = 50 μm. TAT: Tibialis anterior tenotomy; FAPs: Fibro-adipogenic progenitors.
- Citation: Ding ZC, He JJ, Shi LZ, Qian J, Mei SH, Kang X, Chen JW. Fibro-adipogenic progenitors prevent skeletal muscle degeneration at acute phase upon tendon rupture in a murine tibialis anterior tenotomy model. World J Stem Cells 2025; 17(6): 105491
- URL: https://www.wjgnet.com/1948-0210/full/v17/i6/105491.htm
- DOI: https://dx.doi.org/10.4252/wjsc.v17.i6.105491


