Copyright
©The Author(s) 2025.
World J Stem Cells. May 26, 2025; 17(5): 105394
Published online May 26, 2025. doi: 10.4252/wjsc.v17.i5.105394
Published online May 26, 2025. doi: 10.4252/wjsc.v17.i5.105394
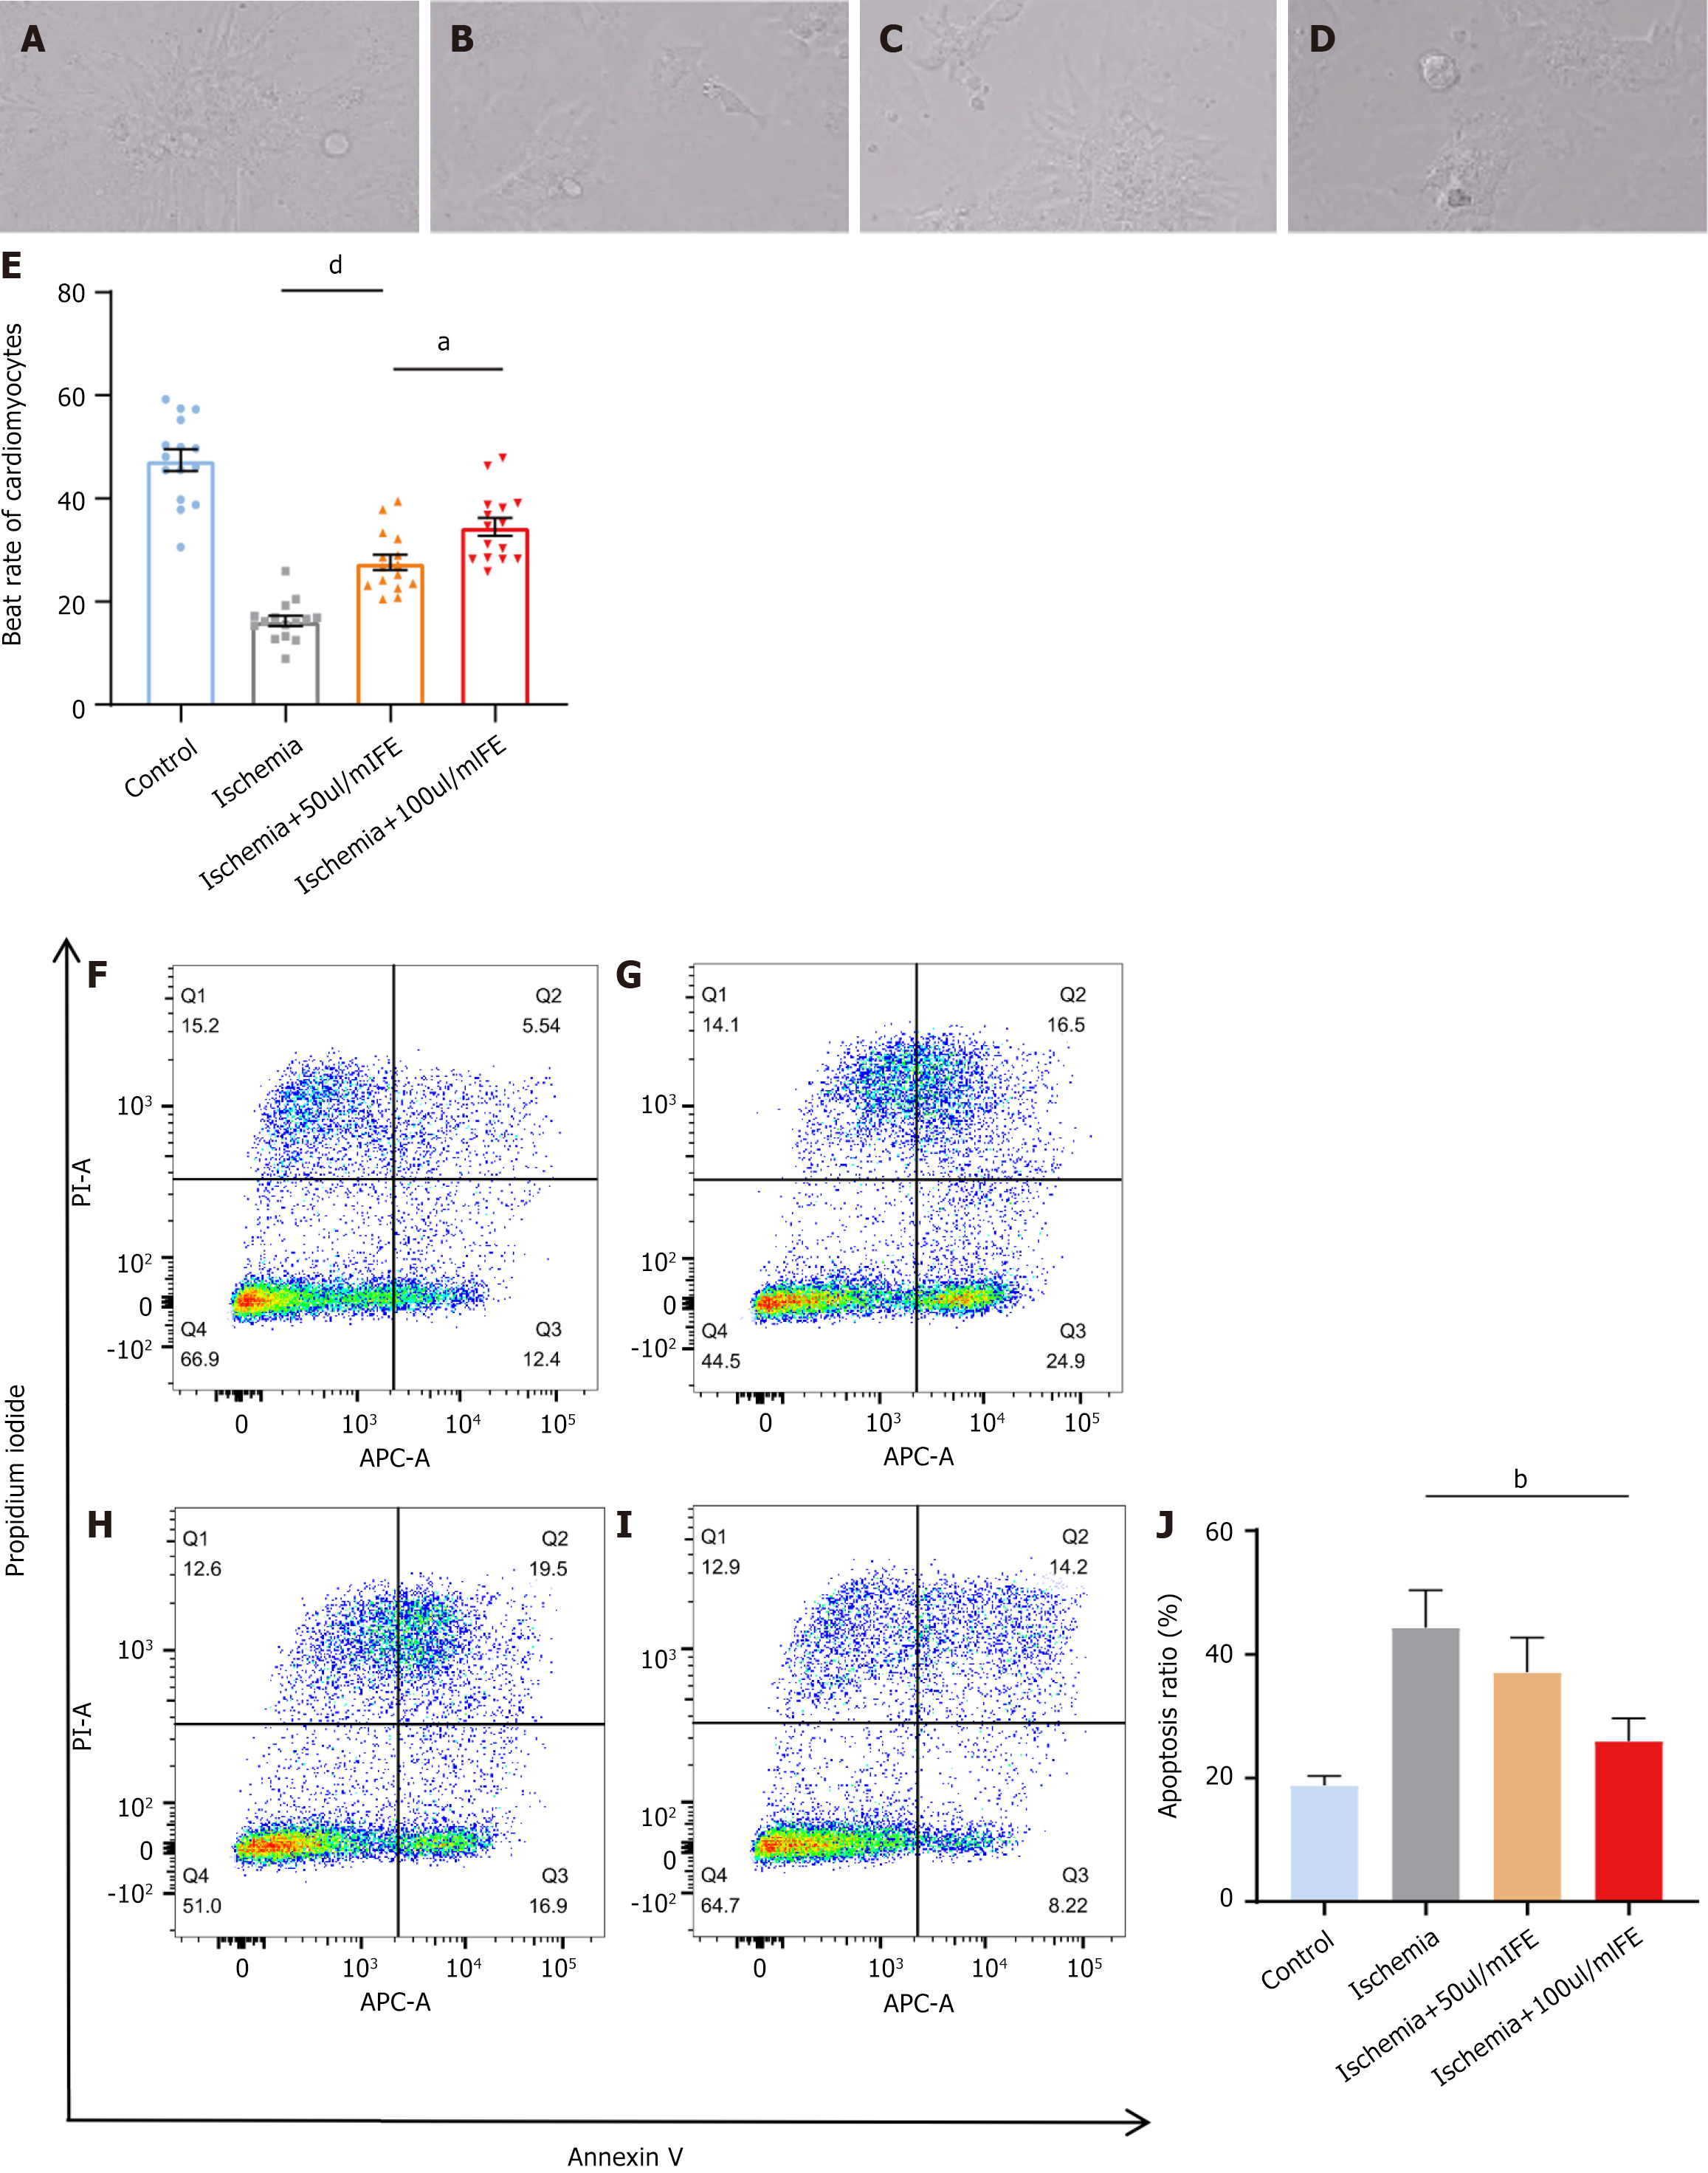
Figure 3 Cell viability of cardiomyocytes was higher and apoptosis level in cardiac myocytes was lower in the treatment than in the control group.
A-D: Beat rate of cardiomyocytes determined by live cell imaging (n = 15 cells per group); E: Quantification of beat rate of cardiomyocytes; F-I: The level of cell apoptosis were calculated using flow cytometry (n = 3); J: Quantification of cell apoptosis. Values indicate mean ± SEM from at least three independent experiments. aP < 0.05, bP < 0.01, dP < 0.0001. FE: Fat extract.
- Citation: Yang TY, Sun Y, Zhang WJ, Wang CQ, Zhou J. Cell-free extracts from human fat tissue attenuate ischemic injury in cardiomyocytes in a murine model. World J Stem Cells 2025; 17(5): 105394
- URL: https://www.wjgnet.com/1948-0210/full/v17/i5/105394.htm
- DOI: https://dx.doi.org/10.4252/wjsc.v17.i5.105394


