Copyright
©The Author(s) 2025.
World J Stem Cells. May 26, 2025; 17(5): 104116
Published online May 26, 2025. doi: 10.4252/wjsc.v17.i5.104116
Published online May 26, 2025. doi: 10.4252/wjsc.v17.i5.104116
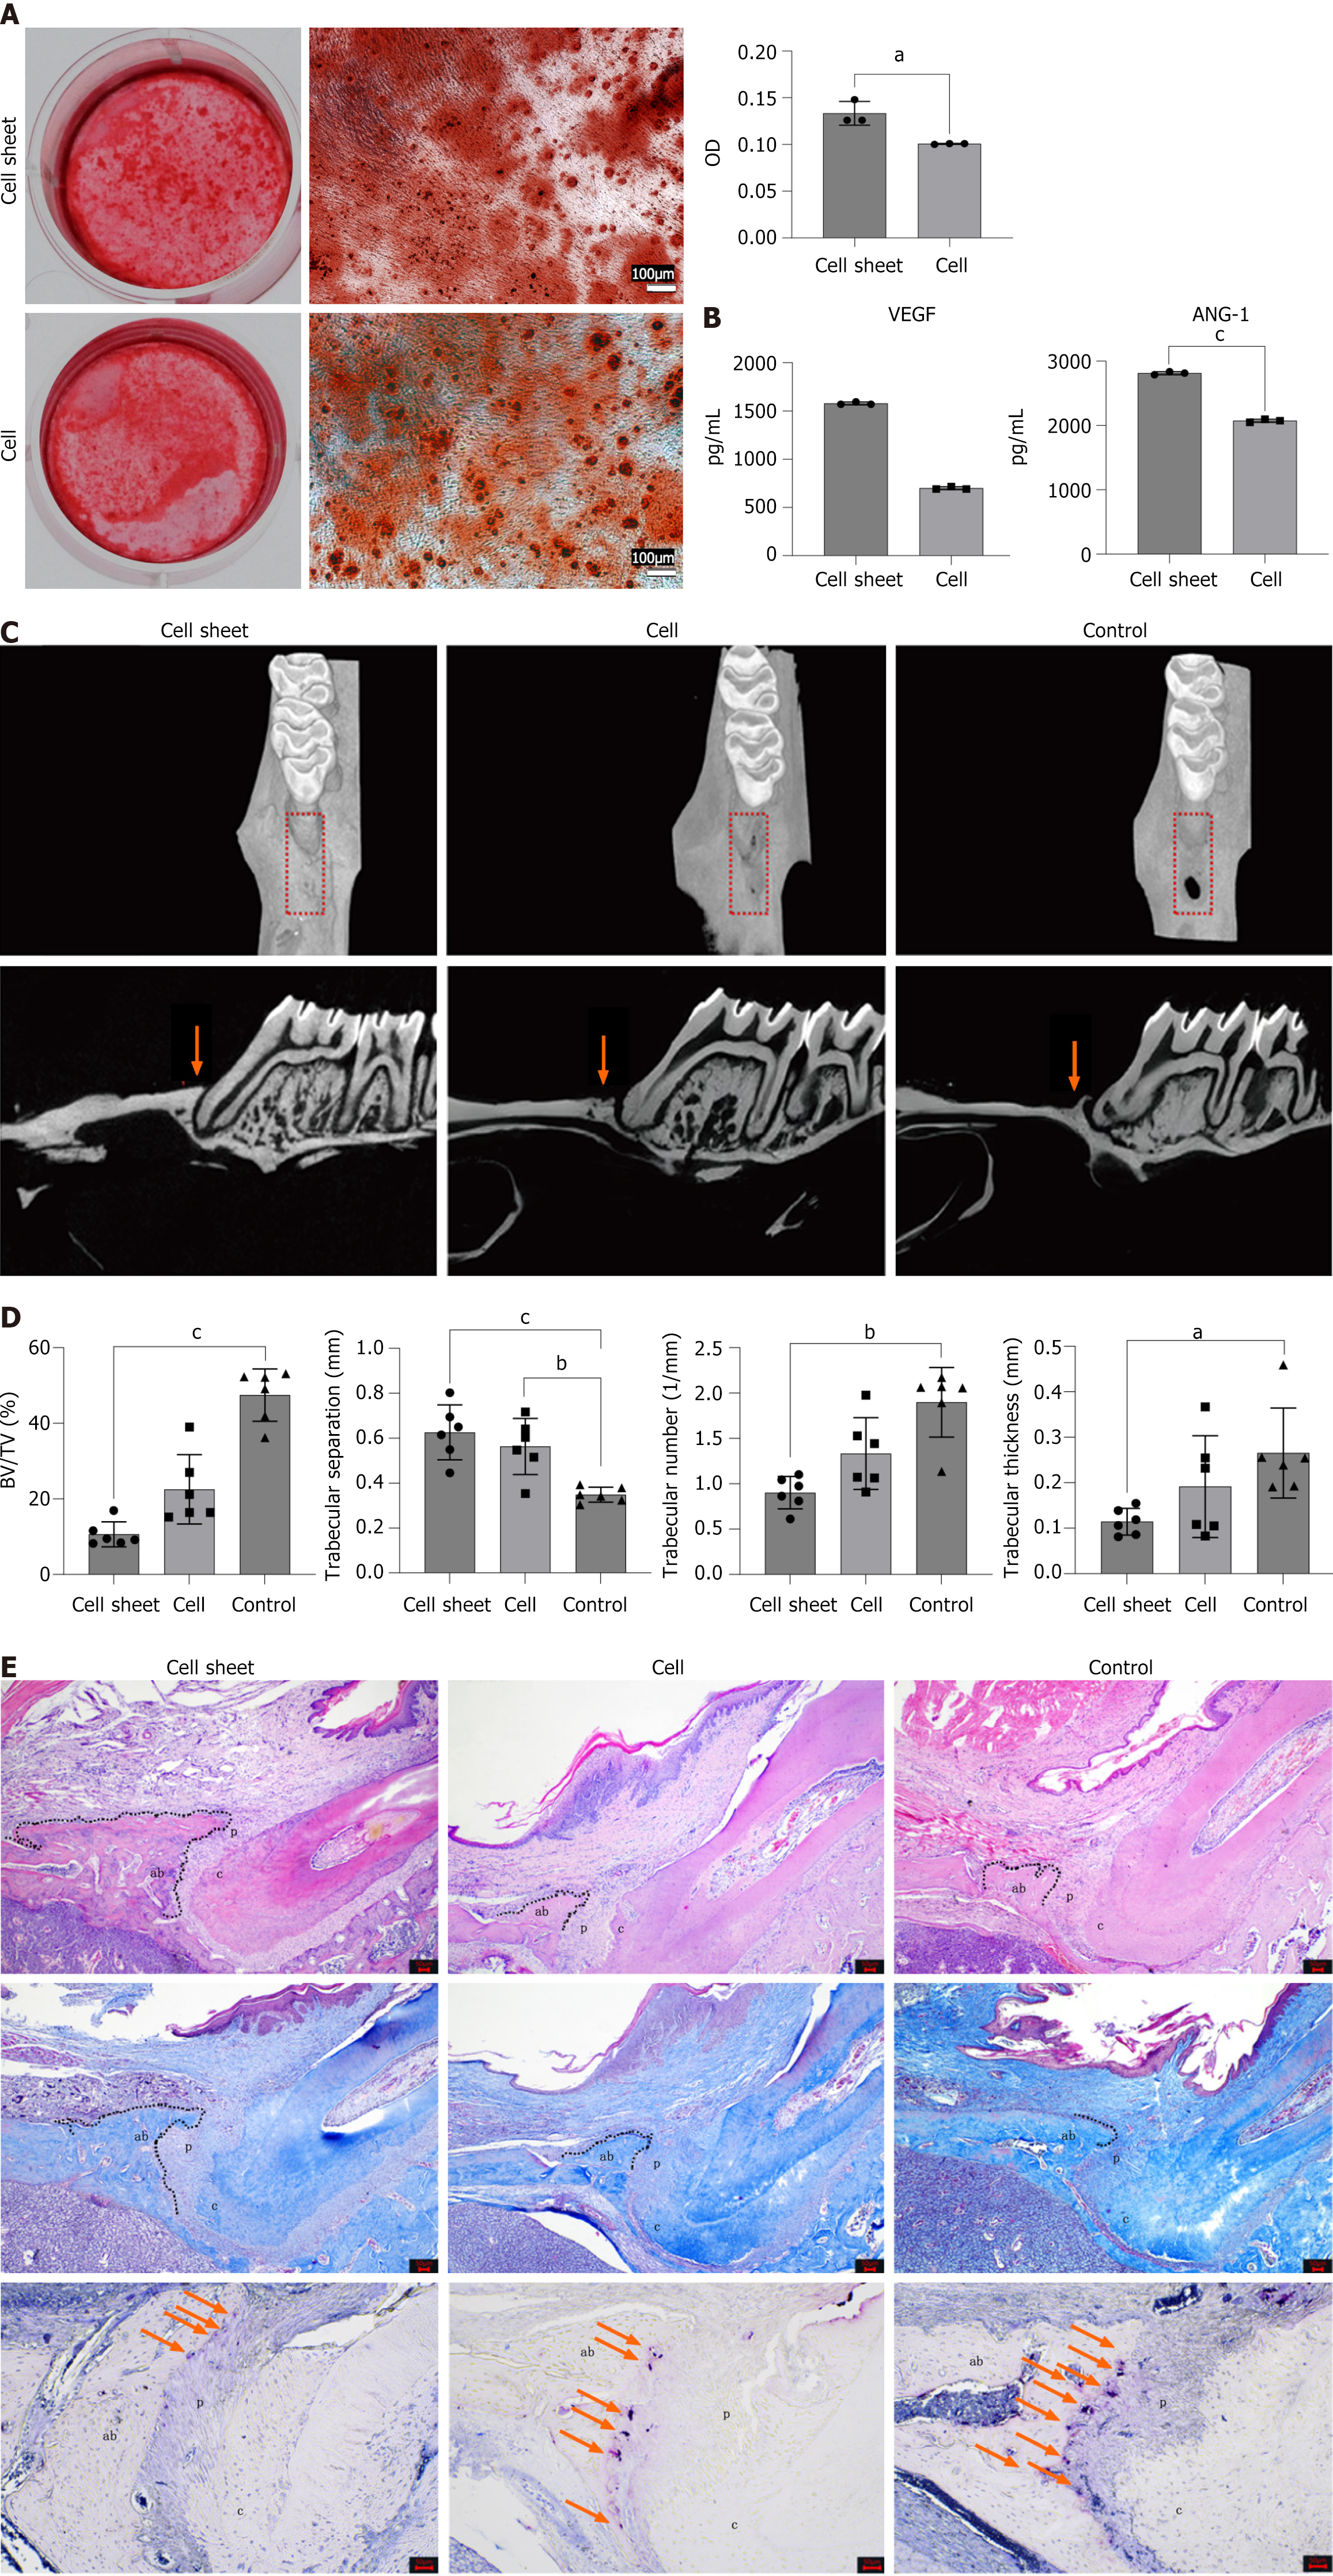
Figure 6 Comparison of cell sheet and cell suspension.
A: Alizarin red staining comparison between cell sheets and cell suspensions (n = 3). Scale bar = 100 μm; B: Enzyme linked immunosorbent assay results showing vascular endothelial growth factor and angiopoietin-1 concentrations secreted by cell sheets and cell suspensions (n = 3); C: Micro-computed tomography images of the defect area at four weeks, with the defect region outlined by a red dotted line (2 mm × 1 mm) (n = 6); D: Quantitative analysis of the defect area at four weeks (n = 6) including trabecular separation, bone volume/tissue volume ratio, trabecular thickness, and trabecular number values; E: Hematoxylin and eosin, tartrate-resistant acid phosphatase, and Masson staining for periodontal regeneration. Collagen fibers are stained blue in Masson’s stain. The orange arrow indicates tartrate-resistant acid phosphatase-stained osteoclasts, while the black dashed line marks the boundary of newly formed alveolar bone. Scale bar = 50 μm (Ab: Alveolar bone; c: Cementum; p: Periodontal membrane). Data are presented as mean ± SD, aP < 0.05; bP < 0.01; cP < 0.001. VEGF: Vascular endothelial growth factor; ANG-1: Angiopoietin-1; BV: Bone volume; TV: Tissue volume.
- Citation: Yu JL, Yang C, Liu L, Lin A, Guo SJ, Tian WD. Optimal good manufacturing practice-compliant production of dental follicle stem cell sheet and its application in Sprague-Dawley rat periodontitis. World J Stem Cells 2025; 17(5): 104116
- URL: https://www.wjgnet.com/1948-0210/full/v17/i5/104116.htm
- DOI: https://dx.doi.org/10.4252/wjsc.v17.i5.104116


