Copyright
©The Author(s) 2025.
World J Stem Cells. May 26, 2025; 17(5): 104116
Published online May 26, 2025. doi: 10.4252/wjsc.v17.i5.104116
Published online May 26, 2025. doi: 10.4252/wjsc.v17.i5.104116
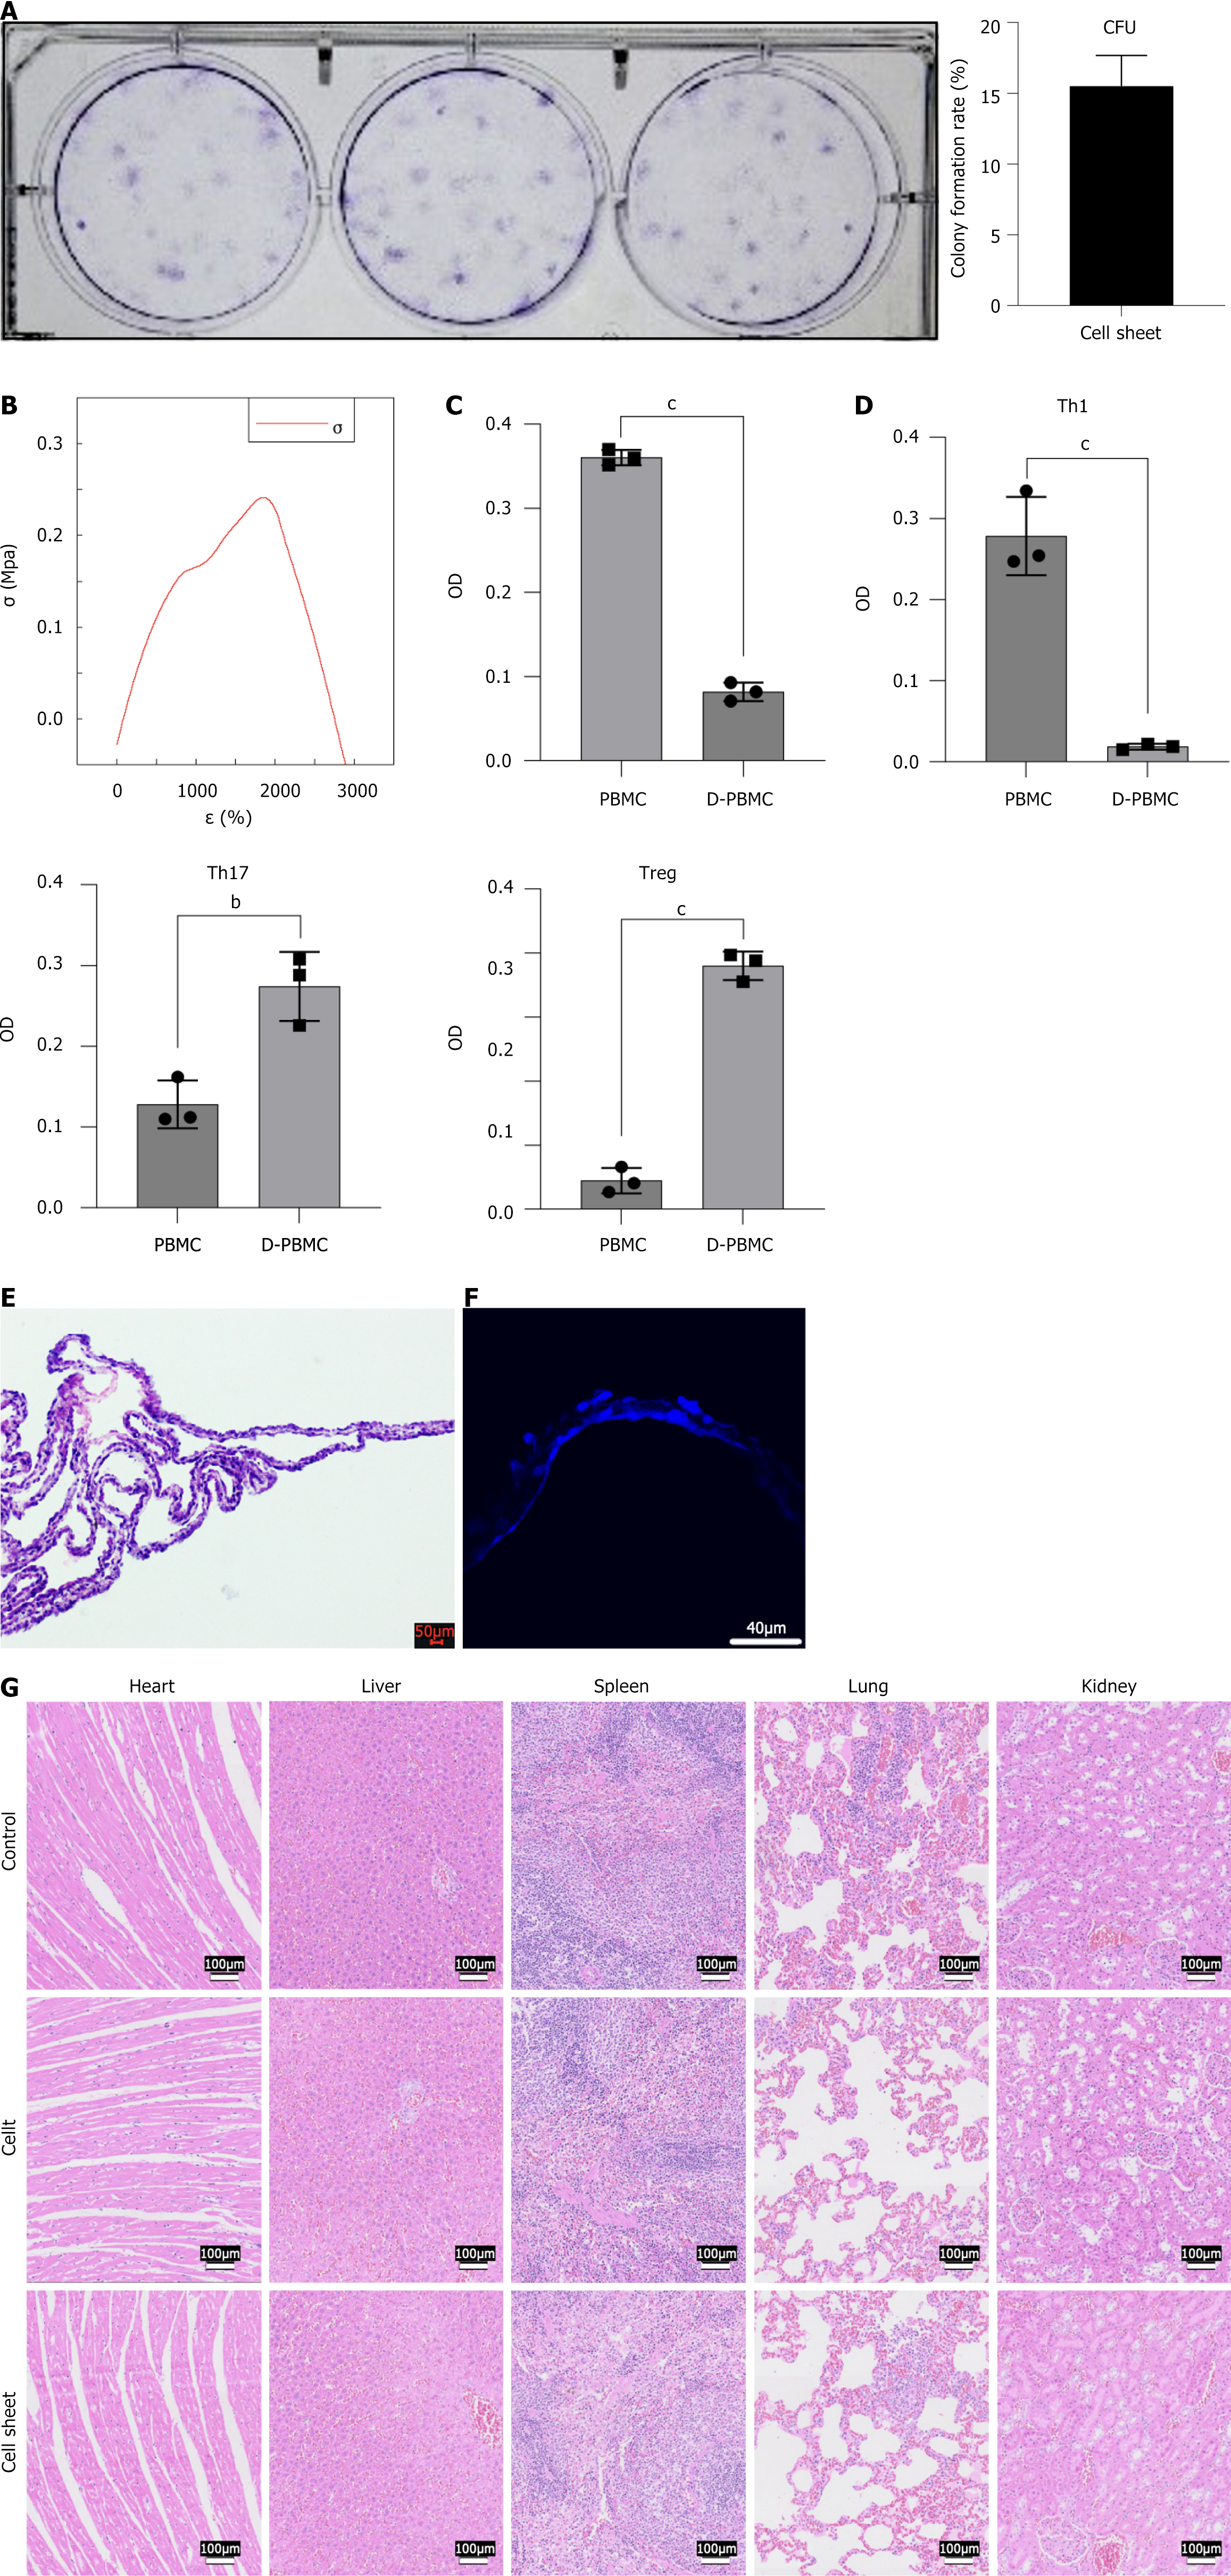
Figure 5 Physical and biological characteristics of standardized cultured cell sheet.
A: Macroscopic image of cell colony formation experiment and corresponding quantitative analysis; B: Stress-strain curve of cell sheet under tensile load; C: Lymphocyte proliferation inhibition test results; D: Flow cytometry analysis and quantitative data of the proportion of type 1 T helper, interleukin-17-producing T helper, and regulatory T cells; E: 4’,6-Diamidino-2-phenylindole staining of cell sheet. Scale bar = 40 μm; F: Hematoxylin and eosin staining of cell sheet. Scale bar = 50 μm; G: Hematoxylin and eosin staining of rat heart, liver, spleen, lung, and kidney sections after implantation with cell sheet, cell suspension, and phosphate-buffered saline. Scale bar = 100 μm. Data are presented as mean ± SD, n = 3. aP < 0.05; bP < 0.01; cP < 0.001. CFU: Colony formation unit; Th1: Type 1 T helper; Th17: Interleukin-17-producing T helper; Treg: Regulatory T cell.
- Citation: Yu JL, Yang C, Liu L, Lin A, Guo SJ, Tian WD. Optimal good manufacturing practice-compliant production of dental follicle stem cell sheet and its application in Sprague-Dawley rat periodontitis. World J Stem Cells 2025; 17(5): 104116
- URL: https://www.wjgnet.com/1948-0210/full/v17/i5/104116.htm
- DOI: https://dx.doi.org/10.4252/wjsc.v17.i5.104116


