Copyright
©The Author(s) 2025.
World J Stem Cells. May 26, 2025; 17(5): 104116
Published online May 26, 2025. doi: 10.4252/wjsc.v17.i5.104116
Published online May 26, 2025. doi: 10.4252/wjsc.v17.i5.104116
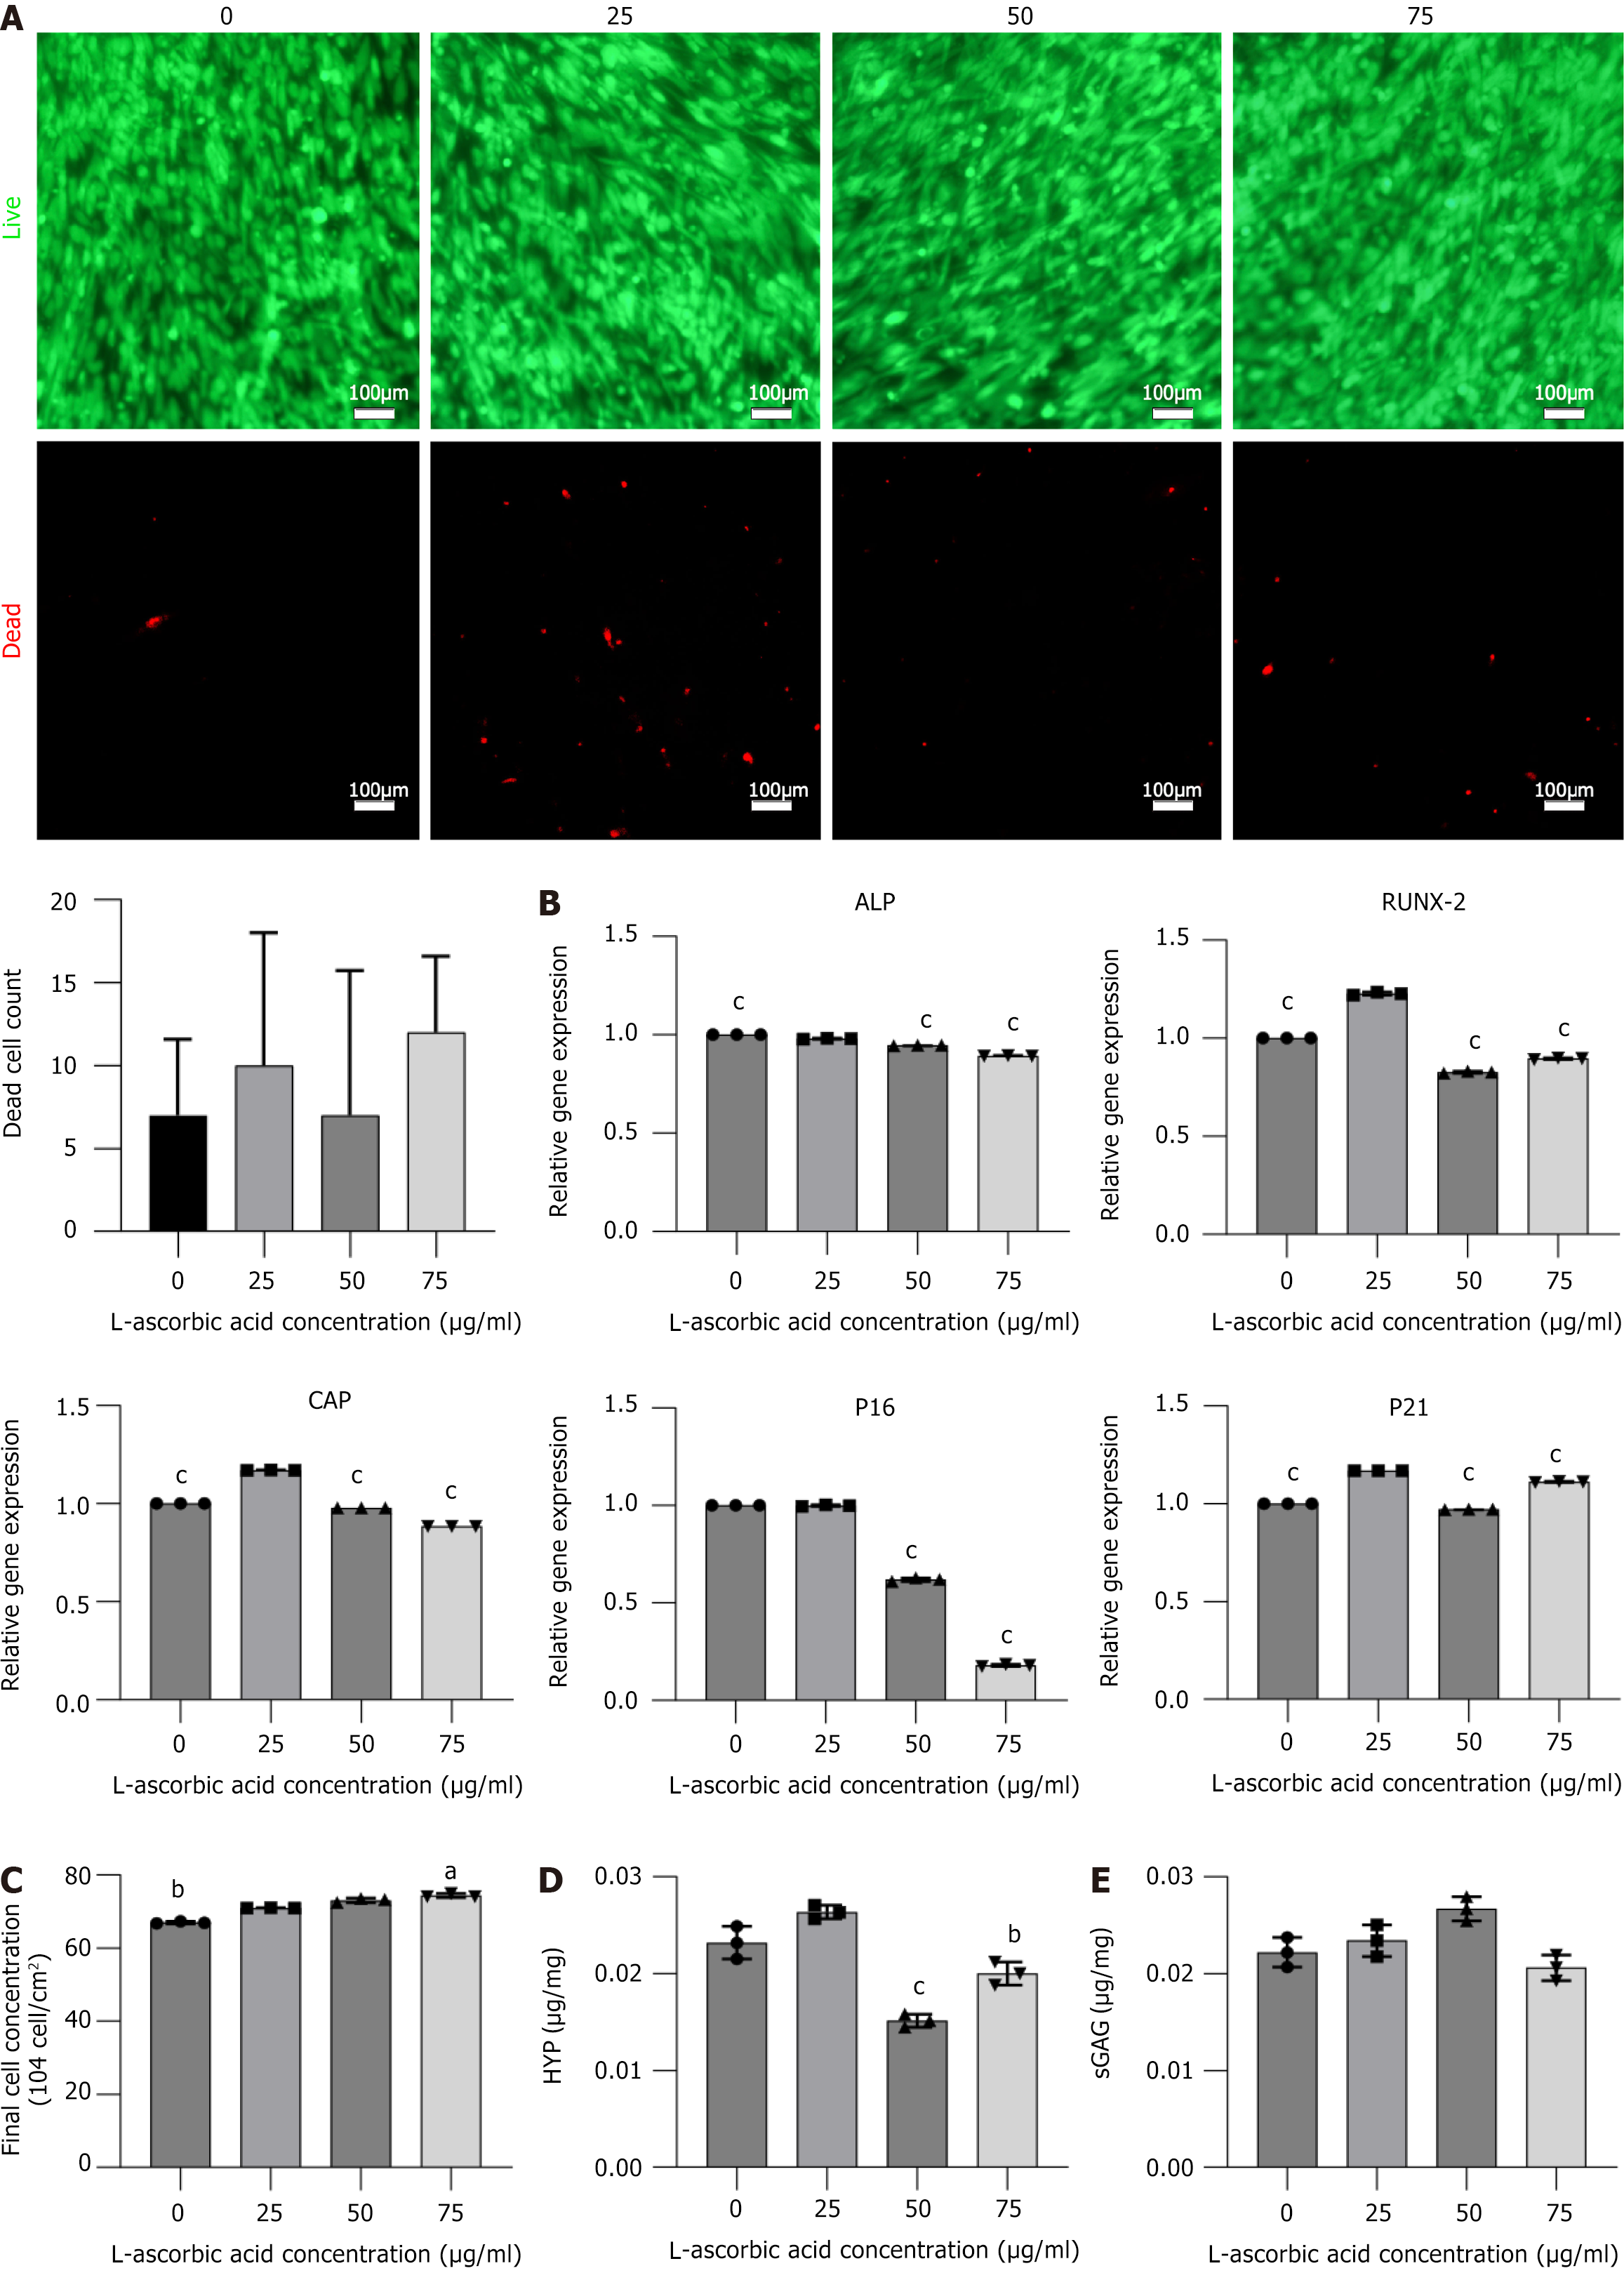
Figure 4 The effect of L-ascorbic acid concentration on the characteristics of cell sheet.
A: Acridine orange/propidium iodide staining and quantitative analysis of dead cells in the cell sheets at various L-ascorbic acid concentrations. Scale bar = 250 μm; B: Quantitative reverse-transcription polymerase chain reaction analysis of osteogenic and senescence-related genes in cell sheets cultured with various L-ascorbic acid concentrations; C: Final cell counts in the cell sheets at various L-ascorbic acid concentrations; D: Measurement of hydroxyproline content in the cell sheets at different L-ascorbic acid concentrations; E: Measurement of the sulfated glycosaminoglycan content in cell sheets with varying L-ascorbic acid concentrations. Data are presented as mean ± SD, n = 3. aP < 0.05; bP < 0.01; cP < 0.001. ALP: Alkaline phosphatase; RUNX-2: Runt-related transcription factor 2; CAP: Cartilage associated protein; HYP: Hydroxyproline; sGAG: Sulfated glycosaminoglycan.
- Citation: Yu JL, Yang C, Liu L, Lin A, Guo SJ, Tian WD. Optimal good manufacturing practice-compliant production of dental follicle stem cell sheet and its application in Sprague-Dawley rat periodontitis. World J Stem Cells 2025; 17(5): 104116
- URL: https://www.wjgnet.com/1948-0210/full/v17/i5/104116.htm
- DOI: https://dx.doi.org/10.4252/wjsc.v17.i5.104116


