
















©The Author(s) 2025.
World J Stem Cells. Dec 26, 2025; 17(12): 110894
Published online Dec 26, 2025. doi: 10.4252/wjsc.v17.i12.110894
Published online Dec 26, 2025. doi: 10.4252/wjsc.v17.i12.110894
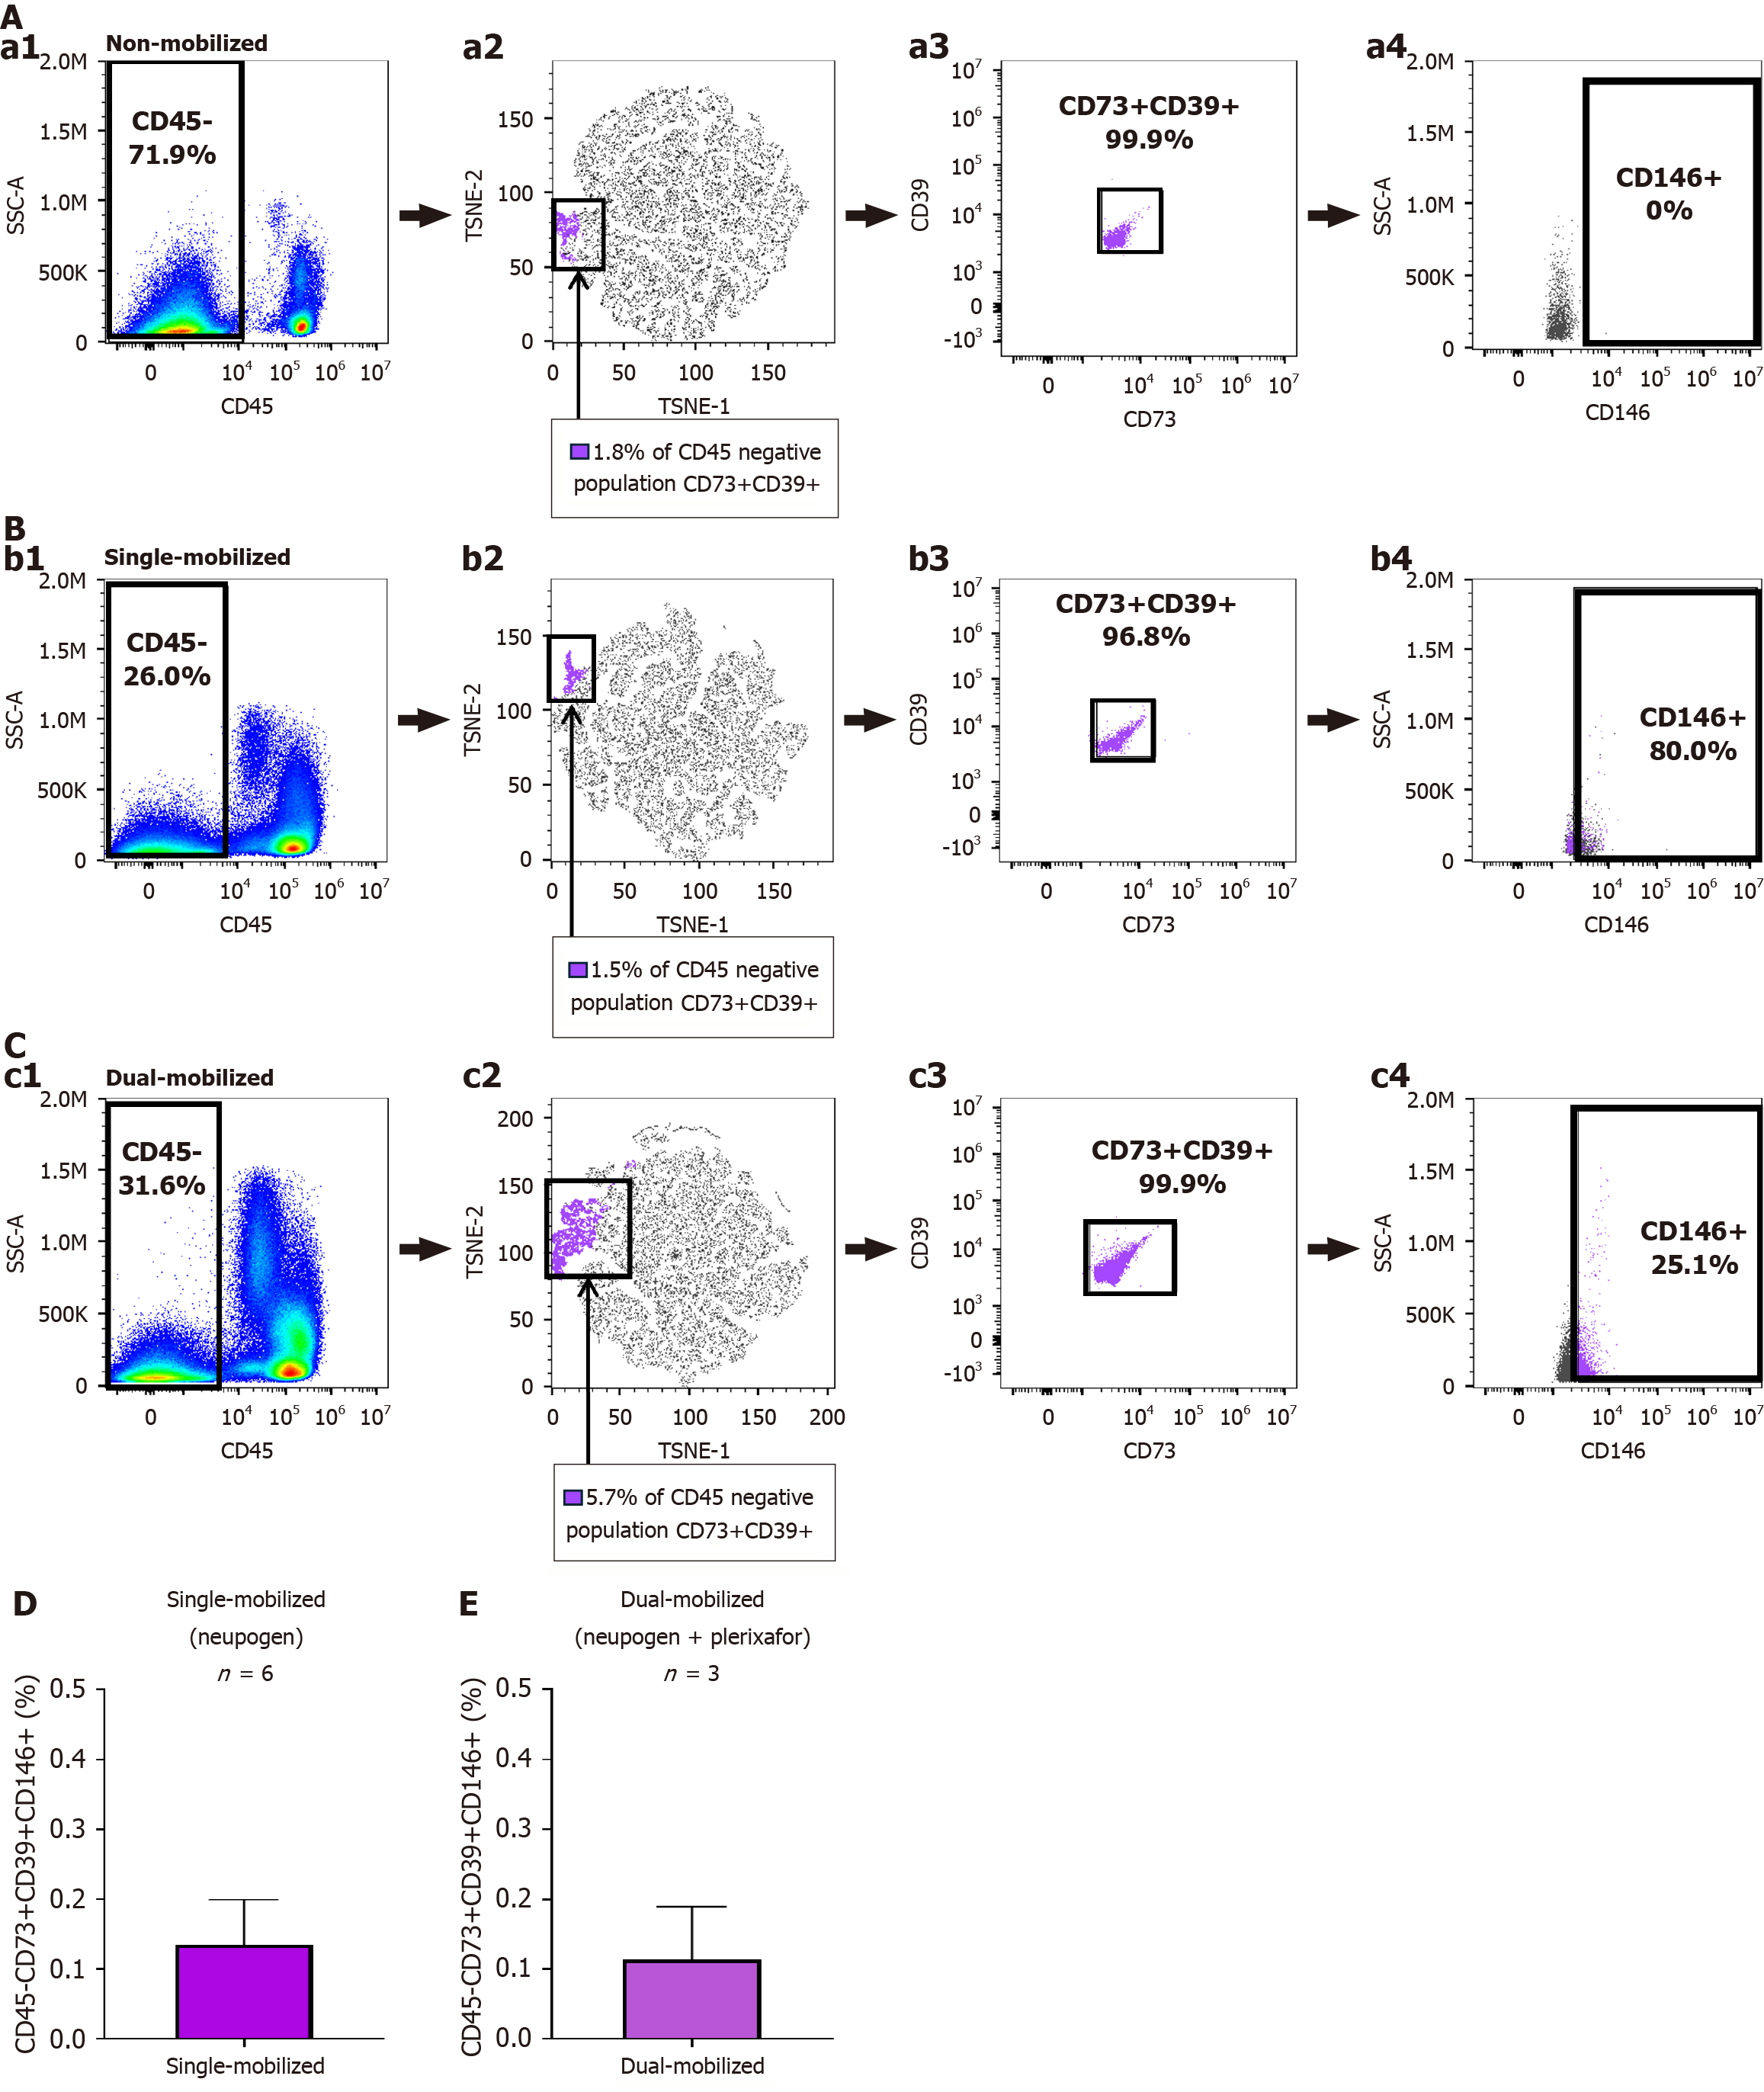
Figure 5 CD45-CD73+CD39+CD146+ subset expressed in mobilized peripheral blood.
A: Representative flow cytometry analysis showing target subset in mononuclear cells. Total CD45 negative fraction was gated (a1). t-Distribution Stochastic Neighbor Embedding (tSNE) plot in combination with flowSOM and cluster explorer was used. 1.8% of CD45- cells expressed CD73 and CD39 (a2). Only cells from the CD45- fraction presented in the t-SNE plot were gated[14], showing co-expression of CD73 and CD39 at 99.9% (a3). CD45-CD73+CD39+CD146+ population was not expressed in non-mobilized leukopaks (mononuclear cells) (a4); B: Representative flow cytometry analysis showing subset in single mobilized peripheral blood stem cells (PBSCs). CD45- fraction of total population was gated (b1). tSNE plot in combination with flowSOM and cluster explorer was used. 1.5% of CD45- cells expressed CD73 and CD39 (b2)[14]. Only cells from the CD45- fraction presented in the tSNE plot were gated, showing co-expression of CD73 and CD39 at 96.8% (b3)[14]. From CD45-CD73+CD39+ cells, approximately 80% are positive for CD146+ (b4); C: Representative flow cytometry analysis of target subset in single mobilized PBSCs. CD45 negative fraction of total population was gated (c1). tSNE plot in combination with flowSOM and cluster explorer was used. 5.7% of CD45- cells expressed CD73 and CD39 (c2)[14]. Only cells from cluster of CD45- fraction presented in the tSNE plot were gated and showed co-expression of CD73 and CD39 at 99.8% (c3)[14]. Among the CD45-CD73+CD39+ cells, 25.1% were positive for CD146+ (c4). All gates were established using Fluorescence MinusOne and unstained controls (A-C); D: Percent of CD45-CD73+CD39+CD146+ in single-mobilized PBSCs (< 1%). Bar graph is a result of mean ± SD (n = 6); E: Percent of CD45-CD73+CD39+CD146+ in dual-mobilized PBSCs (< 1%). Bar graph is a result of mean ± SD (n = 3).
- Citation: Martin K, Gullo F. Isolation and characterization of CD73+CD39+CD146+ mesenchymal stem cell subset from bone marrow. World J Stem Cells 2025; 17(12): 110894
- URL: https://www.wjgnet.com/1948-0210/full/v17/i12/110894.htm
- DOI: https://dx.doi.org/10.4252/wjsc.v17.i12.110894