Copyright
©The Author(s) 2024.
World J Stem Cells. Apr 26, 2024; 16(4): 434-443
Published online Apr 26, 2024. doi: 10.4252/wjsc.v16.i4.434
Published online Apr 26, 2024. doi: 10.4252/wjsc.v16.i4.434
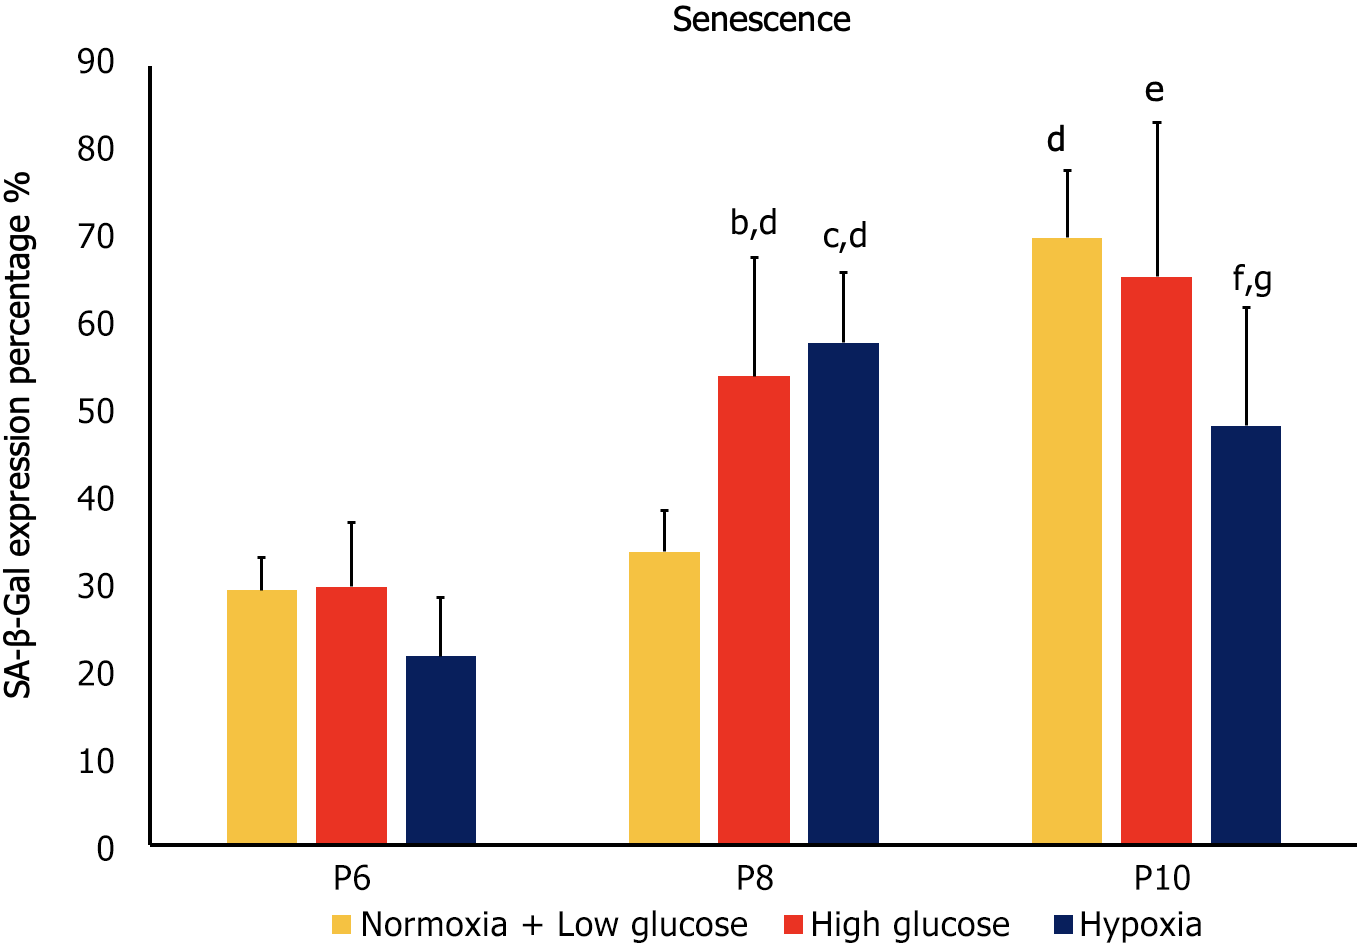
Figure 3 Senescence of human adipose-tissue derived mesenchymal stem cells at passages 6, 8 and 10 under conditions of normoxia + low glucose (control), high glucose and hypoxia, as indicated by X-gal expression percentage.
At passages 6 (P6), no significant differences in senescence were detected between the cells cultured in stress conditions and control cells. At P8, mesenchymal stem cells (MSCs) exposed to both hypoxia and high glucose exhibited significantly higher senescence compared to control at the same passage, as well as to their counterparts at P6. At P10 control MSCs and MSCs cultured in high glucose showed significantly higher senescence compared to their counterparts at the previous passage, while MSCs cultured under hypoxia had significantly less senescence than control MSCs at P10 and compared to the cells cultured at the same condition at P8. bP < 0.05 vs passages 6 (P6) high glucose; cP < 0.05 vs P6 hypoxia; dP < 0.05 vs P8 normoxia + low glucose; eP < 0.05 compared to P8 high glucose; fP < 0.05 compared to P8 hypoxia; gP < 0.05 compared to P10 normoxia + low glucose. P6: Passage 6; P8: Passage 8; P10: Passage 10; SA-β-gal: Senescence-associated beta-galactosidase.
- Citation: Almahasneh F, Abu-El-Rub E, Khasawneh RR, Almazari R. Effects of high glucose and severe hypoxia on the biological behavior of mesenchymal stem cells at various passages. World J Stem Cells 2024; 16(4): 434-443
- URL: https://www.wjgnet.com/1948-0210/full/v16/i4/434.htm
- DOI: https://dx.doi.org/10.4252/wjsc.v16.i4.434


