Copyright
©The Author(s) 2022.
World J Stem Cells. Jun 26, 2022; 14(6): 420-428
Published online Jun 26, 2022. doi: 10.4252/wjsc.v14.i6.420
Published online Jun 26, 2022. doi: 10.4252/wjsc.v14.i6.420
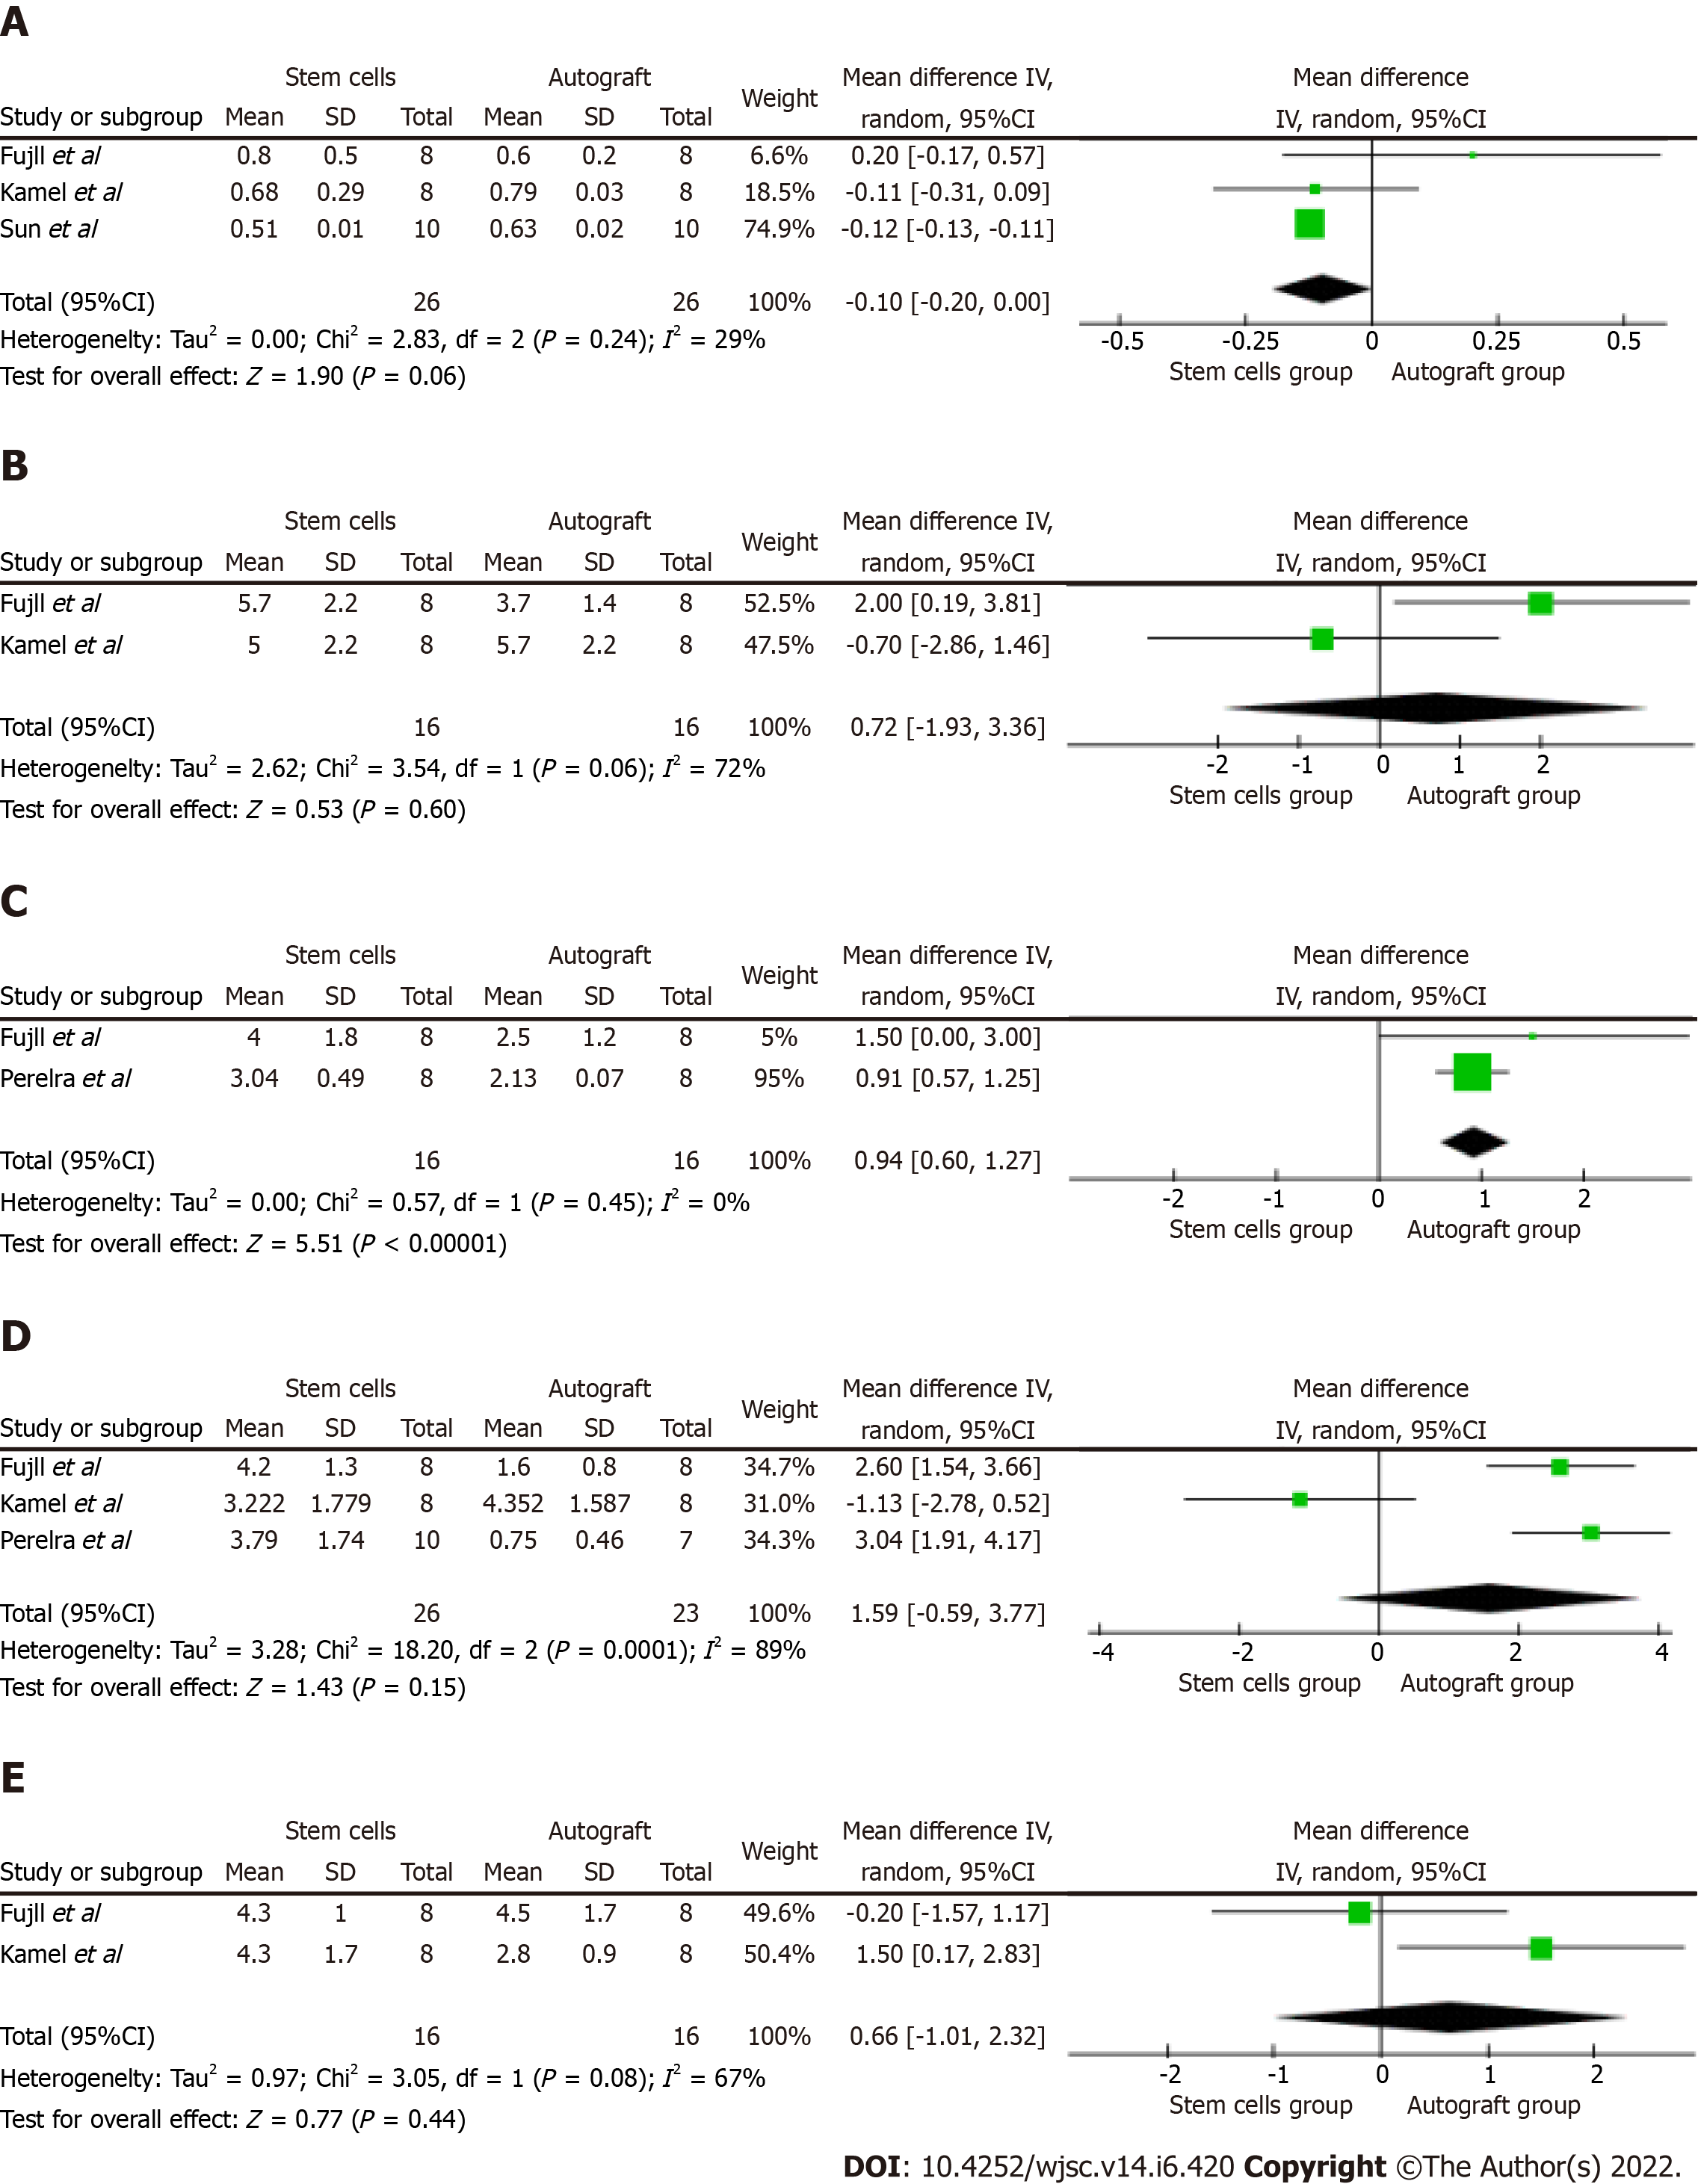
Figure 2 Foster plots from the present meta-analysis.
A: Myelin thickness; B: Nerve fibers diameter; C: Axonal diameter; D: Compound muscle action potential (CMAP) amplitude; E: CMAP latency. The Foster plots were generated using RevMan5.3 software. Influence of each included study in the pooled analysis is based on its weight, as specified in the dedicated column. The random effect model was used for data pooling. Heterogeneity is expressed as the I2, and it is considered as low (< 25%), medium (< 50%), high (< 75%), or very high (> 75%), for a proper data interpretation.
- Citation: Ricciardi L, Pucci R, Piazza A, Lofrese G, Scerrati A, Montemurro N, Raco A, Miscusi M, Ius T, Zeppieri M. Role of stem cells-based in facial nerve reanimation: A meta-analysis of histological and neurophysiological outcomes. World J Stem Cells 2022; 14(6): 420-428
- URL: https://www.wjgnet.com/1948-0210/full/v14/i6/420.htm
- DOI: https://dx.doi.org/10.4252/wjsc.v14.i6.420


