Copyright
©The Author(s) 2021.
World J Stem Cells. Jun 26, 2021; 13(6): 645-658
Published online Jun 26, 2021. doi: 10.4252/wjsc.v13.i6.645
Published online Jun 26, 2021. doi: 10.4252/wjsc.v13.i6.645
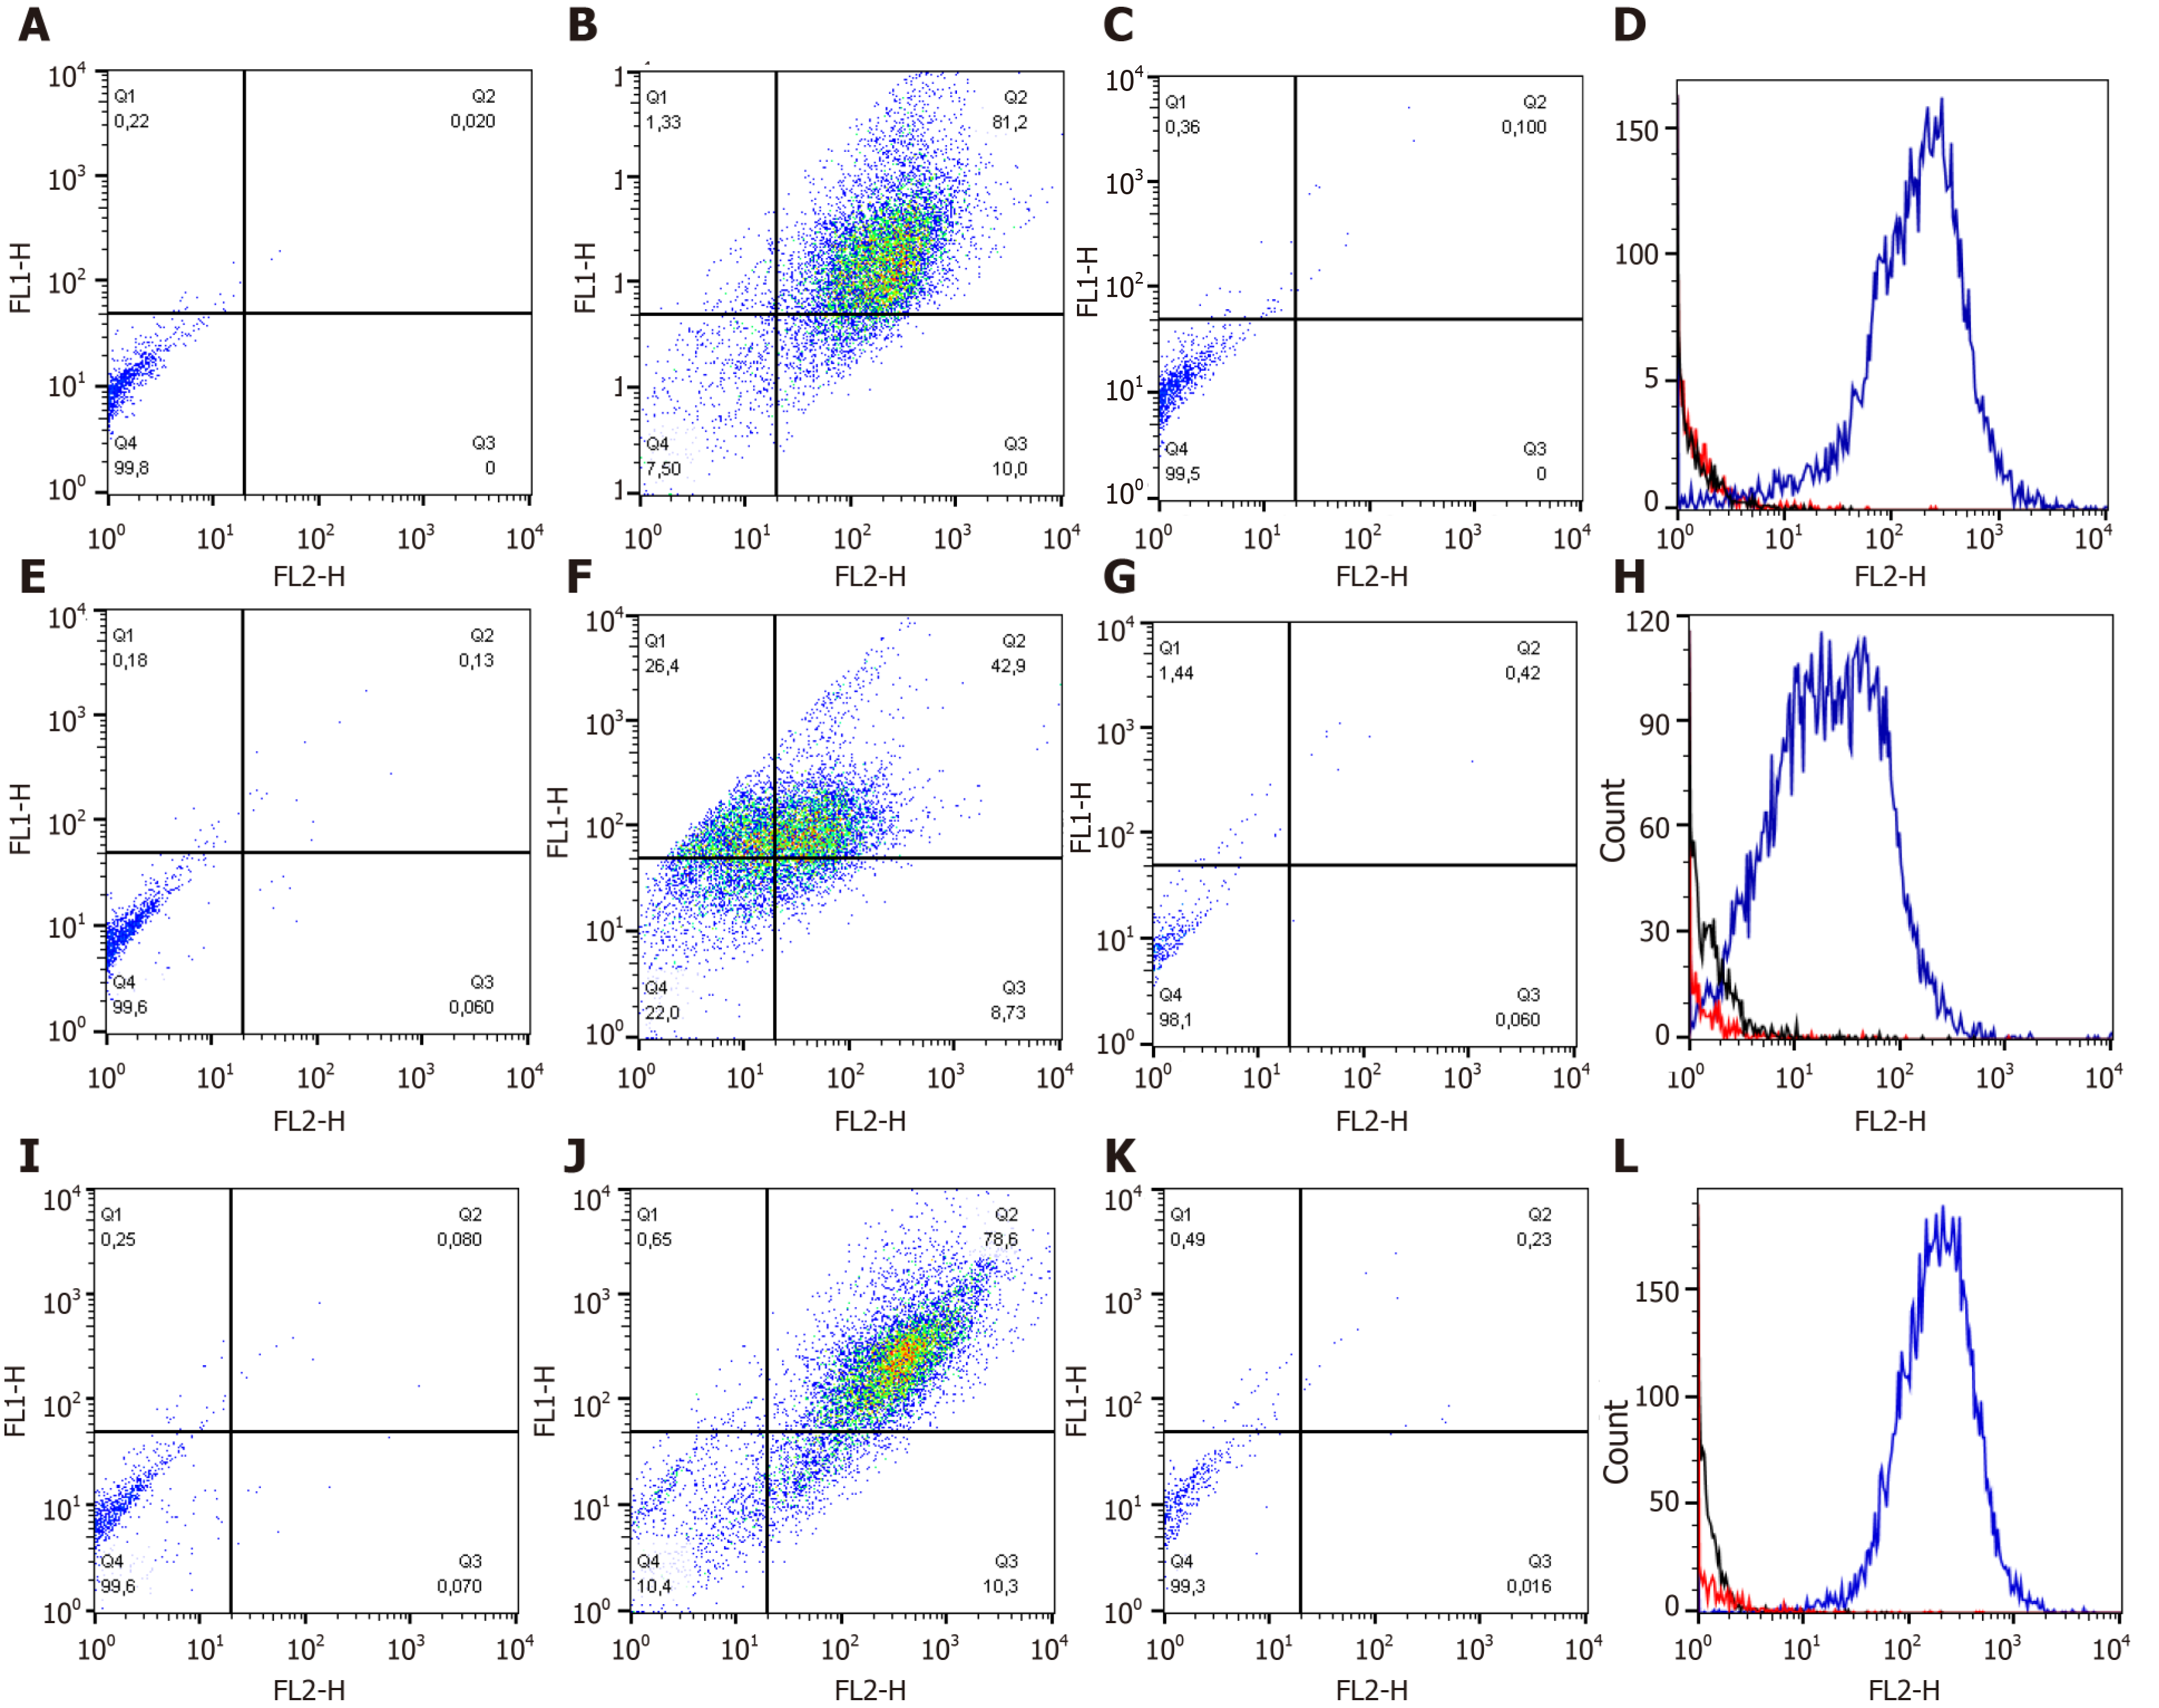
Figure 1 Flow cytometric analysis of the expression of cell surface markers CD90, CD44 and CD34 by mesenchymal stem cells.
Representative dot plots and histograms of three sources: Synovial fluid (SF), bone marrow (BM) and adipose tissue (AT). SF, BM and AT. A: SF control; B: SF CD90+CD44+; C: SF CD34+; D: SF histograms control (black line), CD34+ (red line) and CD90+CD44+ (blue line); E: BM control; F: BM CD90+CD44+; G: BM CD34+; H: BM histograms control (black line), CD34+ (red line) and CD90+CD44+ (blue line); I: AT control; J: AT CD90+CD44+; K: AT CD34+; L: AT histograms control (black line), CD34+ (red line) and CD90+CD44+ (blue line).
- Citation: Fülber J, Agreste FR, Seidel SRT, Sotelo EDP, Barbosa ÂP, Michelacci YM, Baccarin RYA. Chondrogenic potential of mesenchymal stem cells from horses using a magnetic 3D cell culture system. World J Stem Cells 2021; 13(6): 645-658
- URL: https://www.wjgnet.com/1948-0210/full/v13/i6/645.htm
- DOI: https://dx.doi.org/10.4252/wjsc.v13.i6.645


