Copyright
©The Author(s) 2022.
World J Stem Cells. Dec 26, 2022; 14(12): 839-850
Published online Dec 26, 2022. doi: 10.4252/wjsc.v14.i12.839
Published online Dec 26, 2022. doi: 10.4252/wjsc.v14.i12.839
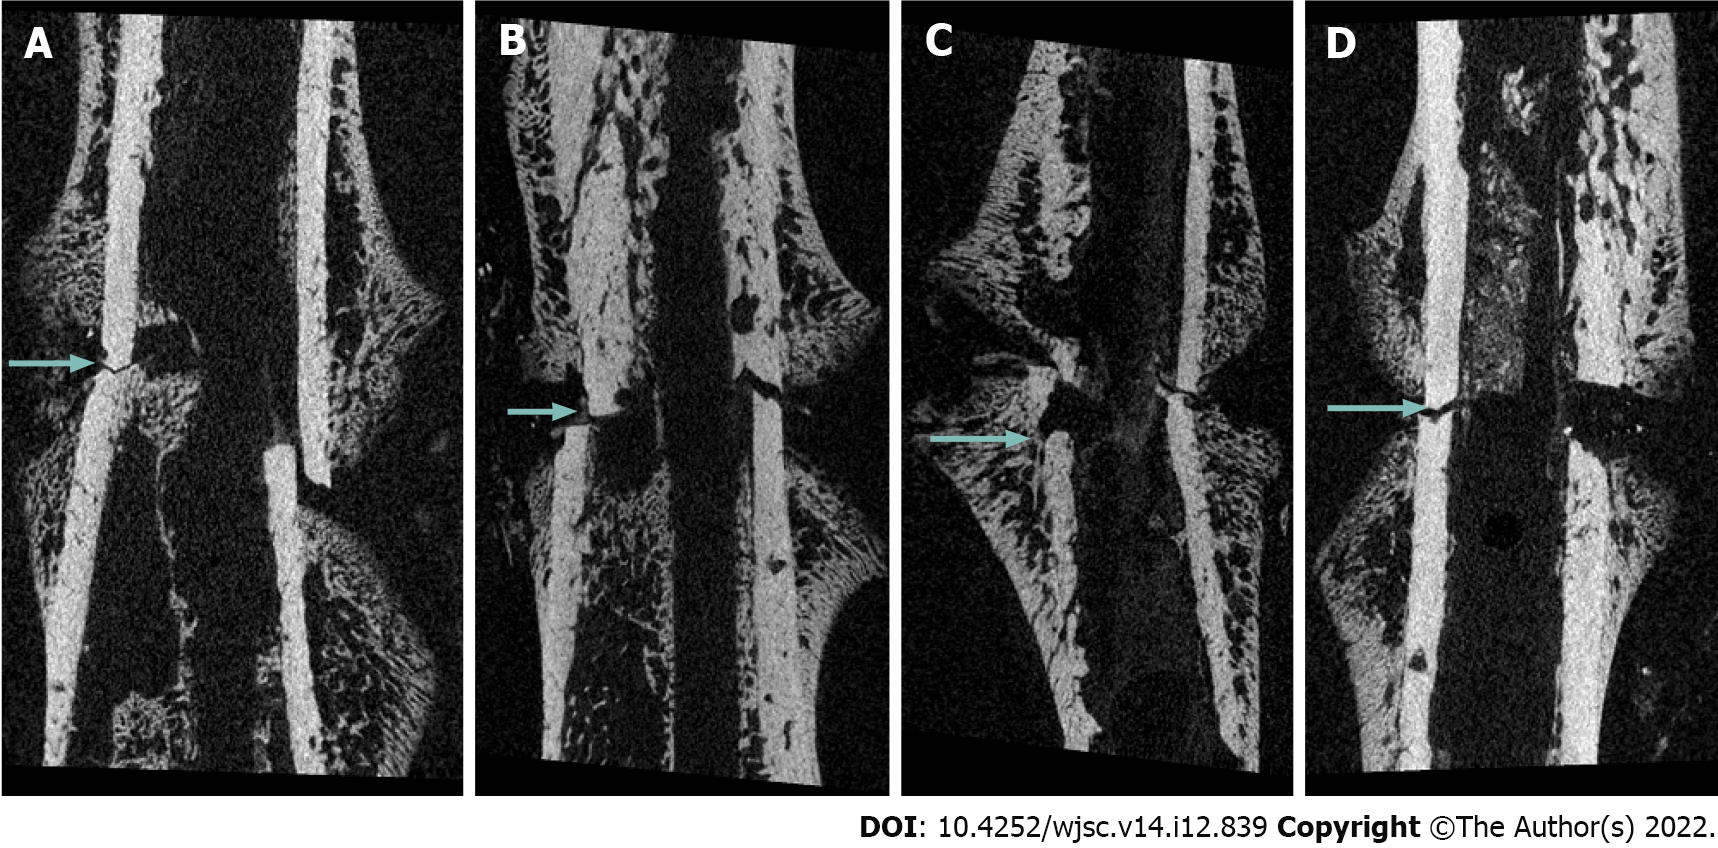
Figure 1 Micro-computed tomography imaging at 2 wk post-fracture.
A: Rats were injected with normal saline; B: Rats were injected with 2.5 × 10⁶ mesenchymal stem cells (MSCs); C: Rats were injected with 5.0 × 10⁶ MSCs; D: Rats were injected with 10.0 × 10⁶ MSCs. Callus formation was observed in all groups; however, fracture lines (arrows) were clearly observed, indicating that union had not yet occurred.
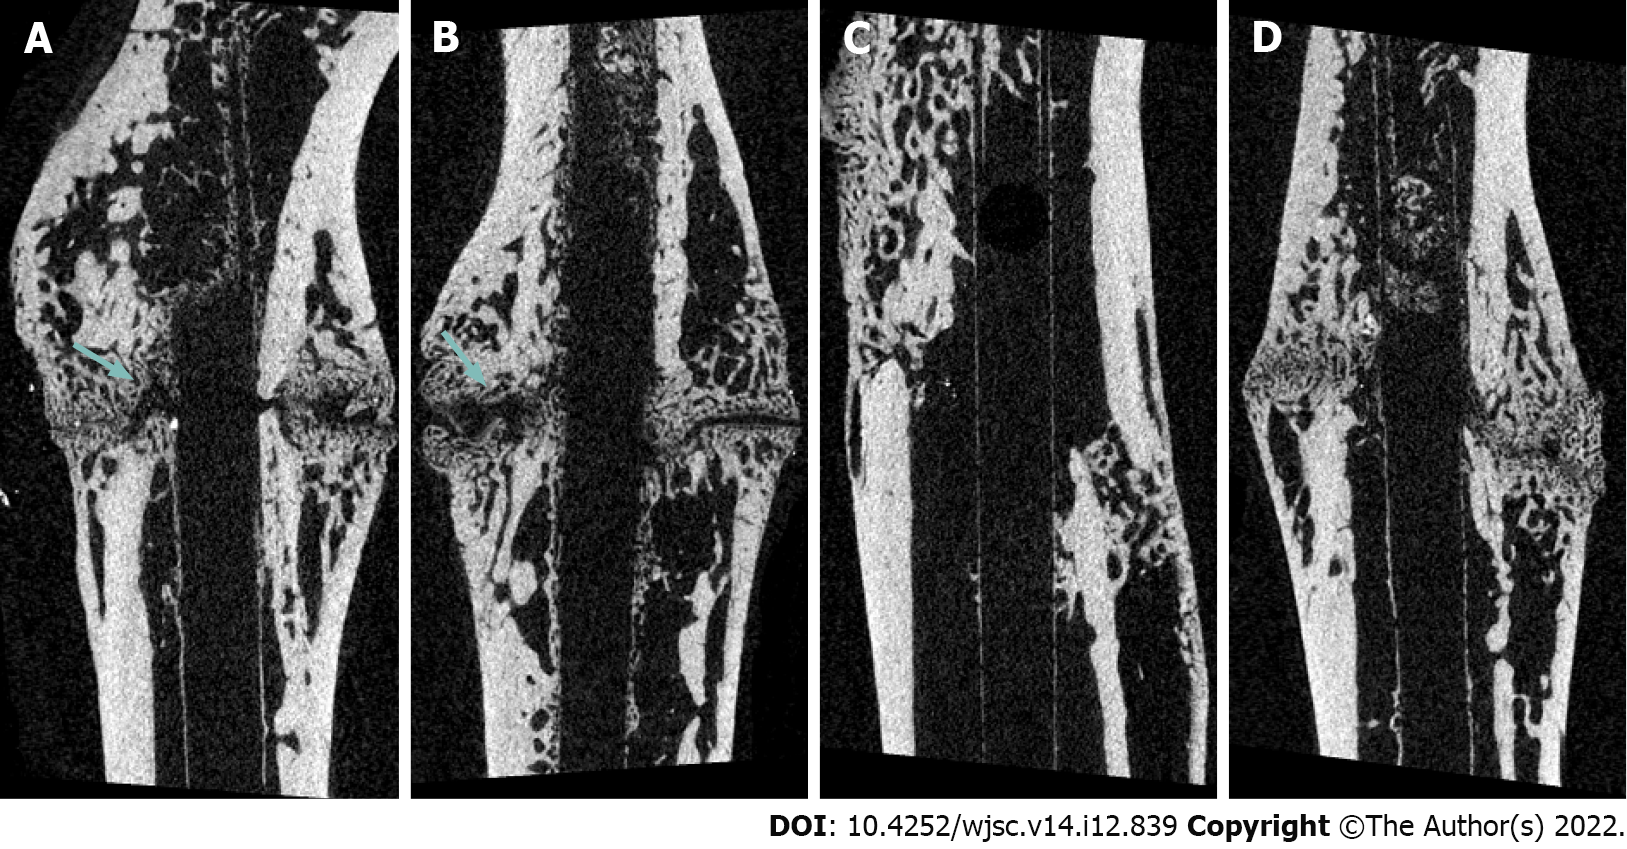
Figure 2 Micro-computed tomography imaging at 6 wk post-fracture.
A: Rats were injected with normal saline; B: Rats were injected with 2.5 × 10⁶ adipose-derived-mesenchymal stem cells (AD-MSCs); C: Rats were injected with 5.0 × 10⁶ AD-MSCs; D: Rats were injected with 10.0 × 10⁶ AD-MSCs. In the group injected with normal saline and 2.5 × 10⁶ AD-MSCs, fracture lines (arrows) were clearly observed, indicating that union had not yet occurred.
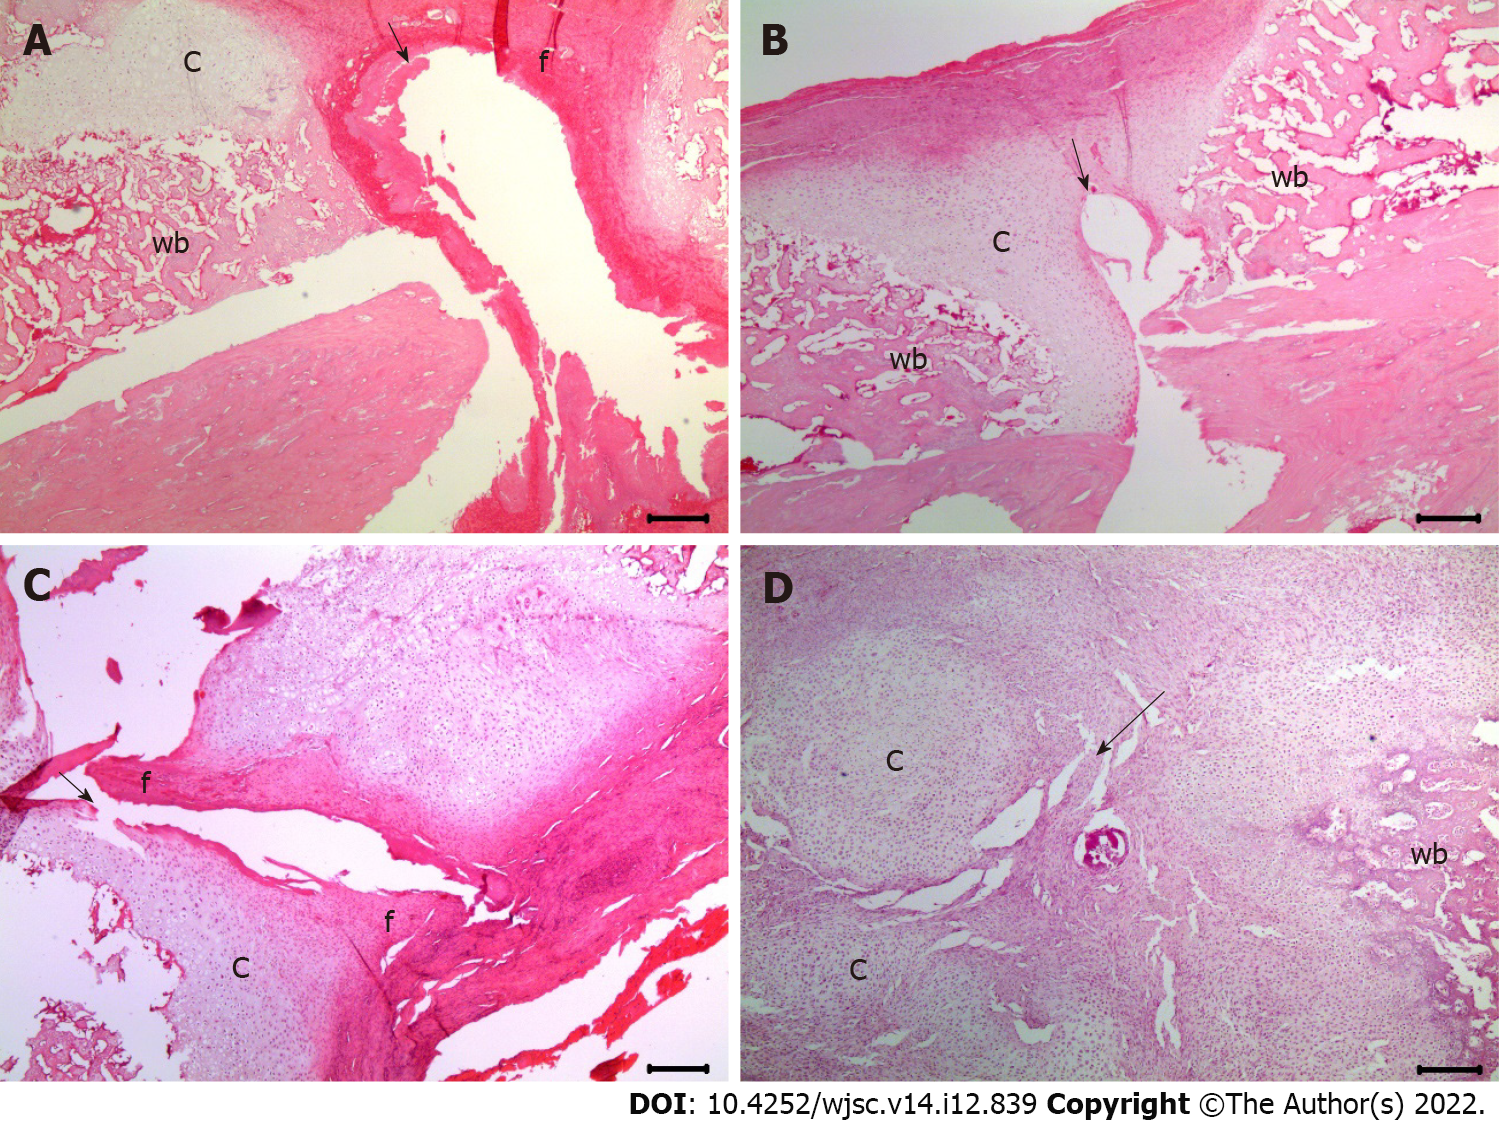
Figure 3 Assessment of histological scores for fracture healing at 2 wk post-fracture using hematoxylin and eosin staining (200 × magnification).
A: The histological score was 2 in the group injected with normal saline; B: The histological score was 3 in the group injected with 2.5 × 10⁶ mesenchymal stem cells (MSCs); C: The histological score was 4 in the groups injected with 5.0 × 10⁶ MSCs; D: The histological score was 4 in the groups injected with 10.0 × 10⁶ MSCs. The black arrows indicate the fracture lines. c: Cartilage in the fracture area; f: Fibrous tissue; wb: Woven bone.
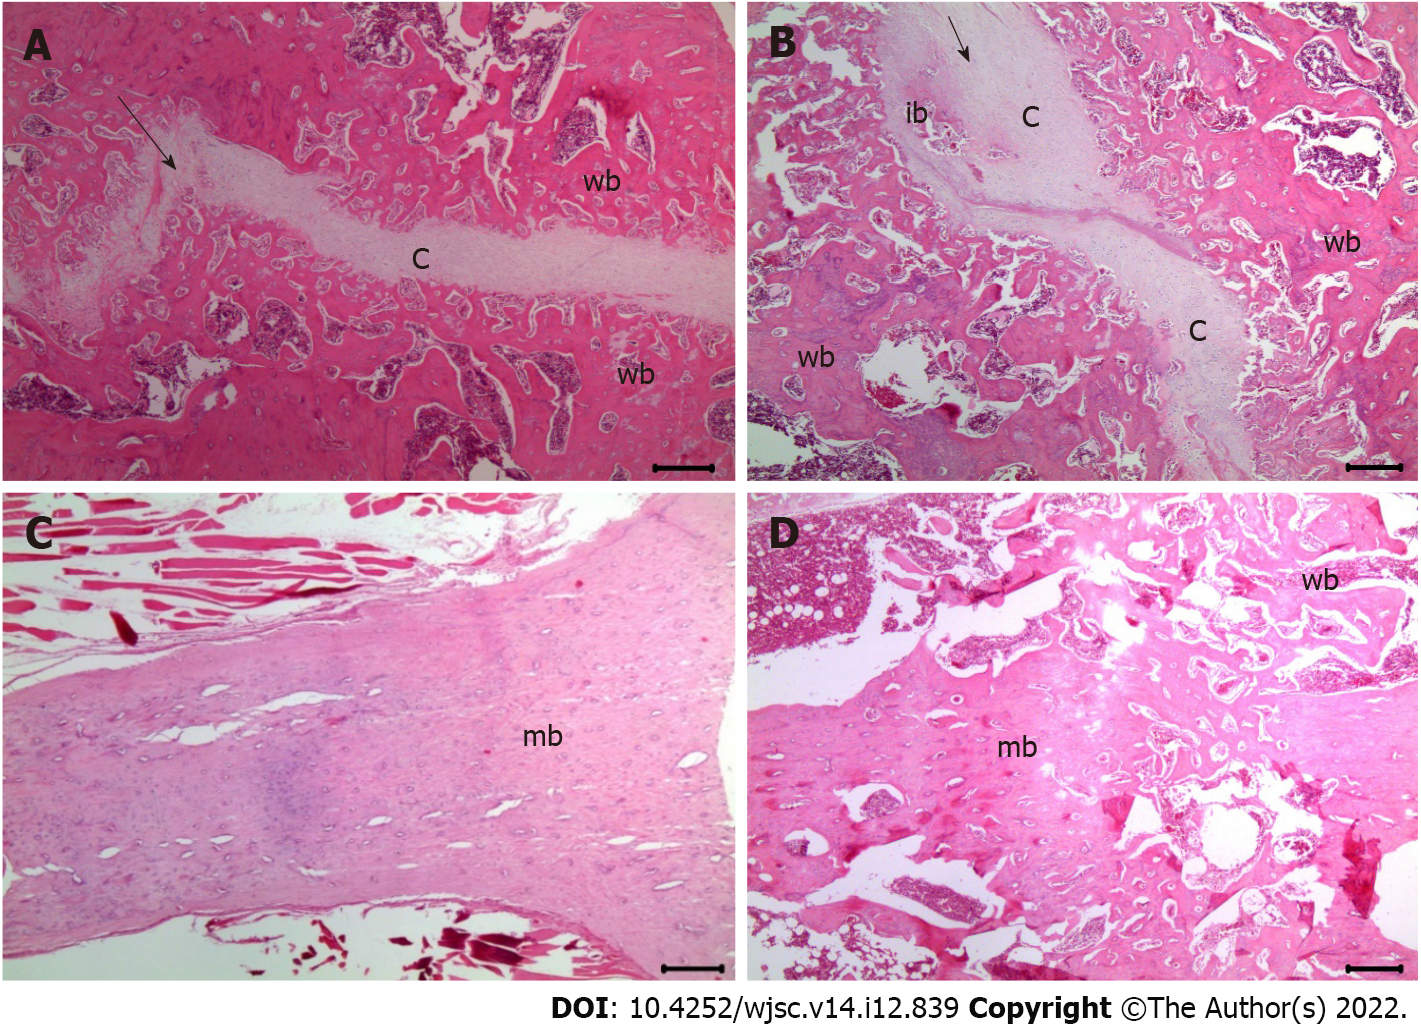
Figure 4 Assessment of histological scores for fracture healing at 6 wk post-fracture using hematoxylin and eosin staining (200 × magnification).
A: The histological score was 5 in the groups injected with normal saline; B: The histological score was 5 in the groups injected with 2.5 × 10⁶ mesenchymal stem cells (MSCs); C: The histological score was 9 in the group injected with 5.0 × 10⁶ MSCs; D: The histological score was 10 in the group injected with 10.0 × 10⁶ MSCs. The black arrows indicate the fracture lines. c: Cartilage in the fracture area; wb: Woven bone; ib: Immature bone; mb: Mature bone.
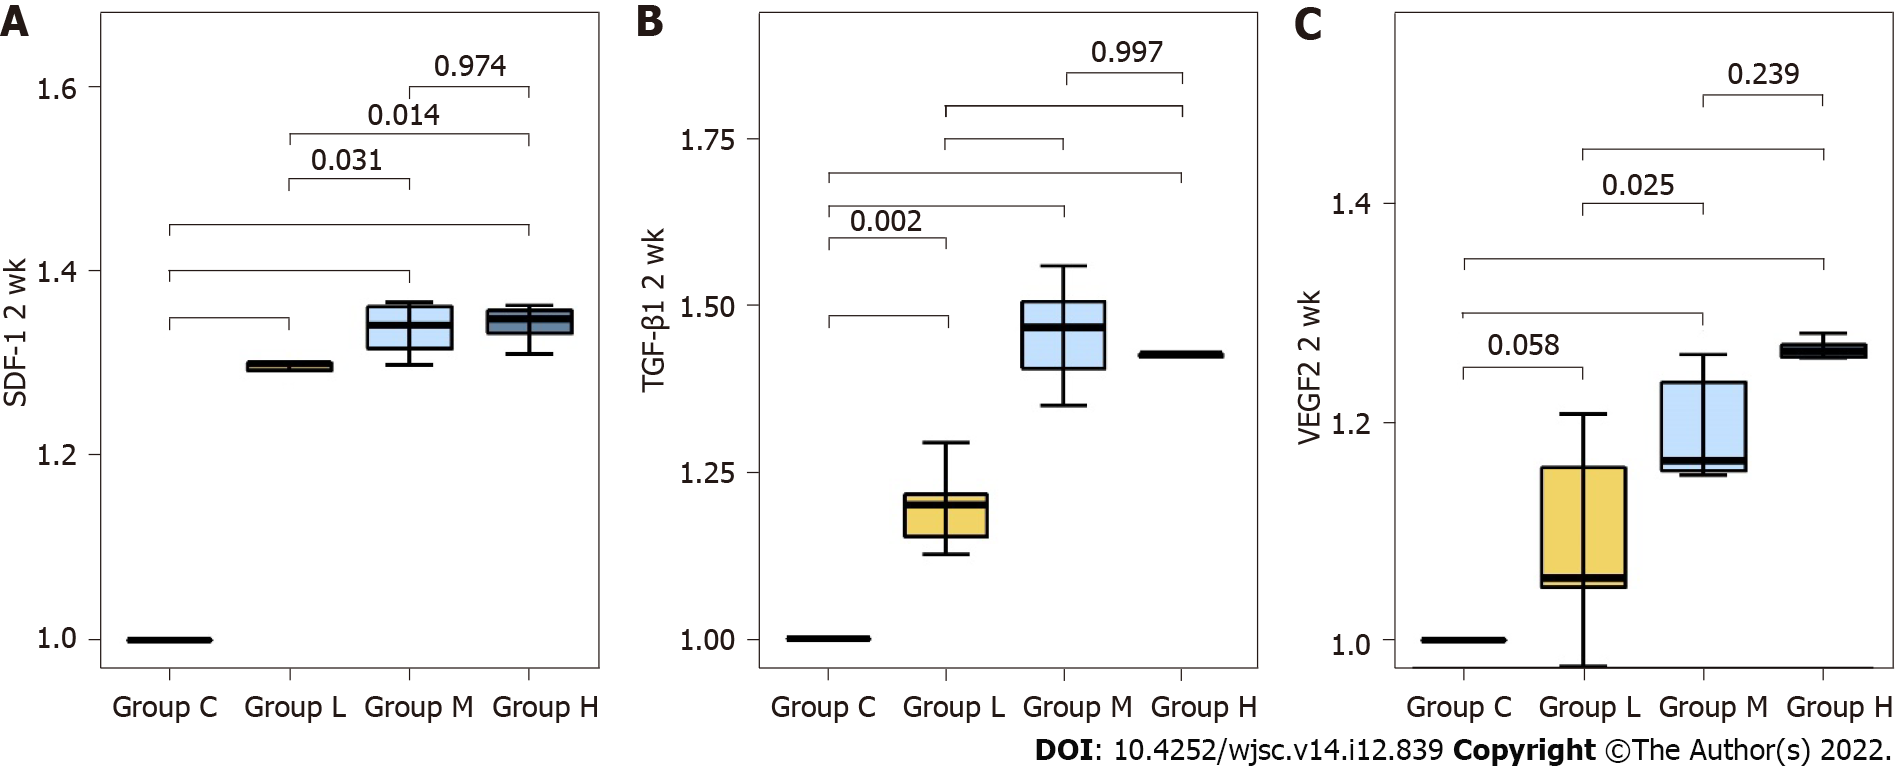
Figure 5 Relative protein expression levels of chemokines related to mesenchymal stem cell migration and angiogenesis at 2 wk post-fracture.
SDF-1: Stromal cell-derived factor 1; TGF-β1: Transforming growth factor-beta 1; VEGF: Vascular endothelial growth factor.
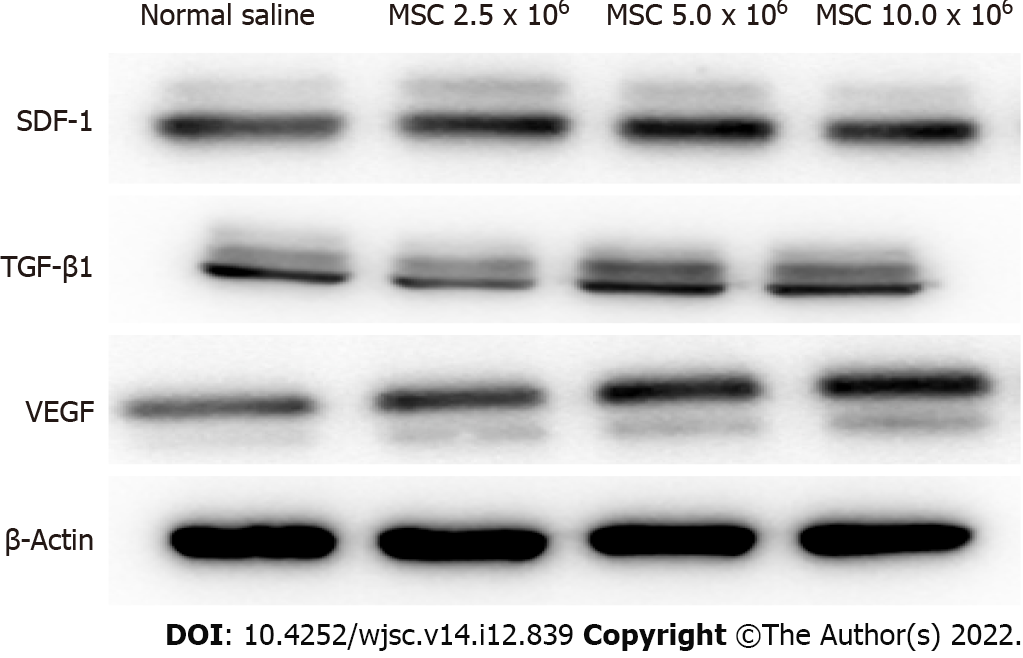
Figure 6 Western blot analysis of factors related to mesenchymal stem cell homing and angiogenesis.
At 2 wk post-fracture, the protein expressions of stromal cell-derived factor 1 (SDF-1), transforming growth factor-beta 1 (TGF-β1) and vascular endothelial growth factor (VEGF) were significantly higher in the groups injected with 5.0 × 10⁶ and 10.0 × 10⁶ mesenchymal stem cells (MSCs) compared to the group injected with normal saline. No significant difference in SDF-1, TGF-β1 and VEGF protein expression was found in the groups injected with 5.0 × 10⁶ and 10.0 × 10⁶ MSCs. MSCs: Mesenchymal stem cells; SDF-1: Stromal cell-derived factor 1; TGF-β1: Transforming growth factor-beta 1; VEGF: Vascular endothelial growth factor.
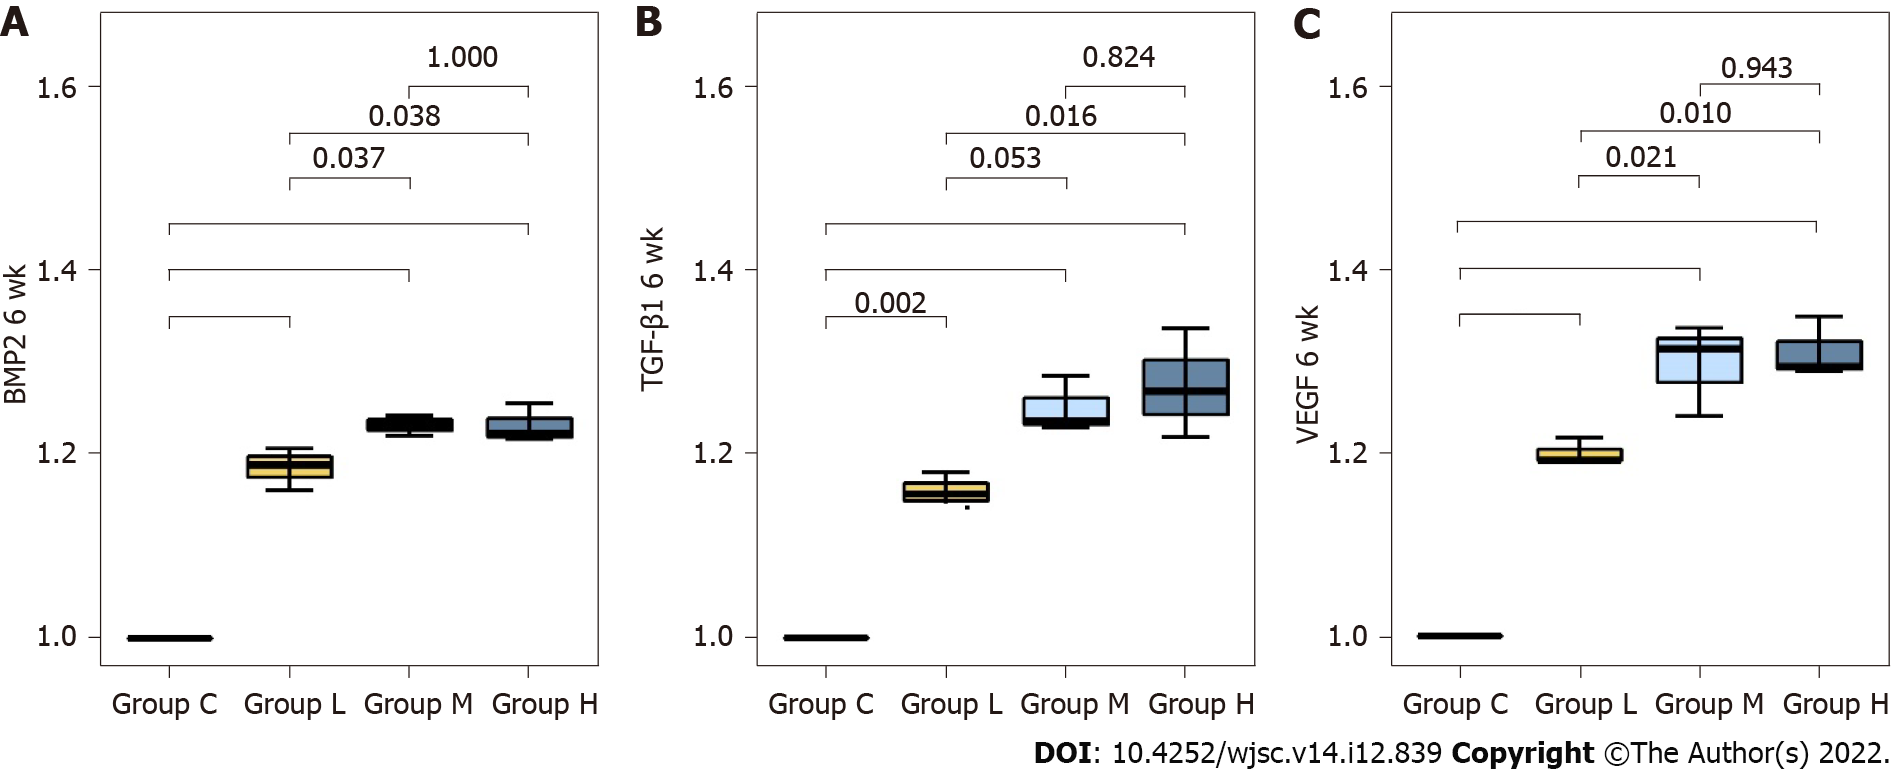
Figure 7 Relative mRNA expression levels of osteogenesis-related factors and chemokines related to angiogenesis at 6 wk post-fracture.
BMP: Bone morphogenetic protein; TGF-β1: Transforming growth factor-beta 1; VEGF: Vascular endothelial growth factor.
- Citation: Kim MS, Chung HJ, Kim KI. Optimal concentration of mesenchymal stem cells for fracture healing in a rat model with long bone fracture. World J Stem Cells 2022; 14(12): 839-850
- URL: https://www.wjgnet.com/1948-0210/full/v14/i12/839.htm
- DOI: https://dx.doi.org/10.4252/wjsc.v14.i12.839


