Copyright
©The Author(s) 2003.
World J Gastroenterol. Jun 15, 2003; 9(6): 1337-1341
Published online Jun 15, 2003. doi: 10.3748/wjg.v9.i6.1337
Published online Jun 15, 2003. doi: 10.3748/wjg.v9.i6.1337
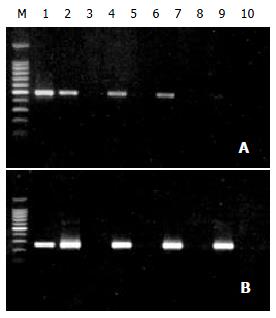
Figure 2 Amplification results from nested PCR of colon cells after laser microdissection.
Nested PCR amplification products of DNA of single cells could clearly be visualized by agarose gel electrophoresis. A: Amplification results of β-actin-outer primers. B: Amplification results of β-actin-inner primers. M: DNA markers (upper to lower: 2000, 1000, 900, 800, 700, 600, 500, 400, 300, 200, and 100 bp). 1: PCR positive control; 2: one complete section; 4, 6 and 8 are 100, 10 and 1 cell(s), respectively; 3, 5, 7 and 9 are negative controls of 2, 4, 6 and 8; 10: PCR negative control.
- Citation: Shi X, Kleeff J, Zhu ZW, Schmied B, Tang WH, Zimmermann A, BÜchler MW, Friess H. Gene-expression analysis of single cells-nested polymerase chain reaction after laser microdissection. World J Gastroenterol 2003; 9(6): 1337-1341
- URL: https://www.wjgnet.com/1007-9327/full/v9/i6/1337.htm
- DOI: https://dx.doi.org/10.3748/wjg.v9.i6.1337


