Copyright
©The Author(s) 2003.
World J Gastroenterol. Apr 15, 2003; 9(4): 765-770
Published online Apr 15, 2003. doi: 10.3748/wjg.v9.i4.765
Published online Apr 15, 2003. doi: 10.3748/wjg.v9.i4.765
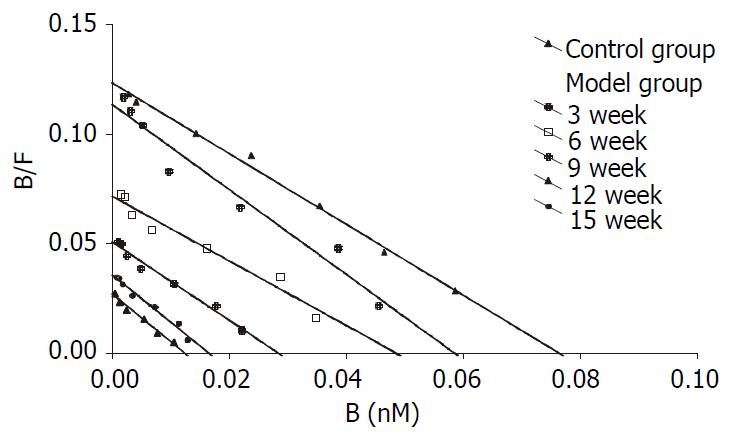
Figure 1 Scatchard analysis of GH-binding in rat liver tissue.
Microsomes of liver tissues were incubated with 125I-labeled hGH and increased concentrations of unlabeled hGH. The bound/free radioactivity ratio (Y axis) was plotted as a rectilineal func-tion of bound hormone (X axis). GH binding capacities (Bmax = intercept on X axis, RT = Bmax/protein concentration) and affinities (Kd = negative reciprocal of slope) were calculated from the competition assays by Scatchard analysis.
- Citation: Wang HT, Chen S, Wang J, Ou QJ, Liu C, Zheng SS, Deng MH, Liu XP. Expression of growth hormone receptor and its mRNA in hepatic cirrhosis. World J Gastroenterol 2003; 9(4): 765-770
- URL: https://www.wjgnet.com/1007-9327/full/v9/i4/765.htm
- DOI: https://dx.doi.org/10.3748/wjg.v9.i4.765


