Copyright
©The Author(s) 2003.
World J Gastroenterol. Mar 15, 2003; 9(3): 584-589
Published online Mar 15, 2003. doi: 10.3748/wjg.v9.i3.584
Published online Mar 15, 2003. doi: 10.3748/wjg.v9.i3.584
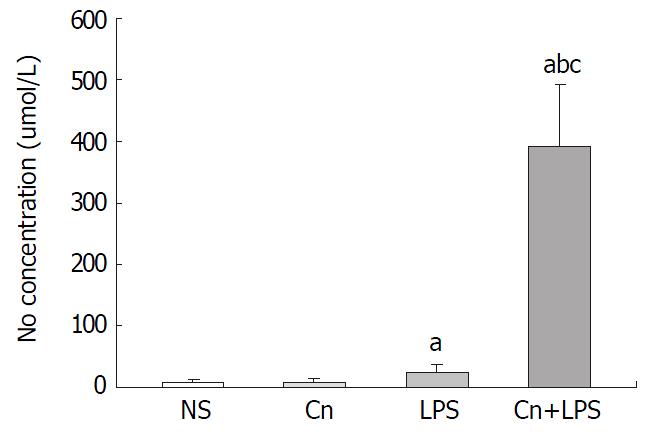
Figure 8 Comparison of NO concentration between groups(-x±s) (n = 8).
aP < 0.01, vs NS group; bP < 0.01, vs LPS group; cP < 0.05,vs Cn group.
- Citation: Ding SP, Li JC, Jin C. A mouse model of severe acute pancreatitis induced with caerulein and lipopolysaccharide. World J Gastroenterol 2003; 9(3): 584-589
- URL: https://www.wjgnet.com/1007-9327/full/v9/i3/584.htm
- DOI: https://dx.doi.org/10.3748/wjg.v9.i3.584


