Copyright
©The Author(s) 2002.
World J Gastroenterol. Jun 15, 2002; 8(3): 540-545
Published online Jun 15, 2002. doi: 10.3748/wjg.v8.i3.540
Published online Jun 15, 2002. doi: 10.3748/wjg.v8.i3.540
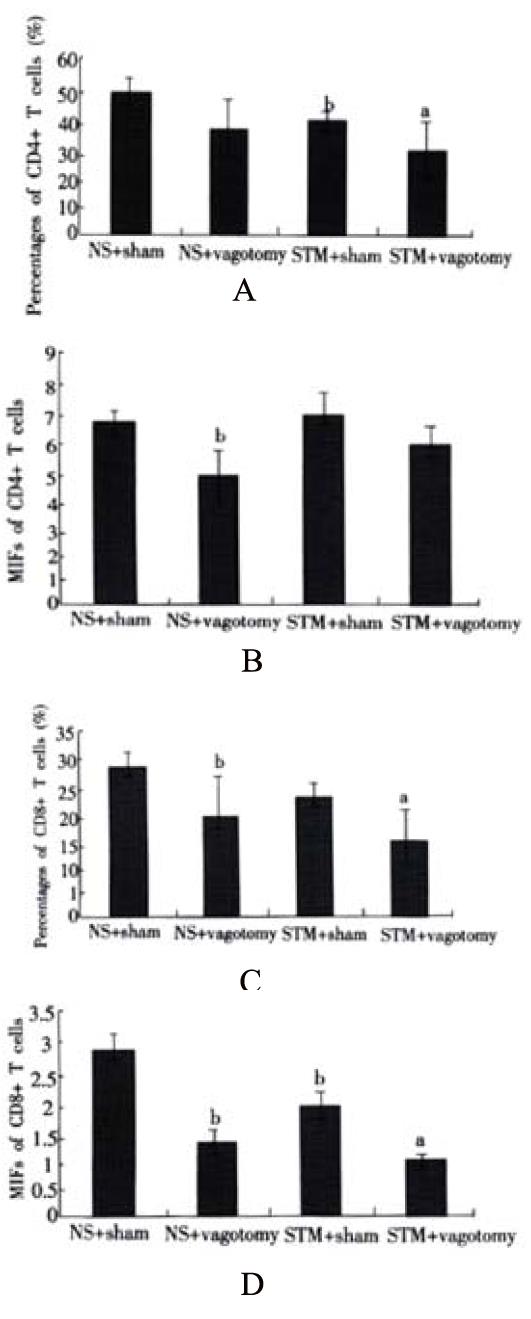
Figure 2 A: Percentages of blood CD4+ T cells.
aP < 0.05 vs. STM + sham, bP < 0.05 vs NS + sham; B: The Mean Intensities of Fluorescence (MIFs) of blood CD4+ T cells. bP < 0.05 vs NS + sham; C: Percentages of blood CD8+ T cells. aP < 0.05 vs STM + sham, bP < 0.05 vs NS + sham; D: The Mean Intensities of Fluorescence (MIFs) of blood CD8+ T cells. aP < 0.05 vs STM + sham; bP < 0.05 vs NS + sham.
- Citation: Wang X, Wang BR, Zhang XJ, Xu Z, Ding YQ, Ju G. Evidences for vagus nerve in maintenance of immune balance and transmission of immune information from gut to brain in STM-infected rats. World J Gastroenterol 2002; 8(3): 540-545
- URL: https://www.wjgnet.com/1007-9327/full/v8/i3/540.htm
- DOI: https://dx.doi.org/10.3748/wjg.v8.i3.540


