Copyright
©The Author(s) 2002.
World J Gastroenterol. Apr 15, 2002; 8(2): 323-327
Published online Apr 15, 2002. doi: 10.3748/wjg.v8.i2.323
Published online Apr 15, 2002. doi: 10.3748/wjg.v8.i2.323
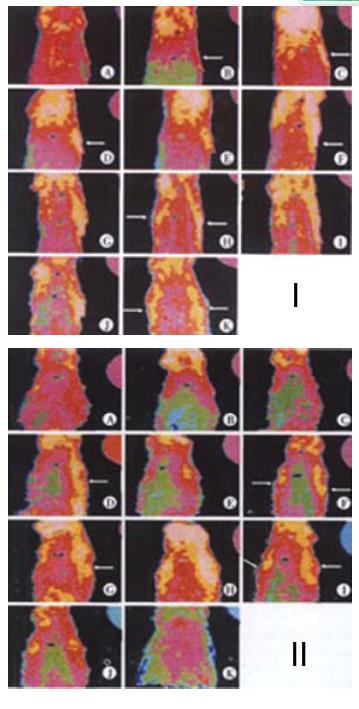
Figure 3 Continuous display of the infrared thermoimages of rabbit trunk with cholecystitis in 2 rabbits.
I. The distribution and evolution of high temperature line on the infrared thermoimage of No.11 rabbit's trunk (back and axillary aspect) A: before cholecystitis model; B: 1 d after cholecystitis, high temperature line appeared in the lateral aspect; C: on d2; D: on d3; E: on d4; F: on d7, high temperature line began to appear at the left side; G: on d8; H: on d9, marked bilateral high temperature lines; I: on d10; J: on d11; K: on d30, high temperature line remained. II. The distribution and evolution of high temperature line on the infrared thermoimage of No.8 rabbit's trunk (back and axillary aspect) A: before cholecystitis model; B: 1 d after cholecystitis; C: on d2, right high temperature line; D: on d3, marked right high temperature line appeared; E: on d4; F: on d7, left high temperature line appeared; G: on d8; H: on d9, marked bilateral high temperature lines; I: on d10; J: on d11; K: on d30, bilateral high temperature lines disappeared.
- Citation: Zhang D, Zhu YG, Wang SY, Ma HM, Ye YY, Fu WX, Hu WG. Infrared thermoimages display of body surface temperature reaction in experimental cholecystitis. World J Gastroenterol 2002; 8(2): 323-327
- URL: https://www.wjgnet.com/1007-9327/full/v8/i2/323.htm
- DOI: https://dx.doi.org/10.3748/wjg.v8.i2.323


