Copyright
©The Author(s) 2001.
World J Gastroenterol. Dec 15, 2001; 7(6): 821-825
Published online Dec 15, 2001. doi: 10.3748/wjg.v7.i6.821
Published online Dec 15, 2001. doi: 10.3748/wjg.v7.i6.821
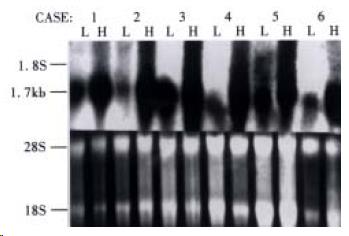
Figure 3 Differential expression of HCCA3 analyzed by Northern blot.
Upper panel shows that HCCA3 mRNA was highly expressed in HCC tissues (H), and lowly in paired surrounding liver tissues (L). A signal transcript of 1.7 kb is shown in six tumors. 28 S and 18 S rRNAs were used for evaluating the quality and quantity of RNA loading (lower panel).
- Citation: Wang ZX, Hu GF, Wang HY, Wu MC. Expression of liver cancer associated gene HCCA3. World J Gastroenterol 2001; 7(6): 821-825
- URL: https://www.wjgnet.com/1007-9327/full/v7/i6/821.htm
- DOI: https://dx.doi.org/10.3748/wjg.v7.i6.821


