Copyright
©The Author(s) 2000.
World J Gastroenterol. Oct 15, 2000; 6(5): 693-698
Published online Oct 15, 2000. doi: 10.3748/wjg.v6.i5.693
Published online Oct 15, 2000. doi: 10.3748/wjg.v6.i5.693
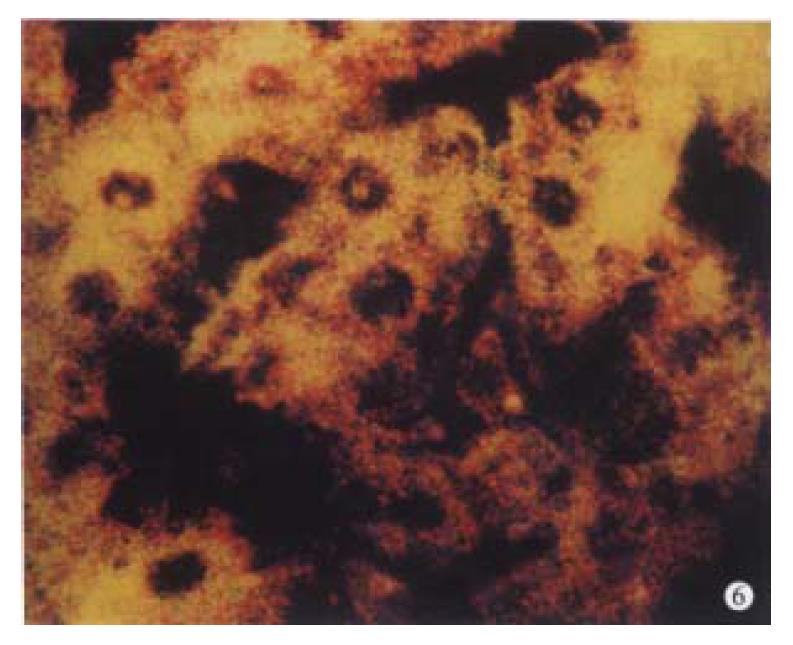
Figure 6 Coexpression of cathepsin D and CgA in HCC (grade 2).
The positive cells distributed in patch pattern (yellow). TR-labelled cathepsin D, FITC-labelled CgA × 400
- Citation: Huang XF, Wang CM, Dai XW, Li ZJ, Pan BR, Yu LB, Qian B, Fang L. Expressions of chromogranin A and cathepsin D in human primary hepatocellular carcinoma. World J Gastroenterol 2000; 6(5): 693-698
- URL: https://www.wjgnet.com/1007-9327/full/v6/i5/693.htm
- DOI: https://dx.doi.org/10.3748/wjg.v6.i5.693


