Copyright
©The Author(s) 2000.
World J Gastroenterol. Jun 15, 2000; 6(3): 411-414
Published online Jun 15, 2000. doi: 10.3748/wjg.v6.i3.411
Published online Jun 15, 2000. doi: 10.3748/wjg.v6.i3.411
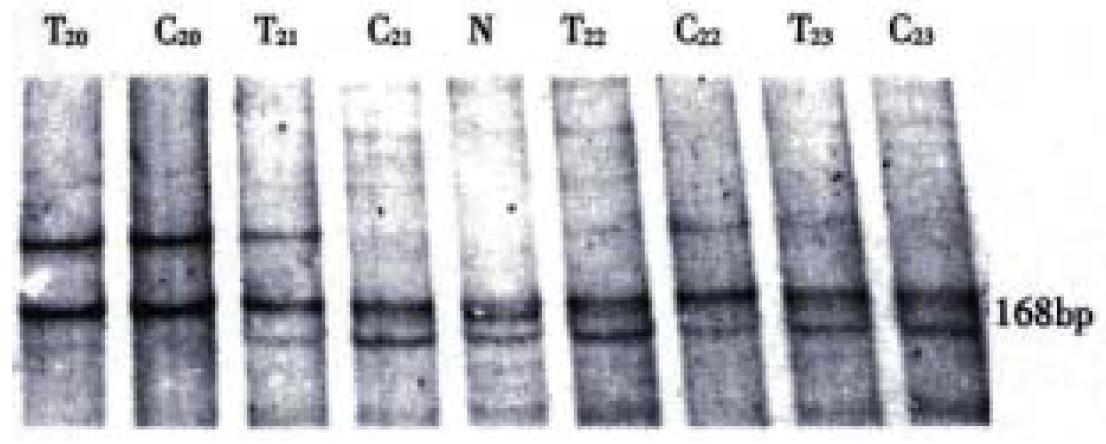
Figure 1 PCR-SSCP analysis of p16 gene intron 1 and exon 2.
At the SSCP analysis T20 and C20 showed as A pattern; T23 and C23 showed as B pattern; T21 and C21 showed as B' and B pattern, respectively; T22 and C22 showed as B and B' pattern, respectively. T = Human hepatocarcinoma; C = Adjacent non-cancerous liver cirrhosis; N = Normal human leucocyte
- Citation: Qin Y, Li B, Tan YS, Sun ZL, Zuo FQ, Sun ZF. Polymorphism of p16INK4a gene and rare mutation of p15INK4b gene exon2 in primary hepatocarcinoma. World J Gastroenterol 2000; 6(3): 411-414
- URL: https://www.wjgnet.com/1007-9327/full/v6/i3/411.htm
- DOI: https://dx.doi.org/10.3748/wjg.v6.i3.411


