
















Copyright: ©Author(s) 2026.
World J Gastroenterol. Dec 28, 2026; 32(48): 121672
Published online Dec 28, 2026. doi: 10.3748/wjg.121672
Published online Dec 28, 2026. doi: 10.3748/wjg.121672
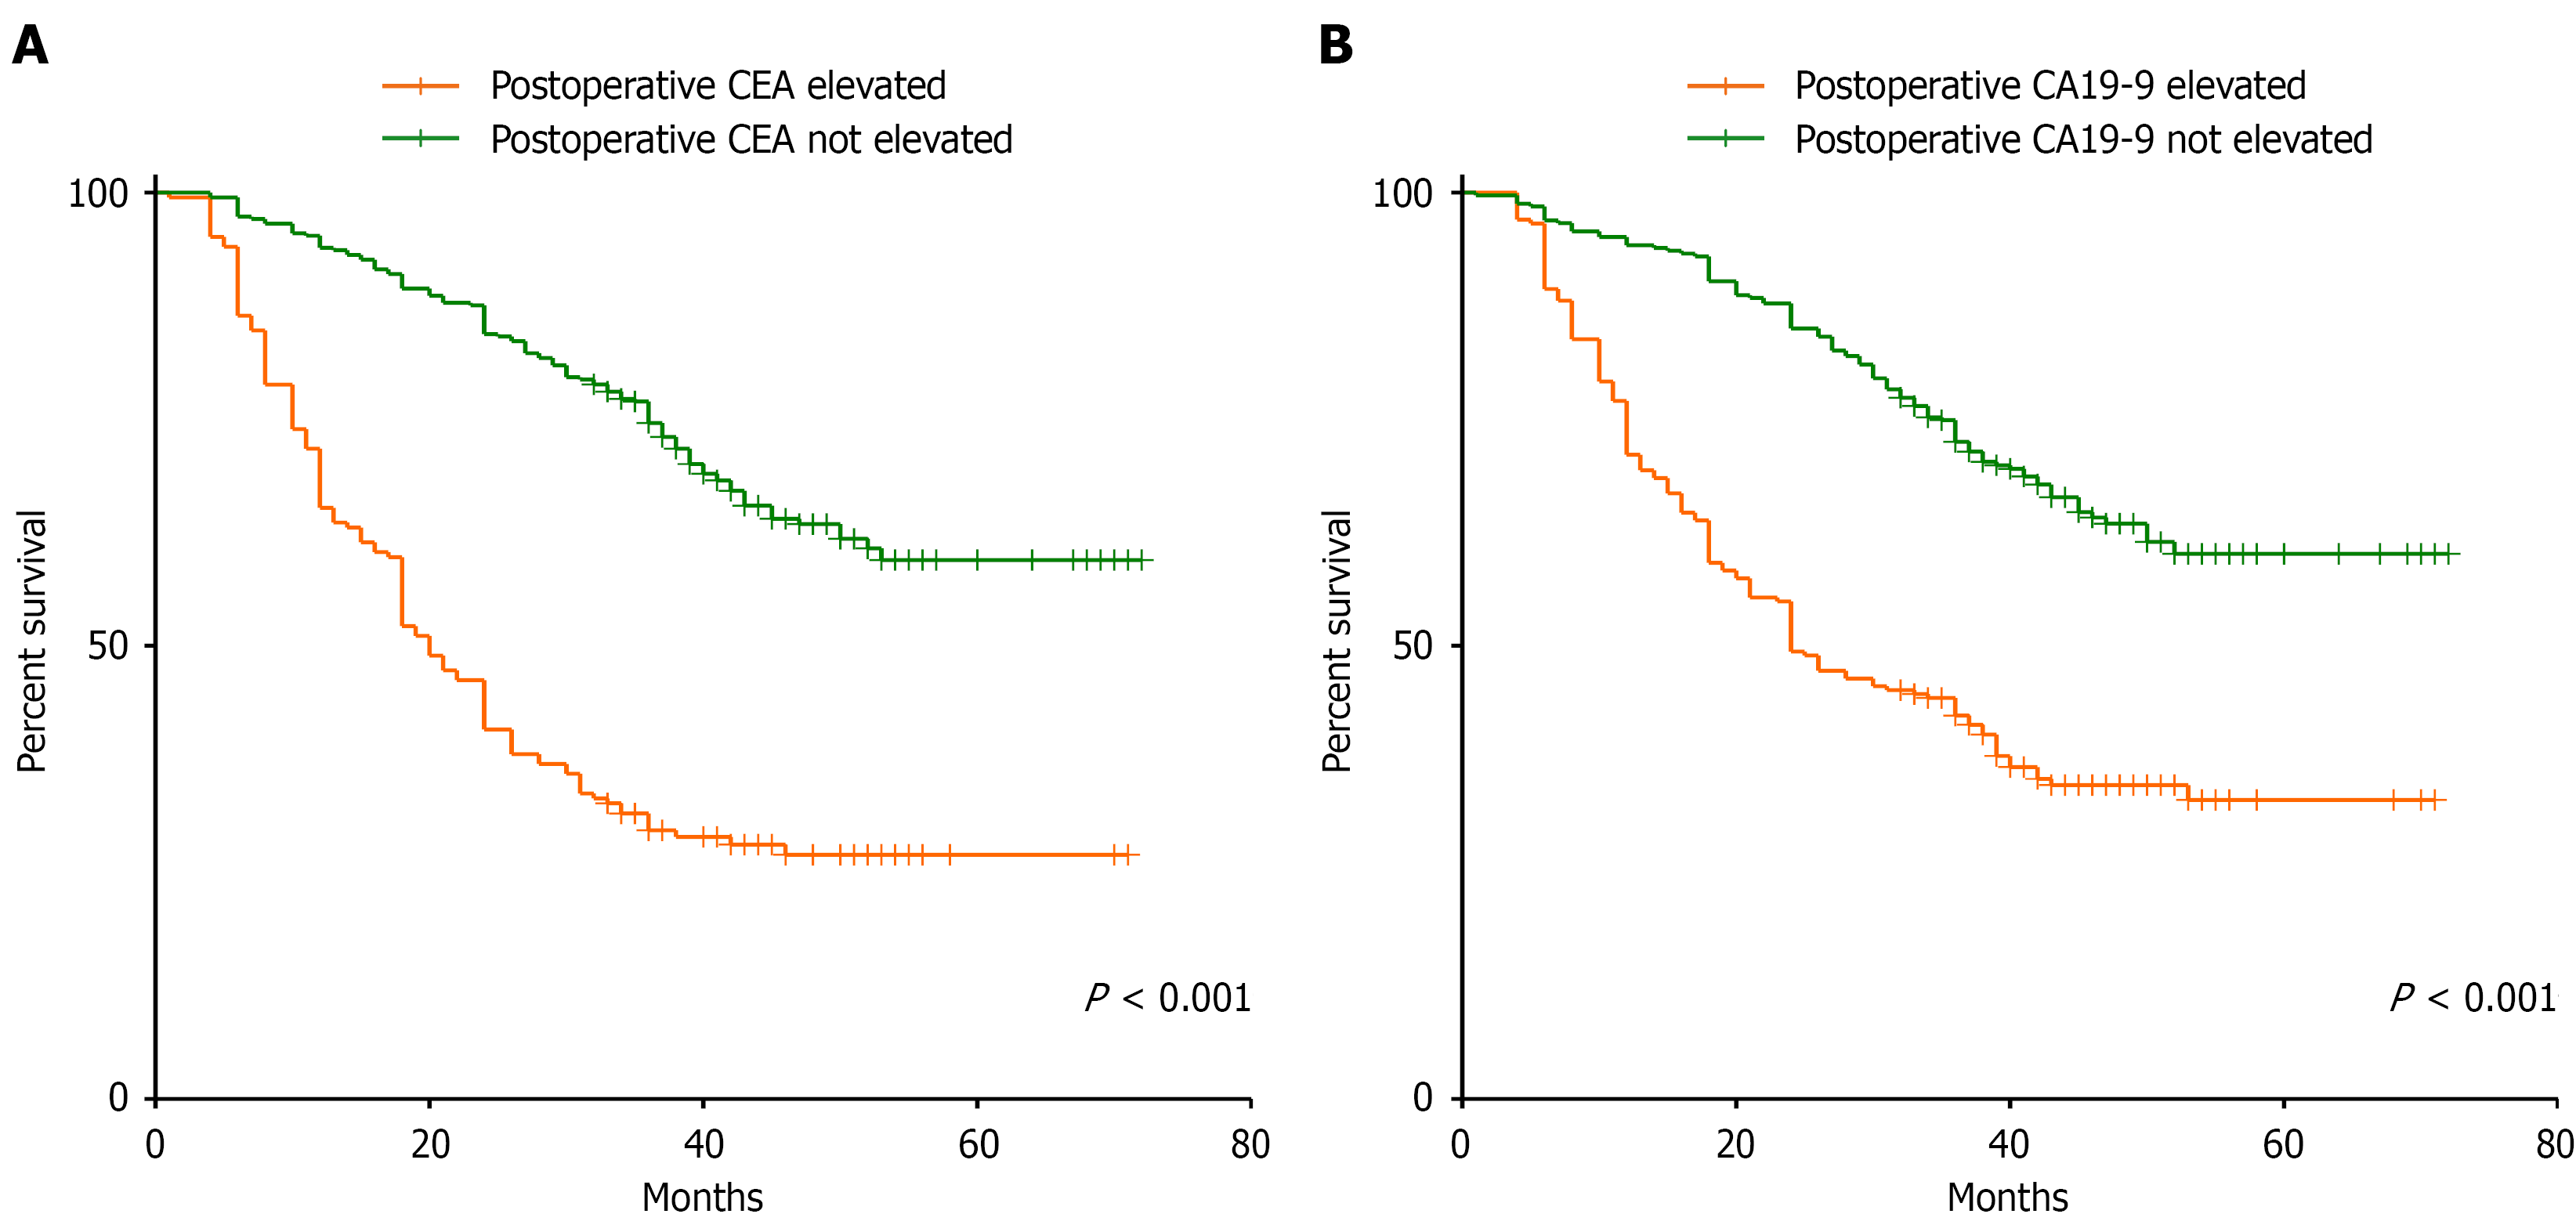
Figure 5 Exploratory Kaplan-Meier curves of overall survival according to the magnitude of postoperative tumor marker changes.
A: Overall survival according to size of change in carcinoembryonic antigen; B: Overall survival according to size of change in carbohydrate antigen 19-9. For carcinoembryonic antigen, mild and greater increases were split at the median positive change of 0.65 ng/mL. For carbohydrate antigen 19-9, mild and greater increases were split at the median positive change of 3.12 U/mL. These change thresholds were data-derived for exploratory analysis and should not be interpreted as validated clinical cutoffs.
- Citation: Zhang LX, Chang N, Su YZ, Zhang YH, Zhu XD, Zhu H, Zhou EZ, Sun MZ, Luo PQ, Xu AM, Liu Q, Wei ZJ. Prognostic value of postoperative CEA/CA19-9 positivity and elevation relative to preoperative levels in gastric cancer. World J Gastroenterol 2026; 32(48): 121672
- URL: https://www.wjgnet.com/1007-9327/full/v32/i48/121672.htm
- DOI: https://dx.doi.org/10.3748/wjg.121672