Copyright
©The Author(s) 2025.
World J Gastroenterol. Feb 7, 2025; 31(5): 102249
Published online Feb 7, 2025. doi: 10.3748/wjg.v31.i5.102249
Published online Feb 7, 2025. doi: 10.3748/wjg.v31.i5.102249
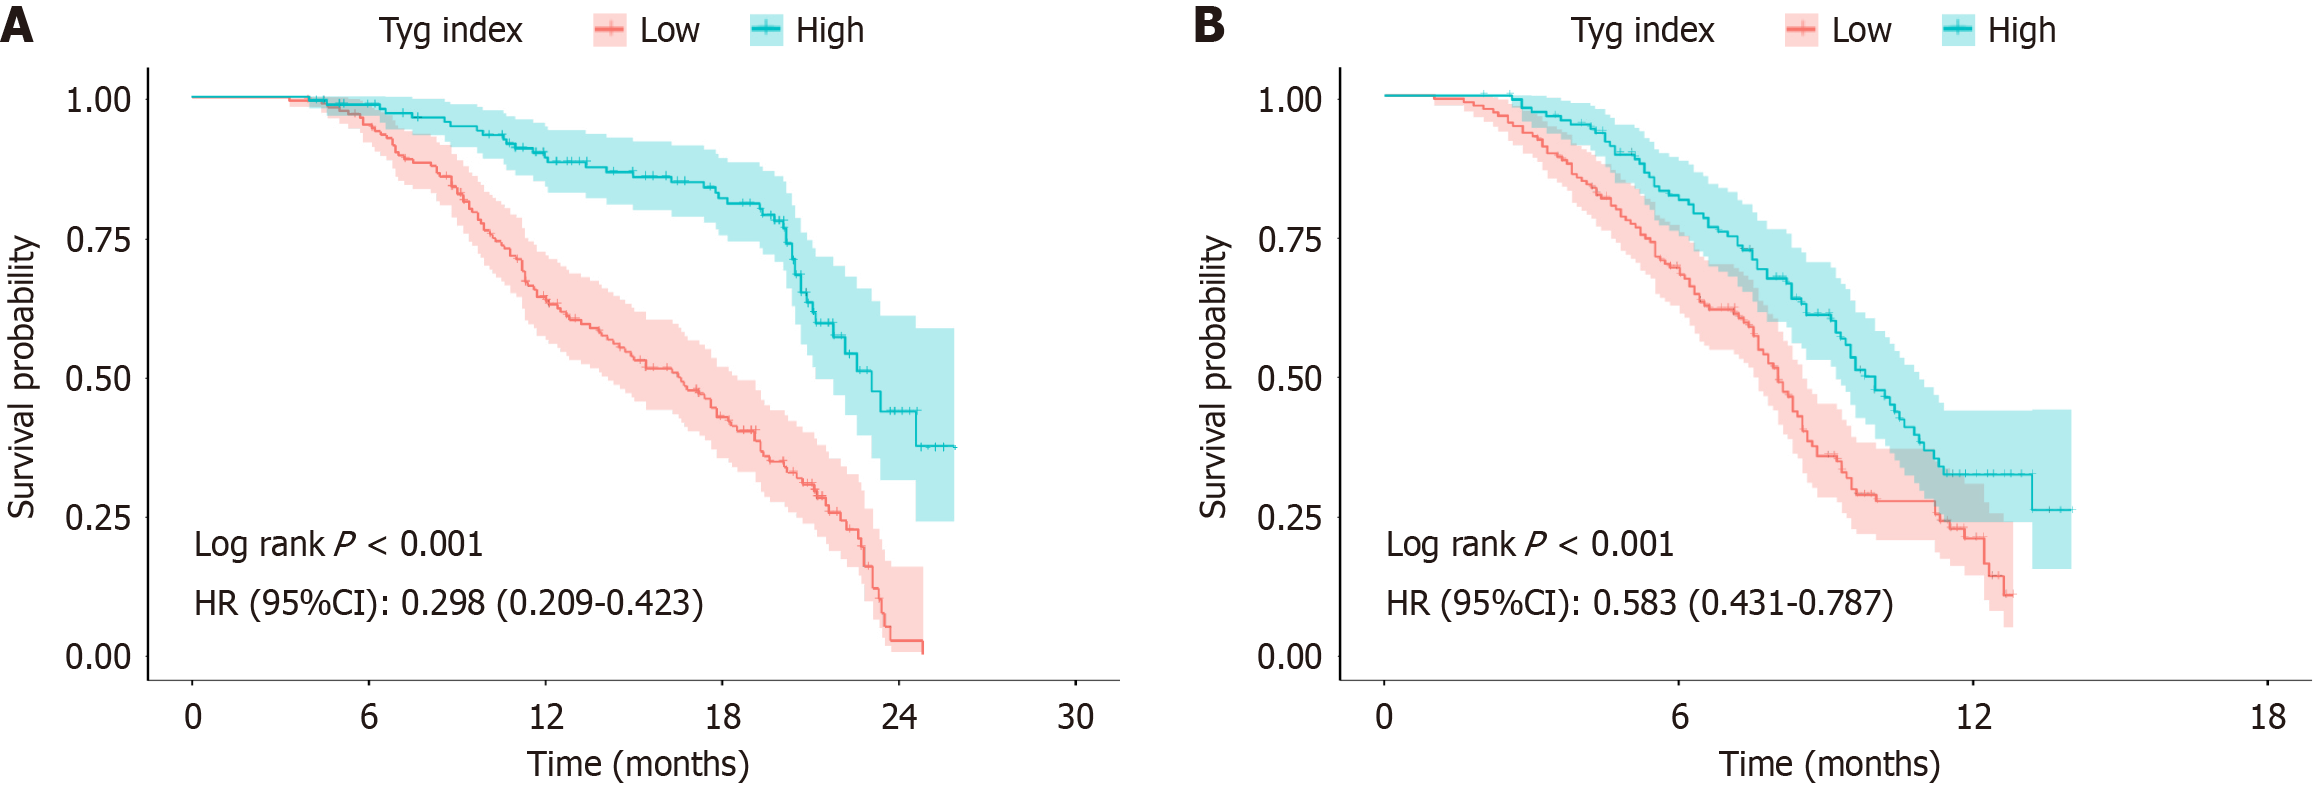
Figure 2 Effects of different triglyceride glucose indexes on the long-term prognosis of gastric cancer patients.
A: Kaplan-Meier plot of the triglyceride glucose (TyG) index < 1.79 and TyG index ≥ 1.79 groups; B: Kaplan-Meier plot of overall survival in the TyG index < 1.79 and TyG index ≥ 1.79 groups. TyG: Triglyceride glucose; HR: Hazard ratio; CI: Confidence interval.
- Citation: Yao ZY, Ma X, Cui YZ, Liu J, Han ZX, Song J. Impact of triglyceride-glucose index on the long-term prognosis of advanced gastric cancer patients receiving immunotherapy combined with chemotherapy. World J Gastroenterol 2025; 31(5): 102249
- URL: https://www.wjgnet.com/1007-9327/full/v31/i5/102249.htm
- DOI: https://dx.doi.org/10.3748/wjg.v31.i5.102249


