
















©The Author(s) 2025.
World J Gastroenterol. Nov 7, 2025; 31(41): 111256
Published online Nov 7, 2025. doi: 10.3748/wjg.v31.i41.111256
Published online Nov 7, 2025. doi: 10.3748/wjg.v31.i41.111256
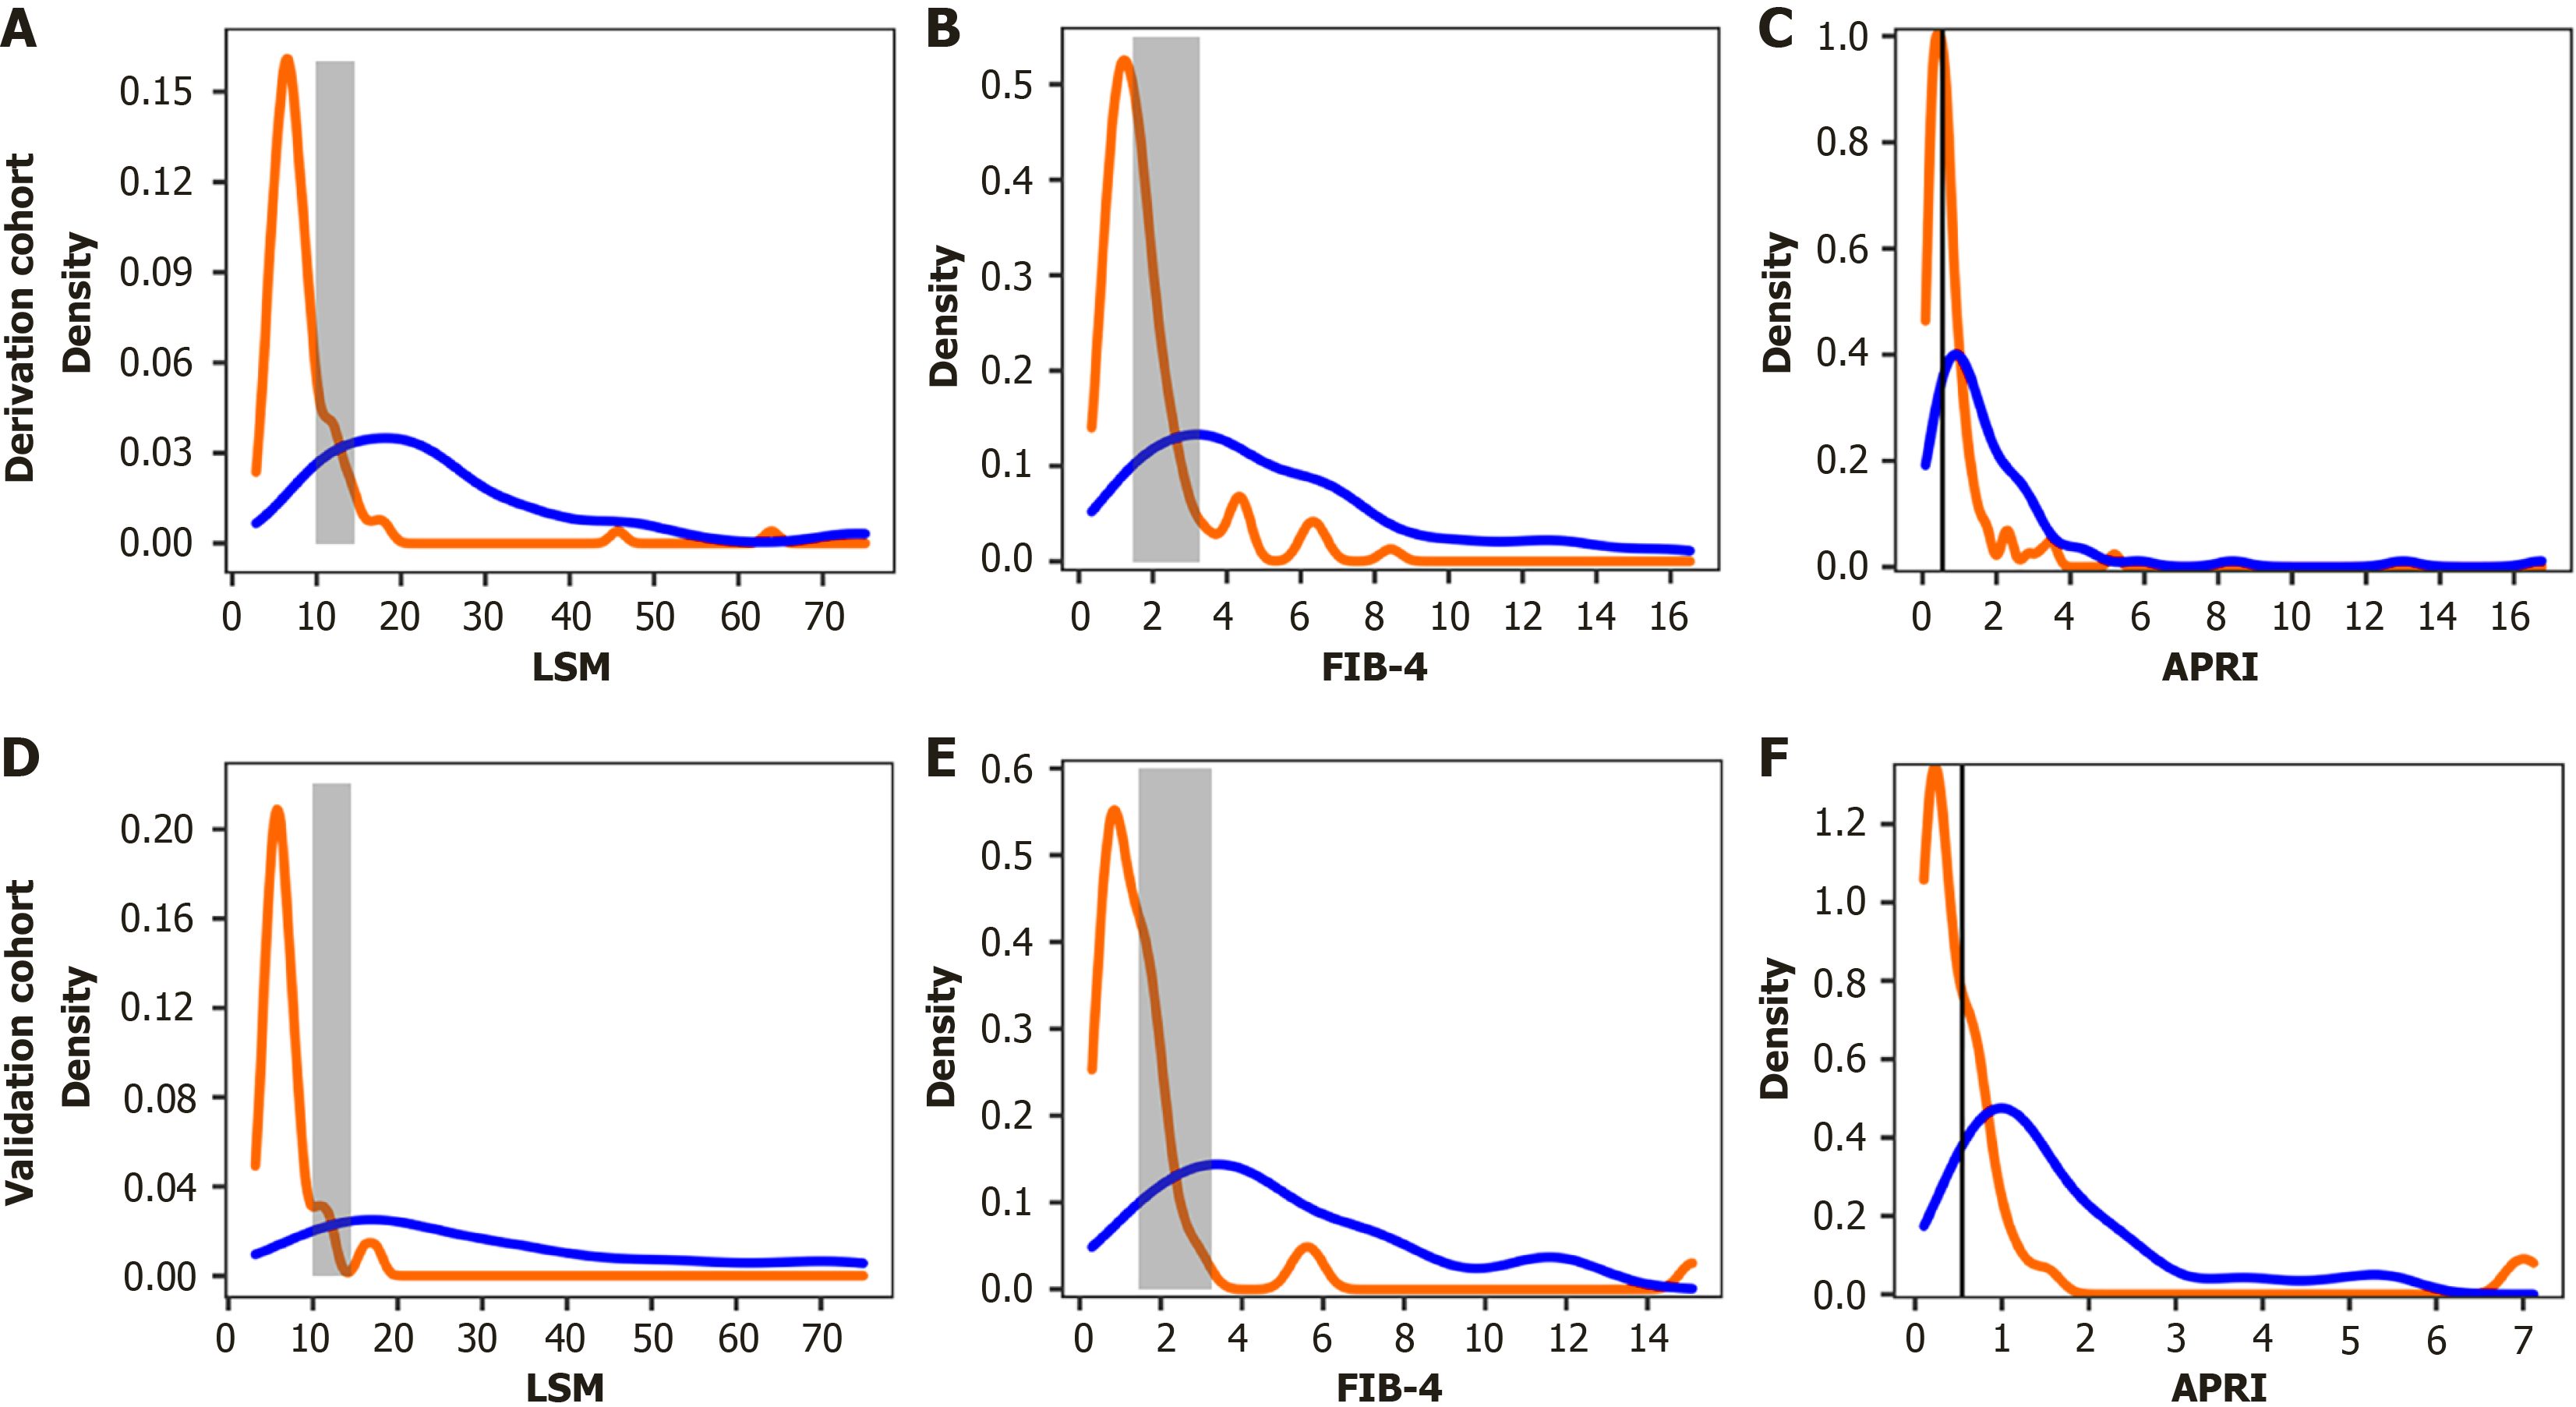
Figure 3 Density plot of liver stiffness measurement, fibrosis-4, and aspartate aminotransferase to platelet ratio index score in the derivation and validation cohorts.
Patients with Ludwig stage I and II at liver biopsy are represented in red lines, those with Ludwig stage III and IV in blue lines. A-F: In the liver stiffness measurement (LSM) density plot (A and D), the grey area highlights the interval of LSM in which transient elastography is not reliable. The grey area in the fibrosis-4 (FIB-4) density plot (B and E) expresses the range of LSM in FIB-4 as proposed by Sterling et al[16]. The black straight line in the APRI score density plot (C and F) expresses the cut-off of 0.54 validated in primary biliary cholangitis[17]. LSM: Liver stiffness measurement; FIB-4: Fibrosis-4; APRI: Aspartate aminotransferase to platelet ratio index.
- Citation: Chen JL, Hou YX, Liu Y, Jiang YY, Wang XB. Real-world performance of transient elastography in assessing advanced fibrosis in Chinese patients with primary biliary cholangitis. World J Gastroenterol 2025; 31(41): 111256
- URL: https://www.wjgnet.com/1007-9327/full/v31/i41/111256.htm
- DOI: https://dx.doi.org/10.3748/wjg.v31.i41.111256